
Analysis of Customer Perceived Value, Satisfaction, Loyalty and the
Moderating Role of Customer Demographics: A Study of Indonesian
Train Service
Yasintha Soelasih, Efendi and Erwin Bramana Karnadi
Faculty of Economics and Business, Atma Jaya Catholic University, Jakarta, Indonesia
Keywords: customer perceived value, customer satisfaction, customer loyalty, customer relationship management,
public transport
Abstract: The growth in Indonesian rail transportation is rapid after some improvements were made. The momentum
of this growth should be maintained by increasing customer satisfaction. This research focuses on executive
trains. Under the framework of Customer Relationship Management, the researchers are interested to find
out if customer perceived value of executive train affect customer satisfaction and loyalty using age,
expense and education as moderators. The samples collected were474 through systematic random sampling.
Samples were obtained in Gambir Train Station, Jakarta. Data was processed using SPSS mediation,
moderation and process analysis. The results suggest that age and expense donot moderate the impact of
customer perceived value and customer satisfaction on customer loyalty. Education can moderate customer
satisfaction on loyalty.
1 INTRODUCTION
Delivering value has become the obligation of
every business entity, either private or public. Value
as being perceived by the customers has been seen
as a multi-dimensional construct (Sheth, Newman
and Gross, 1991; Yang et al., 2014; Sweeney and
Soutar, 2001). The discussion on perceived value is
rarely conducted in isolation. Perceived value will
become a more interesting topic if discussed in
relation with other marketing constructs, such as
customer satisfaction and loyalty. Thereby, this
study deals with the intricacy of how a business or
industry develop a relationship with the customers
(Customer Relationship Management).
Various studies have examined the links between
quality, perceived value, satisfaction and loyalty
(BoksbergerandMelsen, 2011; Lin et al., 2005;
Gallarza, Ruiz-Molina and Gil-Saura, 2016).
Compared to service quality, perceived value and
satisfaction are considered more direct determinants
of customer loyalty (Anderson and Sullivan, 1993;
Sweeney, Soutar and Johnson, 1999; McDougall and
Levesque, 2000; Dolarslan, 2014). However, the
literature has not found common ground, as some
researchers found that customer satisfaction does not
always affect customer loyalty (Kumar,Pozza and
Ganesh,2013). In addition, as perceived value is
seen as a central construct in customer decision
making (Bolton and Drew, 1991; Heskett, Sasser
and Hart, 1990; Zeithaml, 1988), more studies on it
and its link with satisfaction and loyalty are
warranted.
Furthermore, the relation between perceived
value and satisfaction with loyalty may not be
straightforward. Some customer characteristics, such
as age, expense and education may interfere to
weaken or strengthen the relations (Qayyum, Khang
and Krairit, 2013). Even though there are abundance
of research which examine the mediators on the
relation between satisfaction and loyalty, few has
examined the mediators on perceived value – loyalty
link (Dolarslan, 2014; Qayyum, Khang and Krairit,
2013).
Indonesia Railway Company (railway
administrator) faces the challenge of improving the
values delivered to the passengers in competing with
other modes of transportation, such as buses and
Soelasih, Y., Efendi, . and Bramana Karnadi, E.
Analysis of Customer Perceived Value, Satisfaction, Loyalty and the Moderating Role of Customer Demographics: A Study of Indonesian Train Service.
DOI: 10.5220/0008438101750183
In Proceedings of the 4th Sriwijaya Economics, Accounting, and Business Conference (SEABC 2018), pages 175-183
ISBN: 978-989-758-387-2
Copyright
c
2019 by SCITEPRESS – Science and Technology Publications, Lda. All rights reserved
175

airplanes. In 2002, as a result of deregulation in
airline industry, low cost airlines emerge in
Indonesia. As people prefer the faster way of
transport provided by airlines, there has been a
decrease in executive train passengers by 40% since
2002. In 2010, one train route between Jakarta and
Bandung was also forced to be closed as a result of
diminishing passengers after the opening of a new
toll road, Cipularang. The toll road provides other
modes of travel by using bus or car which shortens
the travel time (OECD, 2013). Anyhow, despite of
the competition from other modes of transportation,
the number of train passengers is still increasing in
the recent years. The total number of train
passengers in Indonesia has increased from 198
million in 2011 to 296 million in 2015 (Biro
PusatStatistik, 2018). The current research will focus
on executive train service, as it is in more direct
competition with other mode of transportation,
especially airplane, which charge similar fare but
provide faster service. This research will focus on
finding the influence of customer perceived value
and customer satisfaction on customer loyalty
moderated by age, expense and education.
2 LITERATURE REVIEW
The research on Customer Relationship
Management (CRM) has received numerous
attention (Webster, 1992; Jones et al., 2015;
O’Malley and Prothero, 2004; Wang et al., 2004).
The end result of CRM is no other than customer
loyalty, which manifests in different ways. Every
industry or business wants to retain its customers.
Only by first retaining its current customer base or
purchase (relationship length), a business can have a
good foundation to further develop its revenue
through more purchase of the same product
(relationship depth), cross purchase (relationship
breadth), and new customers (Blattberg, Getz and
Thomas, 2001; Wang et al., 2004).In this way, CRM
results in better revenue through multiple sources,
which are relationship length, depth, breadth, and
new customers.
The study of CRM would not bring much
benefit, if it does not deal with the antecedents of
relationship outcomes or loyalty. The current study
proposes customer perceived value and customer
satisfaction as the antecedents of customer loyalty.
2.1 Customer Perceived Value
Customer perceived value is a very important
concept in marketing (Wang et al., 2014), other than
satisfaction. However, the understanding of this
concept is not well known, especially by marketing
practitioners. Zeithaml (1988) defined customer
perceived value as the overall value of a product
utility based on the difference between what is
received and what is given.
Other researchers view customer perceived value
as a multi-dimensional concept. For example, Sheth,
Newman and Gross(1991) introduce 5 dimensions
ofperceived value, which are functional, social,
emotional, epistemic, and conditional. Yang et al.
(2014) then developed similar dimension for tourism
industry, which are quality, functional/ price,
emotional, and experiential values. However, this
research will refer to Sweeney andSoutar (2001) and
dividesperceived value into quality/ performance,
price, emotional and social dimensions.
2.2 Customer Satisfaction
Customer satisfaction is a condition felt by a
consumer after consuming a product or service.
Customer satisfaction is developed by comparing
expectation before consumption with perception
after consumption (Oliver, 1999). If perception after
consumption exceeds expectation, then there is
satisfaction. In contrast, if perception is lower than
expectation, then there is dissatisfaction. Satisfaction
is not always a cognitive value, but it also includes
affective values. It is known as an affective
evaluative response (Oliver, 1992; Patterson and
Spreng, 1997).Satisfaction will lead customers to
come back, which will lead to loyalty (Lim et al.,
2016). Rahman et al. (2015), in their research about
apartments, argue that the key factor that can affect
customer’s buying decision is loyalty.
Strandvikand Liljander (1994) argue that
perceived value has an influence on satisfaction.
Others argue that customer perceived value presents
enhancement in customer satisfaction (Fornell et al.,
1996; Bojanic, 1996).The research done by Wang et
al. (2014) and Yang et al. (2014) confirmed the
positive impact of perceived value on satisfaction.
Thus, the following hypothesis is proposed:
H1: Customer perceived value has an
influenceoncustomersatisfaction
SEABC 2018 - 4th Sriwijaya Economics, Accounting, and Business Conference
176

2.3 Customer Loyalty
Loyalty is a commitment that a customer wants
to consume a product again in the future (Oliver,
1999). To be complete, loyalty needs to include
attitude and behavior (Jacoby and Chesnut, 1978).
Oliver (1999) argues that loyalty is shown when the
consumer is confronted by persuasion from
competing products. Loyal consumers are those who
are not persuaded by competitors’ products. A
consumer’s loyalty is also shown through word of
mouth and willingness to pay more (Dolarslan,
2014).
Loyaltyis the effect felt by consumers after
satisfaction. If a consumer feels high satisfaction,
then they are likely to have a commitment to
consume the product again (Anderson and Sullivan,
1993; Wang et al., 2004); to have more usage of a
service (Bolton and Lemon, 1999); and to engage in
positive word of mouth (Brown et al., 2005;
Gallarza and Gil-Saura, 2006).
H2: Customer satisfactionhas an influence on
customer loyalty
Loyalty is the effect felt by consumers after
satisfaction. If a consumer feels high satisfaction,
then they are likely to have a commitment to
consume the product again (Anderson and Sullivan,
1993).The concept of satisfaction is closely related
to the concept of perceived value. They are different,
but these concepts complete one another (Eggert and
Ulaga, 2002). Thus, similar to satisfaction, perceived
value can also affect loyalty. Sirdeshmukh, Singh
and Sabol (2002) argue that superior value affect
customer loyalty. Research done byMcDougall and
Levesque (2000) has shown the impact of perceived
value on loyalty.
H3: Customer perceived value has an influence
on customer loyalty
A research by Eggert and Ulaga (2002) found
that customer satisfaction is a better predictor of
loyalty than customer perceived value. They indicate
that the mediation of satisfaction provides a better
prediction than the direct influence of customer
perceived value on loyalty. Lam et al. (2004) also
found the mediation of customer satisfaction on
customer loyalty. Wang et al. (2004) found full
mediation of customer satisfaction on the
relationship between customer perceived value and
customer loyalty.
H4: Customer perceived value has an influence
on customer loyaltywith the mediation of customer
satisfaction.
Agreeing with the concept that consumers are the
co-creator of value (VargoandLusch, 2008),
Dolarslan (2014) argues that a consumer’s
characteristics can affect value. Mittal and
Kamakura (2001) have confirmed the moderation of
various demographics characteristics on the relation
between satisfaction and repurchase behaviour.
Thus, a person’s age, expense and education can
affect (moderate) consumer loyalty.
H5: The influence of customer perceived value
on customer loyalty are moderated by a) age, b)
expense, c) education.
H6: The influence of customer satisfaction on
customer loyalty are moderated by a) age, b)
expense, c) education.
Figure 1: Research Model
-Age
- Expense
- Education
Customer
Perceived Value
Customer
Loyalty
Customer
Satisfaction
Analysis of Customer Perceived Value, Satisfaction, Loyalty and the Moderating Role of Customer Demographics: A Study of Indonesian
Train Service
177

3 RESEARCH METHOD
This research observed the consumer loyalty of
executive train consumers in Java Island. The
population is executive train users in Java Island.
Samples are obtained from Gambir Train Station,
Jakarta, Indonesia. Respondents are chosen using
systematic random sampling. Samples are observed
for every 2
nd
passenger found at Gambir Train
Station, Jakarta, Indonesia. The total number of
respondents observed are 474 respondents.
Consumers of executive train were chosen because
they can readily change their consumption to other
modes of transportation, such as airplane, due to
price similarity.
The measures in this study are derived from
multiple authors. Customer perceived value has 15
items derived from Sweeney and Soutar (2001) and
Ruiz-Molina and Gil-Saura (2008). Customer
satisfaction has 3 items derived fromGallarza and
Gil-Saura (2006). Customer loyalty has 4 items
derived from Yang and Paterson (2004). All
variables were measured on semantic differential
scale ranging from 1 to 10 denoting their level of
agreement. The scale items are presented in the
Appendix.
4 RESULTS AND DISCUSSIONS
We did validity and reliability tests on the
indicators. Based on the research model, we use
SPSS. The results are in the following table:
Table 1: Reliability and validity tests.
Variable
Cronbach α
p
Customer perceived
value
0.820
0.00
Customer satisfaction
0.853
0.00
Customer loyalty
0.926
0.00
Table 1 shows the results of reliability and
validity tests. Cronbach’s alpha shows that the
variables are reliable, as their values are 0.60 or
higher. Similarly, the correlation values show that
the variables are valid. Since the variables are
reliable and valid, they are used for this research.
We observed 474 samples. We can see the
respondent characteristics in table 2 below. The
following are the respondent characteristics:
Table 2: Respondents’ characteristics.
No.
Details
No. of resp
%
1.
Gender:
Male
Female
282
192
59.5
40.5
2.
Age:
18 – 22 years
23 – 27 years
28 – 33 years
34 – 38 years
39 – 43 years
44 – 48 years
49 – 53 years
54 – 58 years
59 – 63 years
87
93
71
54
46
40
40
27
16
18.4
19.6
15.0
11.4
9.7
8.4
8.4
5.7
3.4
3.
Education:
Elementary
Junior High
High School
Diploma
Bachelor
Master
Doctoral
2
10
112
58
220
63
9
0.4
2.1
23.6
12.2
46.4
13.3
1.9
4.
Expense (in
millions
Rps):
< 1,5
1,5 – 2,5
2,5 – 3,5
3,5 – 4,5
4,5 – 5,5
5,5 – 6,5
6,5 – 7,5
> 7,5
69
92
69
64
51
26
20
83
14.6
19.4
14.6
13.5
10.8
5.5
4.2
17.5
5.
Frequency:
1 time
2 times
3 times
4 times
>4 times
89
79
60
44
202
18.8
16.7
12.7
9.3
42.6
Total
474
100
Table 3 shows that most executive train
passengers are male, and the highest proportion are
23-27 years old, bachelor graduate, spend Rp.
1,500,001 –2,500,000 (Rupiah) per month and have
used executive trains more than 4 times.
To test the hypotheses, we use SPSS macro:
Introduction to mediation, moderation, and
conditional process analysisfrom Hayes (2013).
The results of hypothesis 1 test show that R
2
is
0.61, which means that 61% of the variation in
customer satisfaction is explained by the variation in
SEABC 2018 - 4th Sriwijaya Economics, Accounting, and Business Conference
178

customer perceived value, and the rest 39% is
explained by unobserved variables. The result also
shows that p-value is 0, which means the variable is
statistically significant with t statistics equals to
27.25.
Test results using SPSS macro is shown below:
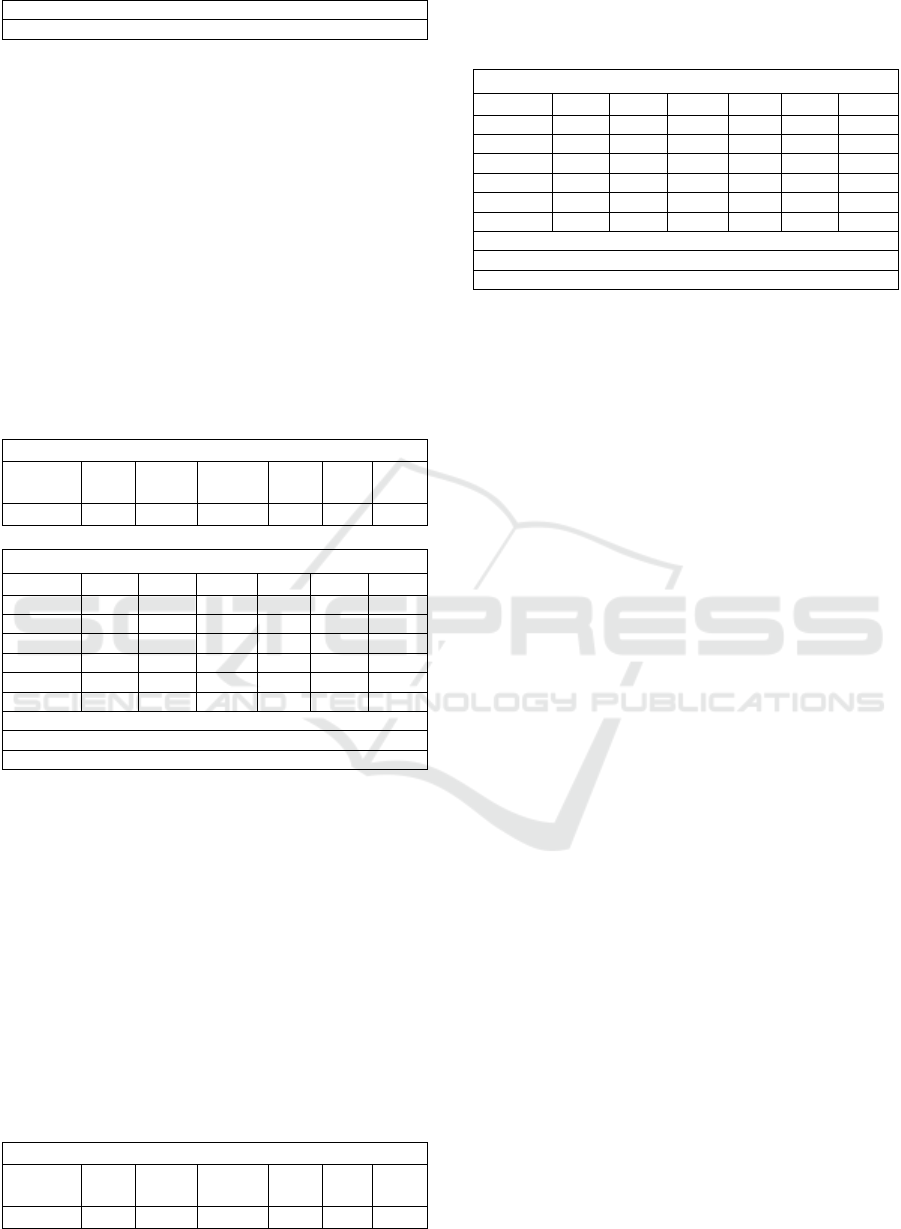
Table 3: The influence of CPV on CS
Outcome: CS
Model Summary
R
R-sq
MSE
F
df1
df2
p
.782
.611
11.96
742.52
1.00
472
.000
Model
coeff
se
t
p
LLCI
ULCI
Consta
nt
1.361
1
.769
8
1.
77
.078
-.15
2.87
CPV
.187
.006
9
27.
3
.000
.17
.20
The values of LLCI and ULCI for Customer
Perceived Value (CPV) indicate that both are
positive. There is no zero in between the two values,
which means a significant relation. Therefore, we
can see that customer perceived value has a
significant influence on customer satisfaction. This
means the result confirms hypothesis 1, there is an
influence of customer perceived value on consumer
satisfaction.
Hypothesis 2, 3 and 4 are tested using Model 4
of SPSS macro:
Table 4: The direct and indirect influence of CPV on CL
Outcome: CL
Model Summary
R
R-sq
MSE
F
df1
df2
p
.843
.71
15.30
576.29
2.00
471
.000
Model
coeff
se
t
p
LLC
I
ULC
I
Cons
tant
2.87
8
.874
3.29
.001
1.16
4.6
CS
.7
.052
13.39
.000
.595
.8
CPV
.11
.013
8.97
.000
.087
.137
Direct effect of X on Y
Effect
SE
t
p
LLCI
ULCI
.1119
.0125
8.9749
.0000
.0874
.1365
Indirect effect of X on Y
Effect
Boot
SE
Boot
LLCI
Boot
ULCI
CS
.1306
.0152
.1011
.1599
Normal theory tests for indirect effect
Effect
se
Z
p
.1306
.0109
12.0138
.0000
The result shows R
2
equals to 0.71, which means
71% of the variation in customer loyalty is explained
by the variation in customer perceived value and
customer satisfaction. P-value is 0 shows that the
variables are significant in influencing customer
loyalty. The t statistics of customer satisfaction and
perceived values are 13.4 and 8.97, respectively, are
above 1.96. The p-value for both are also below α =
5%. Therefore, there is an influence of customer
satisfaction on customer loyalty, and there is an
influence of perceived value on customer loyalty.
Therefore, hypothesis 2 and 3 are accepted.
For the indirect effect, the results indicate that
the influence coefficient is 0.13, with the value
ULCI and LLCI do not have zero value in between.
Therefore, there is an influence of customer
perceived value on loyalty with the mediation of
customer satisfaction. This result supports the
studies of Oliver (1999), Jacoby and Chesnut(1978),
Dolarslan (2014), Anderson and Sullivan (1993),
McDougall and Levesque (2000). This confirms the
theory that customer satisfaction developed from
customer perceivedvalue have an influence on
customer loyalty.
To test hypothesis 5 and 6, model 15 SPSS
macrowithmediation and moderationvariables was
employed. For hypothesis 5 and 6 tests, we divide
them into three parts which are: the influence of (5a)
customer perceived value and (6a) customer
satisfaction on customer loyalty moderated by age;
the influence of (5b) customer perceived value and
(6b) customer satisfaction on customer loyalty
moderated by expense; the influence of (5c)
customer perceived value and (6c) customer
satisfaction on customer loyalty moderated by
education.
The result of hypothesis 5a and 6a tests are
shown below:
Table 5: The influence of CPV and CS on CL moderated
by age
Outcome: CL
Model Summary
R
R-
sq
MSE
F
df1
df2
p
.843
.71
15.30
231.14
5.00
468
.000
Model
coeff
se
t
p
LLCI
ULCI
Constant
1.205
2.125
.567
.571
-2.97
5.4
CS
.52
.13
3.93
.000
.258
.77
CPV
.16
.032
5.08
.000
.100
.226
Age
1.09
1.28
.85
.4
-1.44
3.6
Int_1
.123
.081
1.51
.131
-.036
.283
Int_2
-.034
.0198
-1.73
.085
-.073
.004
Product terms key:
Analysis of Customer Perceived Value, Satisfaction, Loyalty and the Moderating Role of Customer Demographics: A Study of Indonesian
Train Service
179
int_1 CS X age
int_2 CPV X age
The results above indicate that age does not
weaken or strengthen the influence of customer
perceived value on customer loyalty, and customer
satisfaction on customer loyalty. This is shown by p-
value above 0.05 on interaction 1 and 2. The value
of LLCI and ULCI going through zero point for both
interactions. Therefore, the moderations have
brought insignificant outcomes. In conclusion,
hypothesis 5a and 6a are rejected.
The results of hypothesis 5b and 6b tests are as
follows:
Table 6: The influence of CPV and CS on CL moderated
by expense
Outcome: CL
Model Summary
R
R-
sq
MSE
F
df1
df2
p
.8445
.71
15.22
232.78
5.00
468
.000
Model
coeff
se
t
p
LLCI
ULCI
Constant
.556
2.124
.2617
.794
-3.62
4.73
CS
.92
.123
7.47
.000
6.783
1.16
CPV
.09
.03
3.056
.002
.032
.148
Expe
1.42
1.21
1.17
.24
-.96
3.60
Int_1
-.13
.068
-1.94
.153
-.266
.002
Int_2
.013
.0168
.755
.451
-.020
.046
Product terms key:
int_1 CS X expense
int_2 CPV X expense
The results above indicate that expense does not
weaken or strengthen the influence of customer
satisfaction on customer loyalty and customer
perceived value on customer loyalty. This is shown
by p-value above 0.05 on interaction 1 and 2. The
value of LLCI and ULCI through zero point for both
interactions. This indicates that hypothesis 5b and 6b
are rejected.
The results of hypothesis 5c and 6c tests are as
follows:
Table 6: The influence of CPV and CS on CL moderated
by education
Outcome: CL
Model Summary
R
R-
sq
MSE
F
df1
df2
p
.8446
.71
15.22
232.94
5.00
468
.000
Model
coeff
se
t
p
LLCI
ULCI
Constant
2.84
2.5
1.136
.257
-2.07
7.75
CS
.968
.146
6.612
.000
.680
1.255
CPV
.053
.036
1.472
.142
-.018
.124
educ
-.061
1.204
-.051
.959
-2.43
2.31
Int_1
-.155
.076
-2.04
.042
-.304
-.006
Int_2
.0344
.0189
1.825
.069
-.003
.072
Product terms key:
int_1 CS X education
int_2 CPV X education
The results of hypothesis 6c test indicate that on
interaction 1, education moderated the influence of
customer satisfaction on customer loyalty has shown
significant result, which means, education does
weaken or strengthen the influence. It is shown by p-
value below 0.05 and LLCI and ULCI do not go
through the zero point. For interaction 2, education
does not weaken or strengthen the influence of
customer perceived value on customer loyalty. This
is shown by p-value above 0.05 on interaction 1 and
2. The values of LLCI and ULCI go through zero
point.
In overall, the test for hypothesis 5 and 6 indicate
that in hypothesis 5a, 6a, 5b, 6b and 5c the
moderation variables do not weaken or strengthen
the influence of customer perceived value on loyalty
through the mediation of customer satisfaction. If
not using moderation, customer perceived value has
an influence on customer loyalty through customer
satisfaction. Therefore, the important variable here is
the mediator. Customer satisfaction is formed
because perceived value was positively responded
by customer which creates loyalty in using train
transportation. Age and expense are not important
here.
In contrast, hypothesis 6c indicates that
education does weaken or strengthen the influence
of customer satisfaction on customer loyalty.
Education weaken the influence of customer
satisfaction on customer loyalty with a coefficient of
-0.15. It means, the train service provider needs to
pay attention to customer satisfaction moderated by
education.
Education has a negative effect on the influence
of customer satisfaction on loyalty, which means a
highly educated person has a higher standard for
satisfaction, while a lower educated person is more
easily satisfied. Thus, it is more difficult to create
satisfaction for the highly educated customers and
hence harder to develop their loyalty. Dolarslan
(2014) also found that more educated customers are
SEABC 2018 - 4th Sriwijaya Economics, Accounting, and Business Conference
180

less likely to show loyalty behaviours. Moreover,
Mittal and Kamakura (2001) found that more
educated customers tend to be less loyal.
5 CONCLUSIONS
The results show that customer perceived value
have an impact on customer satisfaction and
customer loyalty. Customer perceived value have
both direct and indirect effects on loyalty. Customer
satisfaction also has an impact on loyalty. The
current research contributed to the findings that the
mediation of satisfaction amplifies the effect of
perceived value on loyalty (Dolarslan, 2014; Lam et
al., 2004; Eggert and Ulaga, 2002).
As for the relationship between customer
satisfaction and loyalty, the results show that one
moderation variable can significantly affect the
relationship, which is education. Education
negatively moderate the impact of customer
satisfaction on loyalty.
As for the managerial implications in the area of
public transportation, service provider needs to pay
attention on customer satisfaction, because it can
help develop loyalty. Highly educated customers are
harder to satisfy; thus service provider must observe
customers’ education to find out the customers who
are more likely to complain. Customers with high
education are more likely to complain, to this extent
service provider should provide better service to
increase their satisfaction, hence their loyalty.
Recent initiative by Indonesia Train Company to
offer priority class service (higher than executive) to
some routes is an excellent strategy as it can provide
higher satisfaction for the more affluent and
educated customers.
Efforts to increase customer perceived value can
increase customer loyalty. Service provider should
increase performance, emotion and social values of
their services. For example, service provider can
increase their number of toilets provided and
maintain their cleanliness, and become a sponsor for
high-class sport and art events to increase their
performance and social values.
The object studied focus specifically on the
executive train to this extent the coverage is limited.
The variables studied focused on customer perceived
value, customer satisfaction and customer loyalty
with the mediation of age, expense and education.
Because the object is public transport, it is likely that
when the consumers want to use it, they may not
focus only on executive train. They may choose
other trains which are available. This may become
the reason why the moderators of age and expense
cannot reinforce customer perceived value, customer
satisfaction and customer loyalty. Future research
may introduce other moderators to the model.
REFERENCES
Anderson, E.W. and Sullivan, M.W.
(1993).TheAntecedents and Consequences ofCustomer
Satisfaction for Firms. MarketingScience. 12, 125-143.
Biro PusatStatistik (2018). The amount of train passengers
from 2008 to 2018.
https://www.bps.go.id/linkTableDinamis/view/id/815
[Accessed 4 Apr. 2018].
Blattberg, R.C., Getz, G., and Thomas, J.S. (2001).
Customer Equity: Building and Managing
Relationships as Valuable Assets. Harvard Business
Review Press, Boston, MA.
Bojanic, D.C. (1996). Consumer perceptions of price,
value and satisfaction in the hotel industry: an
exploratory study. Journal of Hospitality and Leisure
Marketing, 4(1), 5-22.
Bolton, R.N. and Drew, J.H. (1991). A longitudinal
analysis of the impact of servicechanges on customer
attitudes.Journal of Marketing, 55(1), 1-9.
Bolton, R.N.,& Lemon, K.N. (1999). A dynamic model of
customers’ usage of services:Usage as an antecedent
and consequence of satisfaction. Journal of
MarketingResearch, 36, 171–186.
Boksberger, P.E. andMelsen, L. (2011). Perceived value:
A critical examination of definitions,concepts and
measures for the service industry.Journal of Services
Marketing, 35 (3), 229-240.
Brown, T.J., Barry, T.E., Dacin, P.A. and Gunst, R.F.
(2005). Spreading the word: investigatingantecedents
of consumers’ positive word-of-mouth intentions and
behaviors in a retailingcontext.Journal of Academy of
Marketing Science, 33 (2), 123-138.
Dolarslan, E.S. (2014). Assessing the effects of
satisfaction and value on customer loyalty behaviors in
service environments: High-speed railway in Turkey
as a case study.Management Research Review, 37 (8),
706-727
Eggert, A.andUlaga, W. (2002). Customerperceivedvalue:
A substitute for satisfactionin business markets?
JournalofBusiness and Industrial Marketing,17(2/3),
107–118.
Fornell, C., Johnson, M.D., Anderson, E.W., Cha, J. and
Bryant, B.E. (1996). The American customer
satisfaction index: nature, purpose, and findings.
Journal of Marketing, 60(4), 7-18.
Gallarza, M. G., & Gil-Saura, I. (2006). Value dimensions,
perceived value, satisfaction and loyalty: An
investigation of university students’ travel behaviour.
Tourism Management, 27, 437-452.
Gallarza, M.G., Ruiz-Molina, M.E. and Gil-Saura, I.
(2016). Stretching the value-satisfaction loyalty chain
Analysis of Customer Perceived Value, Satisfaction, Loyalty and the Moderating Role of Customer Demographics: A Study of Indonesian
Train Service
181

by adding value dimensions and cognitive and
affective satisfactions: A causal model for retailing.
Management Decision, 54 (4), 981-1003
Hayes, Andrew F. (2013). Introduction Mediation,
Moderation, and Conditional Process Analysis: A
Regression-Based Approach.
www.Guilford.com/MSS. New York, NY: The
GuilfordmPress.
Heskett, J.L., Sasser, W.E. Jr. and Hart, C.W.L.
(1990).Service Breakthroughs: Changing theRules of
the Game.New York, NY: The Free Press.
Jacoby, J.W., and Chestnut, R.W. (1978).Brand Loyalty
Measurement and Management. New York,NY:
Wiley.
Jones, M. A., Reynolds, K. E., Arnold, M. J., Gabler, C.
B., Gillison, S. T., andLanders, V. M. (2015).
Exploring consumers’ attitude towards
relationshipmarketing. Journal of Services Marketing,
29(3),188-199.
Kumar,V., Pozza, I.D. and Ganesh, J.(2013). Revisiting
the Satisfaction-Loyalty Relationship: Empirical
Generalizations and Directions for Future Research.
Journal of Retailing. 89 (March), 246-262.
Lam, S.Y., Shankar, V., Erramilli, M.K. and Murthy, B.
(2004). Customer Value, Satisfaction, Loyalty, and
Switching Costs: An Illustration from Business to
Business Service Context. Journal of the Academy of
Marketing Science, 32 (3), 293-311
Lim, Y.S., Heng, P.C., Ng, T.H. andCheah, C.S. (2016).
Customers’ online website satisfaction in online
apparel purchase: A study of Generation Y in
Malaysia. Asia Pacific Management Review, 21, 74 –
78.
Lin, C.H., Sher, P.J. and Shih, H.Y. (2005). Past progress
and future directions in conceptualizingcustomer
perceived value.International Journal of Service
Industry Management, 16(4), 318-336.
McDougall, G.H.G. and Levesque, T. (2000). Customer
satisfaction with services: Putting perceivedvalue into
the equation. Journal of Services Marketing, 14(5),
392 – 410.
Mittal, V. and Kamakura, W.A. (2001). Satisfaction,
repurchase intent, and repurchase
behavior:Investigating the moderating effect of
customer characteristics.Journal of
MarketingResearch, 38 (1), 131-142.
OECD (2013). Policy roundtable: Recent developments in
rail transportation services.Competition Law and
Policy
OECD.http://www.oecd.org/daf/competition/Rail-
transportation-Services-2013.pdf[Accessed 9
Apr.2018].
Oliver, R.L. (1999). Whence consumer loyalty.Journal of
Marketing, 63 (4), 33-44.
Oliver, R.L. (1992). An investigation of theattribute basis
of emotion and related affectsin consumption:
suggestions for astage-specific satisfaction
framework.Advancesin Consumer Research, 19, 237-
44.
O’Malley, L. O., and Prothero, A. (2004). Beyond the
frills of relationship marketing.
Journal of Business Research, 57(11), 1286-1294.
Patterson, P.G., andSpreng, R.A. (1997).Modelling the
relationship between perceivedvalue, satisfaction and
repurchaseintentions in a Business-to-
Business,services context: An empiricalexamination.
The International Journalof Service Industry
Management, 8(5),415– 432.
Qayyum, A., Khang, D.B. andKrairit, D. (2013). An
analysis of the antecedents of loyalty and
themoderating role of customer demographics in an
emerging mobile phone industry.International Journal
of Emerging Markets, 8 (4), 373-391.
Rahman, M.S., Hussain, B., Uddin, A.N.M.M. and Islam,
N. (2015). Exploring residents’ satisfaction of
facilities provided by private apartment companies.
Asia Pacific Management Review, 20, 130-140.
Ruiz-Molina, M.E. and Gil-Saura, I. (2008). Perceived
value, customerattitude and loyalty in retailing.
Journal of Retail & Leisure Property,7(4), 305–314.
Sheth, J., Newman, B. and Gross, B. (1991).Consumption
Values and Market Choices, Theory
andApplications.Cincinnati, OH: South-Western
Publishing Co.
Sirdeshmukh,D., Singh, J.,& Sabol, B. (2002). Consumer
trust, value, and loyaltyin relational exchanges.
Journal of Marketing, 66, 15–37.
Strandvik, T., andLiljander, V. (1994). Acomparison of
episode performance andrelationship performance for
a discreteservice, in Klienaltenkamp, M.
(Ed.),DienstleistungsmarketingKonzaptionenundAnde
wendungen. Berlin: GablerEditionWissenschaft.
Sweeney, J.C., Soutar, G.N. andJohnson, L.W. (1999).
The role of perceived risk in thequality-value
relationship: a study in a retail environment.Journal of
Retailing, 75 (1), 77-105
Sweeney, J.C. andSoutar, G.N. (2001). Consumer
perceived value: The development of a multiple
itemscale.Journal of Retailing, 77 (2), 203-220.
Vargo, S.L. and Lusch, R.F. (2004). Evolving to a
dominant logic for marketing.Journal ofMarketing, 68
(1), 1-17.
Wang, M.Y., Li, W.C., Chou, M.J. and Huang, C.J.
(2014). Nostalgia, perceived value, satisfaction, and
loyalty of cruise travel.International Journal of
Organizational Innovation,6 (4), 184-191.
Wang, Y., Lo, H.P., Chi, R., and Yang, Y. (2004). An
integrated framework for customer value and
customer-relationship-management performance: A
customer-based perspective from China. Managing
Service Quality, 14(2/3), 169-182.
Webster, F. E. (1992). The changing role of marketing in
the corporation. Journalof Marketing, 56, 1-17.
Yang, Y., Liu, X., Jing, F and Li, J. (2014). How does
perceived value affect travellers’ satisfaction and
loyalty?SocialBehavior and Personality, 42(10), 1733-
1744
SEABC 2018 - 4th Sriwijaya Economics, Accounting, and Business Conference
182

Yang, Z. and Paterson, R.T. (2004).Customer perceived
value, satisfaction, and loyalty: The role of switching
costs.Psychology & Marketing, 21(10), 799–822
Zeithaml, V. (1988). Consumer perceptionsof price,
quality and value: A means-end model and synthesis
of evidence.Journal of Marketing, 52, 2-22.
APPENDIX
Measurement scale items:
Item
Description
Perceived
value:
PV1
PV2
PV3
PV4
PV5
PV6
PV7
PV8
PV9
PV10
PV11
PV12
PV13
PV14
PV15
Executive class train service of KAI Ltd.
has consistent quality
Executive class train service of KAI Ltd.
has acceptable quality standards
Employees of KAI Ltd. executive train
show consistent performance
Executive class train service of KAI Ltd.
is well coordinated
I enjoy using the executive class train of
KAI Ltd.
Using an executive class train of KAI Ltd.
makes me feel good
Using an executive class train of KAI Ltd.
gives me a feeling of pleasure
Using an executive class train PT. KAI
made me feel relaxed
Executive class train of KAI Ltd. is
reasonably prices
Services provided by executive class train
of KAI Ltd. is good for the price charged
Executive train KAI offers value for
money
Using an executive class train of KAI Ltd.
would make me feel more accepted by
others
Using an executive class train of KAI Ltd.
would increase people's perception of me
Using an executive class train of KAI Ltd.
would make a good impression on others
Using an executive class train of KAI Ltd.
would give me social recognition
Customer
Satisfaction
CS1
CS2
CS3
My choice to use the executive class train
of KAI Ltd. is a wise one
I did the right thing when choosing the
executive class train of KAI Ltd.
Services provided by executive class of
KAI Ltd. suits my needs
Customer
Loyalty
CL1
I want to continue to use the executive
class train of KAI Ltd.
CL2
CL3
CL4
I said positive things about the executive
class train of KAI Ltd. to others
I would recommend the executive class
train of KAI Ltd. to the people asking for
my advice
I would encourage friends and family to
use the executive class train KAI Ltd.
Analysis of Customer Perceived Value, Satisfaction, Loyalty and the Moderating Role of Customer Demographics: A Study of Indonesian
Train Service
183
