
Financial Performance Changes in the Digital Economy
of Indonesian Retail Companies
Yuliani
1
, Husnah
2
, Ima Andriyani
3
1
Departement of Management, Universitas Sriwijaya, Palembang, Indonesia
2
Department of Management, Universitas Tadulako, Palu, Indonesia
3
Department of Management, Universitas Tridinanti, Palembang, Indonesia
Keywords: Digital Economy, Financial Performance, Retail Company
Abtract: Digital economy could cause the change of financial performance nowadays. The objective of this research
is to measure financial performance by comparing the performance before and after digital economy. This
study uses financial ratio to measure financial performance, such as, liquidity, activities, solvency and
profitability. The unit of analysis is retail firm with purposive sampling method of 15 firms and the study
period was 2013-2017. The data analysis method used nonparametric Wilcoxon signed rank test. The findings
show that activities ratio and profitability ratio are significantly after digital economy meanwhile liquidity
and solvency are found to be insignificant after digital economy. Therefore, financial performance is
decreasing after digital economy. This result imply that retail company in Indonesia have to change business
strategy, especially classic pattern sales to be based on digital technology.
1 INTRODUCTION
Digital economy has become a disruptive factor
that has swept the whole world and expanded in all
business sectors such as transportation, medical,
commerce, tourism, education, health and so on. The
digital economy topic discussed in all events in the
form of conferences, discussions and government
policies. The discussion is better known as disruption
revolution, namely from industry 1.0 to cyber-based
4.0 industry (Tandelilin, 2018). The term disruption
can be seen as a term that can be positive or negative
(Experd, 2017). Negative impression if it is
destructive and positive impression if it is an
innovation, fresh perspective, inspiration for creative
millennial times.
Digital economy is a situation where business
activities are dynamic and based on the internet.
According from (Carlsson, 2004) interprets that
digital economy is a dynamic new economy in which
business activity leads to high productivity with a
markedly high use of the internet and heterogeneous
forms of connection resulting in a very broad new
combination. According to (Ayres & Williams, 2004)
digital economics produces an innovation and adopts
Information and Communications Technologies
(ICTs). This innovation is related continuously on
many levels, namely basic science, engineering,
industry, system integration and new applications.
Previous research on digital economics related to
topics in financial management is still relatively
small. The disruptive era makes companies in
business activities will change strategies, especially
sales strategies. Many giant retail sector companies
were decided to close several outlets. For example, 7
Eleven officially closed all outlets at the end of June
2017 cause the company lost Rp.447.9 billion in the
first quarter of 2017, PT Matahari Department Store
closed two outlets in Pasaraya Blok M and Manggarai
at the end of September 2017, retail company Disc
Tarra Prior to close its outlets by the end of 2015,
Lotus retail stores closed outlets in October 2017 and
Debenhams retail store outlets in 2017 (Tandelilin,
2018). The transportation sector has sprung up GoJek,
Grab, Uber. The production sector with zero
inventory appears Alibaba, Bukalapak, Lazada,
Shopee. These new companies are established or
called start-up companies.
The results of research in the field of financial
management related to digital economy are the
emergence of digital finance and financial inclusion
in research conducted (Ozili, 2018). The results show
that digital finance through financial technology has
Yuliani, ., Husnah, . and Andriyani, I.
Financial Performance Changes in the Digital Economy of Indonesian Retail Companies.
DOI: 10.5220/0008436200050013
In Proceedings of the 4th Sriwijaya Economics, Accounting, and Business Conference (SEABC 2018), pages 5-13
ISBN: 978-989-758-387-2
Copyright
c
2019 by SCITEPRESS – Science and Technology Publications, Lda. All rights reserved
5

a positive impact on financial inclusion for
developing countries and developed countries
because digital economy provides individual comfort.
The field of marketing was carried out by researchers
(Lu & Chang, 2013) about consumer perceptions of
online retailers towards e-loyalty intention in 949
respondents indicating that the higher consumers of
online retailers, the more likely consumers are to
make online purchase.
The main objective of this research is to provide
empirical evidence about financial performance as
measured by financial ratios as a consequence of the
impact of the digital economy on retail companies on
the Indonesia Stock Exchange in 2013-2017. The
remaining of this paper is organized as follows.
Section 2 provides the literature on the variables used
for this study, where as section 3 describes the
methodology. The results would then be covered in
Section 4 and finally section 5 the result of this paper.
2 LITERATURE REVIEW
2.1 Liquidity Ratio
Liquidity is related to the company's ability to
repay short-term debt or long-term debt that is due
soon. Companies that do not experience problems in
paying off short-term debt are called liquid
companies. Conversely, companies that are not able
to pay off short-term debt or debt that is due soon are
called illiquid companies. The company's liquidity
measurement includes the current ratio, quick ratio,
cash ratio, net working capital to asset ratio and
measure interval (Ross et al., 2005).
The liquidity ratio in this study uses the current
ratio. Current ratio is the most often used as a
reflection of liquid or not a company. A Small
Current ratio reflects low short-term liquidity. A high
current ratio shows current assets, but has an
unfavorable influence on the profitability of the
company. Current assets generally result in lower
returns or profit levels than fixed assets so there is a
trade-off between risk and return in this condition
(Barclay & Smith, 1995; Hoshi et al., 1991). Current
ratio formula is:
2.2 Activities Ratio
Activities ratio are used to measure the ability of
companies to use their assets efficiently (Hanafi,
2016). This ratio reflects how much funds are
embedded in company assets. if the funds embedded
in certain assets were large enough, while the funds
should be able to be used to invest in other assets that
are more productive, the profitability of the company
should not be and should be. The activity ratio
consists of the average age of accounts receivable,
inventory turnover, fixed asset turnover and total
asset turnover (Hanafi, 2016).
This study measures the ratio of activity to two
ratios, namely inventory turnover (IT) and total asset
turnover (TATO). Inventory turnover measures how
much inventory will spin in a year. The greater the
inventory turnover, the more effective the company
will be in managing its inventory. Conversely, if the
greater the average number of inventory life, the
worse the company's performance will be because the
greater the funds embedded in inventory assets
(Dehning et al., 2007; Kaynak, 2003). The inventory
turnover formula is:
Total asset turnover shows the extent to which the
company's ability to generate sales is based on fixed
assets owned by the company. For companies with a
large proportion of total fixed assets, this ratio
becomes important to note (Hanafi, 2016). However,
for the service industry the fixed asset turnover ratio
is not so important to note. The ratio formula is:
2.3 Solvency Ratio
The solvency ratio measures the company's ability
to pay off its long-term obligations (Hanafi, 2016).
Companies that are able to pay off their long-term
liabilities are called solvable companies, which is
companies are categorized as insolvable if their long-
term liabilities are greater than the total assets owned.
The solvency ratio is more focused on the right side
of the company's balance sheet. Solvency ratio
consists of debt to total asset ratios, times interest
earned ratios and fixed charge coverage ratios
(Hanafi, 2005; Ross et al., 2005).
The ratio's used as a measurement of the solvency
ratio in this study are debt to asset ratio (DAR) and
debt to equity ratio (DER). DAR ratio by comparing
between total debt and total assets. Companies that
have a high DAR ratio mean that the company uses
high financial leverage (Utami, 2017). The proportion
of existing fixed assets should have the ability to pay
off existing debt. The DAR formula is:
SEABC 2018 - 4th Sriwijaya Economics, Accounting, and Business Conference
6

The ratio of the total debt ratio to the amount of
capital available shows the DER ratio. The use of
high debt will increase profitability, besides that high
debt will have an impact on risk (Barth & Miller,
2018; Utami, 2017). For certain conditions, the
company may have high debt, for example a booming
or normal macroeconomic condition, but if the
economic conditions of recession, the use of high debt
will also cause a high risk. If high sales companies
will not experience difficulties in paying installments
because the interest charged tends to be fixed. It is not
good if sales go down, the company's ability to pay
installments is slow. The DER ratio is used by the
formula:
2.4 Profitability Ratio
Profitability is used to measure a company's
ability to obtain profits at the level of sales, certain
assets and capital in a period (Hanafi, 2016). This
ratio can be interpreted as the company's ability to be
efficient for a certain period. The ratios contained in
profitability are profit margins, return on assets
(ROA), return on equity (ROE).
This study measures profitability with two ratios,
namely ROA and ROE. ROA measures the ability of
a company to generate net income based on certain
assets. According to (Muritala, 2012) that a high
ROA ratio reflects that companies in manage their
assets are getting better or called more efficient and
effective.
ROE measurement is used to determine the
company's ability to obtain profits from internal
funding sources. This measure is a measure of
profitability seen in the perspective of shareholders.
According to (Hanafi, 2016) this ratio does not take
into account dividends and capital gains for
shareholders, because this ratio does not include a
measure of the return received by the actual
shareholders. High ROE indicates that the level of
corporate profitability is high (Utami, 2017). The
ROE measurement formula is as follows:
3 RESEARCH METHODS
The population of the research are 23 companies
in the retail sector in the Indonesia Stock Exchange
(IDX). The research period is 2013-2017. The
selection of the period was based on 2015 that used
as the basic year of the digital economy phenomenon.
A purposive technique in selecting samples with
several criteria, namely 1) Retail companies that have
not been delisted during the 2013-2017 period; 2)
Retail companies that have financial information
December 31, 2013 up to a minimum of September
2017, this is due to the lack of retail companies that
have published complete financial reports until
December 31, 2017. Based on the selected criteria,
there are 15 retail companies as research samples. The
source of research data is the financial statements of
retail companies so that the data used is secondary
data.
Measurement of financial performance of this
study uses four ratios, namely liquidity, activity,
solvency and profitability. Data analysis techniques
descriptively that is to determine the mean by adding
up the calculation results of the ratio and divided by
the number of years of research and calculating the
difference between the average after and the average
before. The research hypothesis was inferentially
tested using a non-parametric Wilcoxon signed-rank
test method.
4 RESULT
The change of financial ratios based on the
average value between after and before is explained
in detail as follows: Changes in the development of
liquidity ratios are measured by the current ratio
(CR), namely the comparison between current assets
and current debt for the period of two years before
and two years after the digital economy occurs is
shown in Table 1. The average CR ratio development
in Table 1 is 66.67% the impact of digital economy
does not occur in the decline of CR. Based on Table
1, the impact after the digital economy for retail
companies as a whole still shows an improvement in
the liquidity ratio, which is proxy by CR, although
there are some companies that experienced a sharp
decline.
Financial Performance Changes in the Digital Economy of Indonesian Retail Companies
7
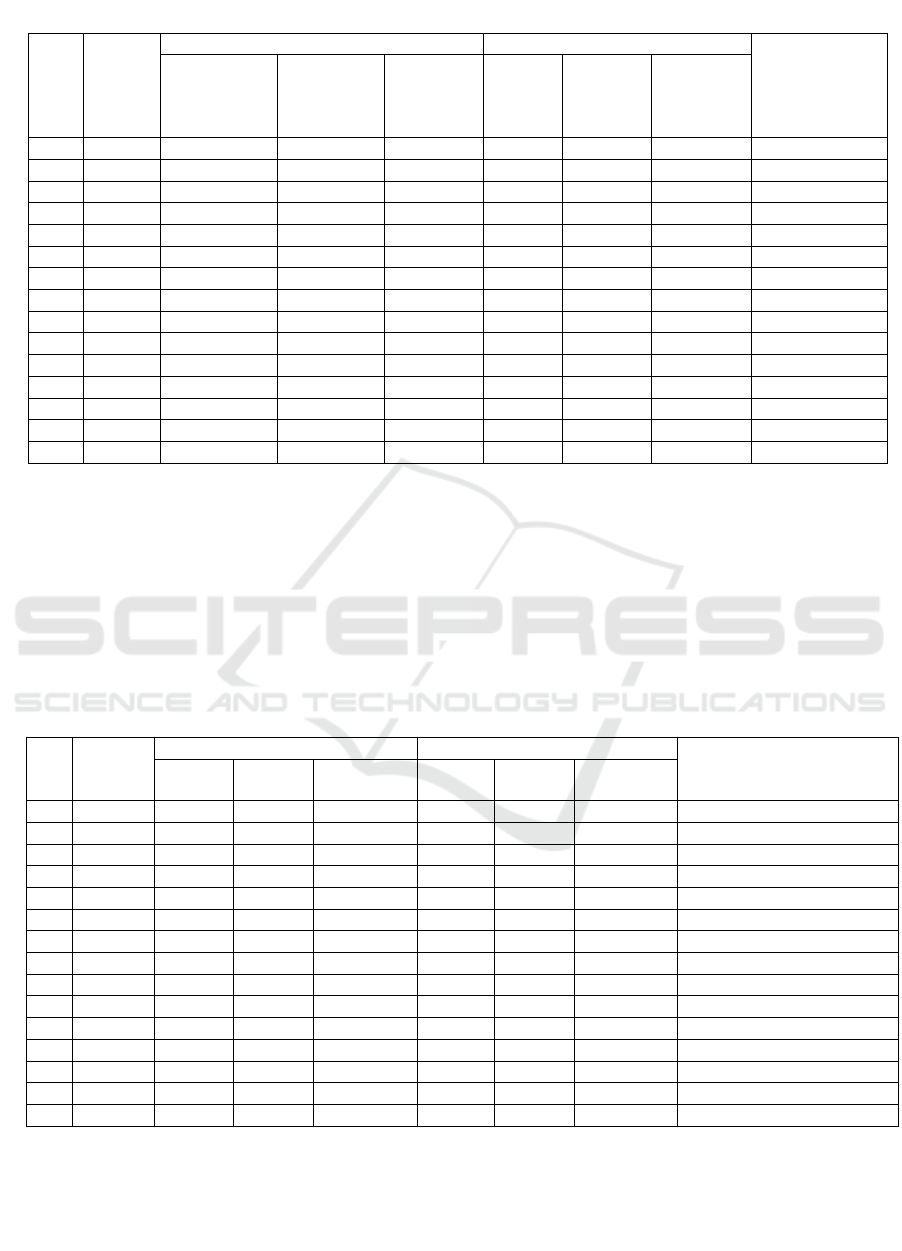
Table 1: Change of Current Ratio (%)
No
Code
Before
After
Average
difference
(after
deducting
before)
(t-2)
(t-1)
Average
(t+1)
(t+2)
Average
1
ACES
397,74
508,89
453,32
726,12
634,68
680,40
227,09
2
AMRT
82,07
91,46
86,77
89,60
88,34
88,97
2,21
3
CENT
162,66
53,57
108,12
143,82
165,81
154,82
46,72
4
CSAP
107,35
112,87
110,11
125,75
118,31
122,03
11,92
5
ERAA
171,84
148,22
160,03
131,33
147,62
139,48
(20,56)
6
GOLD
580,72
903,61
742,17
71,41
93,34
82,38
(659,79)
7
HERO
162,88
117,76
140,32
142,94
135,16
139,05
(1,27)
8
KOIN
133,85
121,21
127,53
116,03
114,24
115,14
(12,40)
9
LPPF
90,10
84,08
87,09
114,90
113,90
114,40
27,31
10
MAPI
111,74
134,36
123,05
158,23
153,52
155,88
32,83
11
MIDI
87,00
82,49
84,75
76,62
64,74
70,68
(14,07)
12
RALS
246,49
278,53
262,51
280,56
362,81
321,69
59,18
13
RANC
159,37
131,30
145,34
159,39
173,83
166,61
21,28
14
RIMO
173,00
127,00
150,00
119,00
339,47
229,24
79,24
15
TELE
140,33
180,11
160,22
598,91
170,80
384,86
224,64
Source: Processed from financial statement, 2013-2017
The activity ratio proxy by Inventory Turnover
(IT) is shown in Table 2. IT ratios reflect the
effectiveness of the company's operating activities
related to inventory management. This ratio
measurement is comparing the cost of goods sold and
ending inventory. The higher this ratio reflects the
more effective inventory turnover means that the
company is efficient in controlling inventory.
Efficiency reflects that the company does not need to
incur additional costs such as maintenance costs. As
many as 67% of retail companies experienced a
decline in IT after the digital economy occurred in
2013-2017. This condition reflects that the impact of
digital economy is able to reduce the IT performance
of retail companies after two years of digital
economy.
Table 2: Change of Inventory Turnover (x)
No
Code
Before
After
Average difference
(after deducting before)
(t-2)
(t-1)
Average
(t+1)
(t+2)
Average
1
ACES
1,15
1,13
1,14
1,63
1,19
1,41
0,27
2
AMRT
1,61
1,35
1,48
7,47
5,64
6,56
5,08
3
CENT
0,63
0,78
0,71
4,53
15,11
9,82
9,12
4
CSAP
0,06
0,55
0,31
4,07
3,30
3,69
3,38
5
ERAA
6,28
6,58
6,43
8,51
5,54
7,03
0,60
6
GOLD
7,77
8,99
8,38
3,33
2,39
2,86
(5,52)
7
HERO
4,95
4,29
4,62
5,15
3,73
4,44
(0,18)
8
KOIN
11,76
7,57
9,67
4,79
3,96
4,38
(5,29)
9
LPPF
0,81
0,84
0,83
0,76
0,69
0,73
(0,10)
10
MAPI
1,66
1,98
1,82
0,68
0,54
0,61
(1,21)
11
MIDI
1,81
1,54
1,68
1,48
1,14
1,31
(0,37)
12
RALS
4,43
4,72
4,58
0,79
0,60
0,70
(3,88)
13
RANC
4,21
6,61
5,41
2,16
1,65
1,91
(3,51)
14
RIMO
14,25
10,90
12,58
0,04
0,14
0,09
(12,49)
15
TELE
14,90
14,52
14,71
3,31
2,19
2,66
(12,05)
Source: Processed from financial statement, 2013-2017
Activity ratio can be measured by Total Asset
Turnover (TATO). TATO compares the net sales
value to total assets in a certain period. The higher the
TATO reflects the better retail companies in
managing assets, resulting in high net sales. Table 3
shows the average development of TATO before and
after the digital economy occurs. The impact after two
SEABC 2018 - 4th Sriwijaya Economics, Accounting, and Business Conference
8
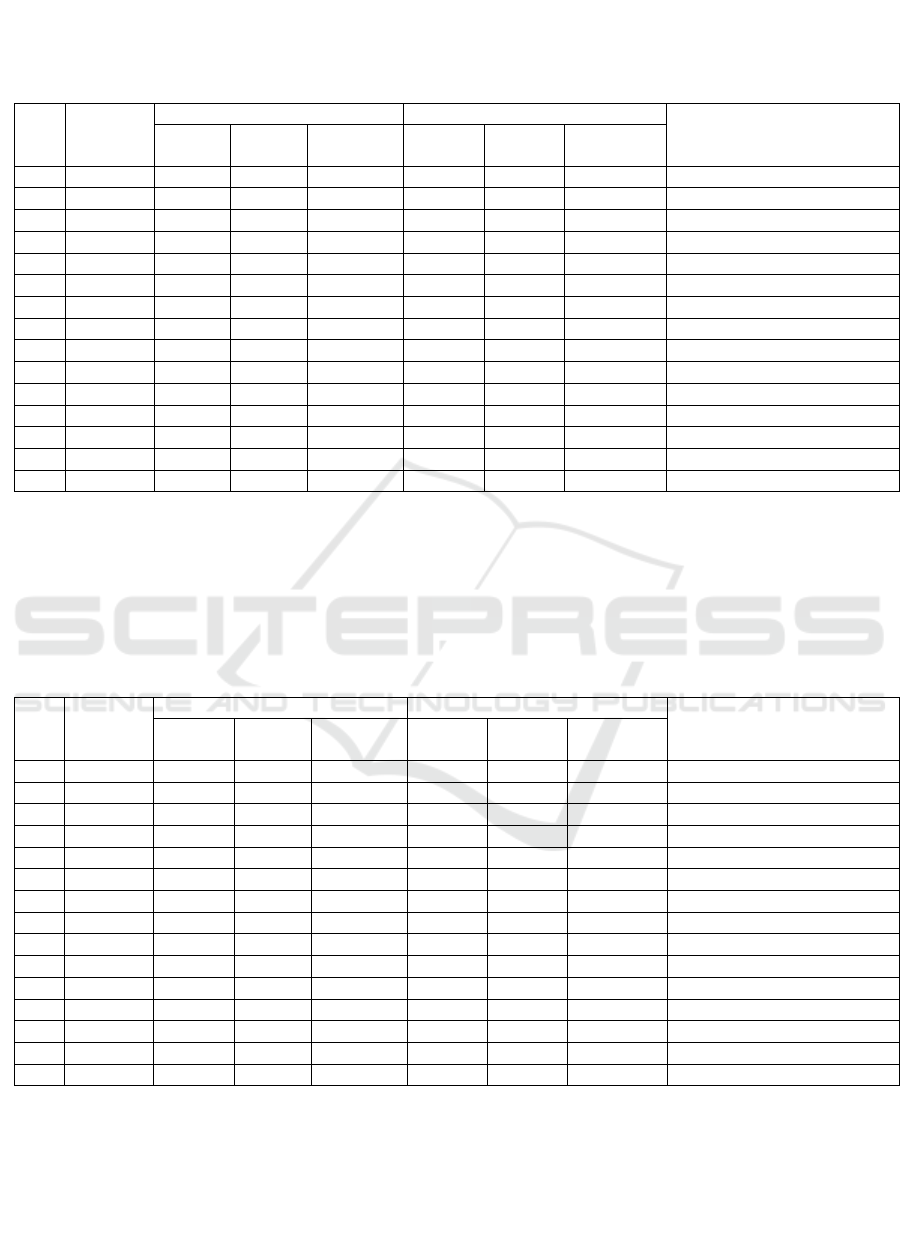
years of digital economy showed retail companies
experienced a decline in TATO.
Table 3: Change of Total Asset Turnover (x)
No
Code
Before
After
Average difference
(after deducting before)
(t-2)
(t-1)
Average
(t+1)
(t+2)
Average
1
ACES
1,57
1,54
1,56
0,69
1,03
0,86
(0,70)
2
AMRT
3,18
2,97
3,08
2,88
2,12
2,50
(0,58)
3
CENT
0,04
0,08
0,06
0,11
0,12
0,12
0,06
4
CSAP
2,07
2,12
2,10
1,57
1,20
1,30
(0,71)
5
ERAA
2,55
2,36
2,46
2,53
2,09
2,31
(0,15)
6
GOLD
0,51
0,48
0,50
0,06
0,12
0,09
(0,41)
7
HERO
1,53
1,54
1,54
1,83
1,28
1,58
0,02
8
KOIN
3,30
2,25
2,78
2,05
1,59
1,82
(0,96)
9
LPPF
2,30
2,32
2,31
2,04
1,85
1,05
(0,37)
10
MAPI
1,25
1,36
1,31
1,32
1,05
1,19
(0,12)
11
MIDI
2,36
2,31
2,34
1,99
1,51
1,75
(0,59)
12
RALS
1,37
1,28
1,33
1,26
0,98
1,12
(0,21)
13
RANC
1,83
2,10
1,97
1,86
2,19
2,53
0,56
14
RIMO
0,06
0,02
0,04
0,00
0,04
0,02
(0,02)
15
TELE
3,03
2,91
2,97
3,32
2,32
2,82
(0,15)
Source: Processed from financial statement, 2013-2017
Table 4.Shows Debt to Asset Ratio (DAR) for
retail companies in the study sample. It appears that
all retail companies fund total assets sourced from
debt. The higher the DAR reflects the greater
corporate debt which in turn can lead to the
company's dependence on external funds. The impact
of the development after the digital economy occurs
for retail companies is quite diverse based on the
average difference in DAR.
Table 4: Change of Debt to Asset Ratio (%)
No
Code
Before
After
Average difference
(after deducting before)
(t-2)
(t-1)
Average
(t+1)
(t+2)
Average
1
ACES
0,23
0,20
0,22
0,18
0,20
0,19
(0,03)
2
AMRT
0,76
0,79
0,78
0,73
0,76
0,75
(0,03)
3
CENT
0,12
0,26
0,19
0,21
0,26
0,24
0,05
4
CSAP
0,77
0,75
0,76
0,67
0,70
0,69
(0,08)
5
ERAA
0,45
0,51
0,48
0,54
0,51
0,53
0,05
6
GOLD
0,20
0,15
0,18
0,44
0,49
0,47
0,29
7
HERO
0,31
0,34
0,33
0,27
0,29
0,28
(0,05)
8
KOIN
0,74
0,78
0,76
0,83
0,85
0,84
0,08
9
LPPF
1,27
0,95
1,11
0,62
0,57
0,60
(0,52)
10
MAPI
0,69
0,70
0,70
0,70
0,62
0,66
(0,04)
11
MIDI
0,76
0,76
0,76
0,79
0,81
0,80
0,04
12
RALS
0,27
0,26
0,27
0,28
0,23
0,26
(0,01)
13
RANC
0,44
0,48
0,46
0,40
0,39
0,40
(0,06)
14
RIMO
11,84
9,55
10,70
2,96
0,11
1,54
(9,16)
15
TELE
0,60
0,50
0,55
0,61
0,61
0,61
0,06
Source: Processed from financial statement, 2013-2017
The solvency ratio with the Debt to Equity Ratio
(DER) proxy shows a comparison between debt and
total capital. The higher the DER shows the fewer
internal funding sources from shareholders' own
capital. Table 5 shows the development of DER
before and after the digital economy occurs. The
impact after digital economy has occurred, almost all
companies in funding reduce external funding means
that they are more likely to use additional capital from
internal, namely their own capital from retained
earnings and shareholders.
Financial Performance Changes in the Digital Economy of Indonesian Retail Companies
9

Table 5: Change of Debt to Equity Ratio (%)
No
Code
Before
After
Average difference
(after deducting
before)
(t-2)
(t-1)
Average
(t+1)
(t+2)
Average
1
ACES
0,29
0,25
0,27
0,22
0,25
0,24
(0,04)
2
AMRT
3,21
3,65
3,43
2,68
3,16
2,92
(0,51)
3
CENT
0,14
0,35
0,25
0,20
0,27
0,24
(0,01)
4
CSAP
3,34
3,04
3,19
2,00
2,29
2,15
(1,05)
5
ERAA
0,82
1,03
0,93
1,18
1,02
1,10
0,18
6
GOLD
0,24
0,18
0,21
0,79
0,95
0,87
0,66
7
HERO
0,45
0,52
0,49
0,37
0,41
0,39
(0,10)
8
KOIN
2,83
3,60
3,22
4,84
5,69
5,27
2,05
9
LPPF
(4,76)
18,19
6,72
1,62
1,33
1,48
(5,24)
10
MAPI
2,22
2,33
2,28
2,33
1,65
1,99
(0,29)
11
MIDI
3,21
5,37
4,29
3,76
4,38
4,07
(0,22)
12
RALS
0,36
0,36
0,36
0,39
0,30
0,35
(0,02)
13
RANC
0,79
0,92
0,86
0,67
0,64
0,66
(0,20)
14
RIMO
(1,09)
(1,12)
(1,11)
(1,51)
0,13
(0,69)
0,42
15
TELE
1,49
1,01
1,25
1,56
1,59
1,58
0,33
Source: Processed from financial statement, 2013-2017
Profitability ratios measure a company's ability to
earn profits in a given period. The ratio used as a
measure of asset effectiveness in generating net
income is the Return on Assets (ROA) approach. The
impact of digital economy after two years on average
shows the development of a decline of almost 99% of
retail companies in Indonesia. ROA decreases due to
changes in net income as a measure of the level of
success of the company's operational efficiency.
Referring to Table 6, it can be explained that the
digital economy impact causes a decrease in net
income decline of almost all retail companies in
Indonesia.
.
Table 6. Change of Return on Asset (%)
No
Code
Before
After
Average difference
(after deducting
before
(t-2)
(t-1)
Average
(t+1)
(t+2)
Average
1
ACES
20,29
18,62
19,46
18,93
12,82
15,88
(3,58)
2
AMRT
5,19
4,09
4,64
2,84
0,22
1,53
(3,11)
3
CENT
(3,77)
(4,71)
(4,24)
(2,27)
(1,92)
(2,10)
(2,15)
4
CSAP
2,44
3,47
2,96
1,76
1,36
1,56
(1,40)
5
ERAA
6,97
3,50
5,24
3,53
3,19
3,36
(1,88)
6
GOLD
6,84
3,17
5,01
(0,86)
0,17
(0,35)
(5,35)
7
HERO
8,65
0,53
4,59
1,61
0,90
1,26
(3,34)
8
KOIN
10,90
5,04
7,97
0,00
(1,53)
(0,77)
(8,74)
9
LPPF
39,16
41,64
40,40
41,57
35,14
38,36
(2,04)
10
MAPI
4,20
0,84
2,52
1,95
2,30
2,13
(0,40)
11
MIDI
3,19
5,37
4,28
4,60
0,95
2,78
1,51
12
RALS
8,92
7,80
8,36
8,79
8,15
8,47
(0,11)
13
RANC
4,67
1,21
2,94
5,48
3,63
4,56
(1,62)
14
RIMO
(111,74)
(68,10)
(89,92)
(9,06)
2,11
(3,48)
(86,45)
15
TELE
8,53
6,07
7,30
5,71
3,13
4,42
(2,88)
Source: Processed from financial statement, 2013-2017
Table 7 shows the development of Return On
Equity (ROE) of retail companies in Indonesia. ROE
measures the rate of return on capital in generating
net income. The higher ROE reflects the better
operational efficiency of the company. Negative ROE
reflects that the return on capital in operational
efficiency is not effective. It appears in Table 7 in the
two years before digital economy happens that almost
all companies have positive ROE as well as digital
economy, but if calculated with the average
SEABC 2018 - 4th Sriwijaya Economics, Accounting, and Business Conference
10
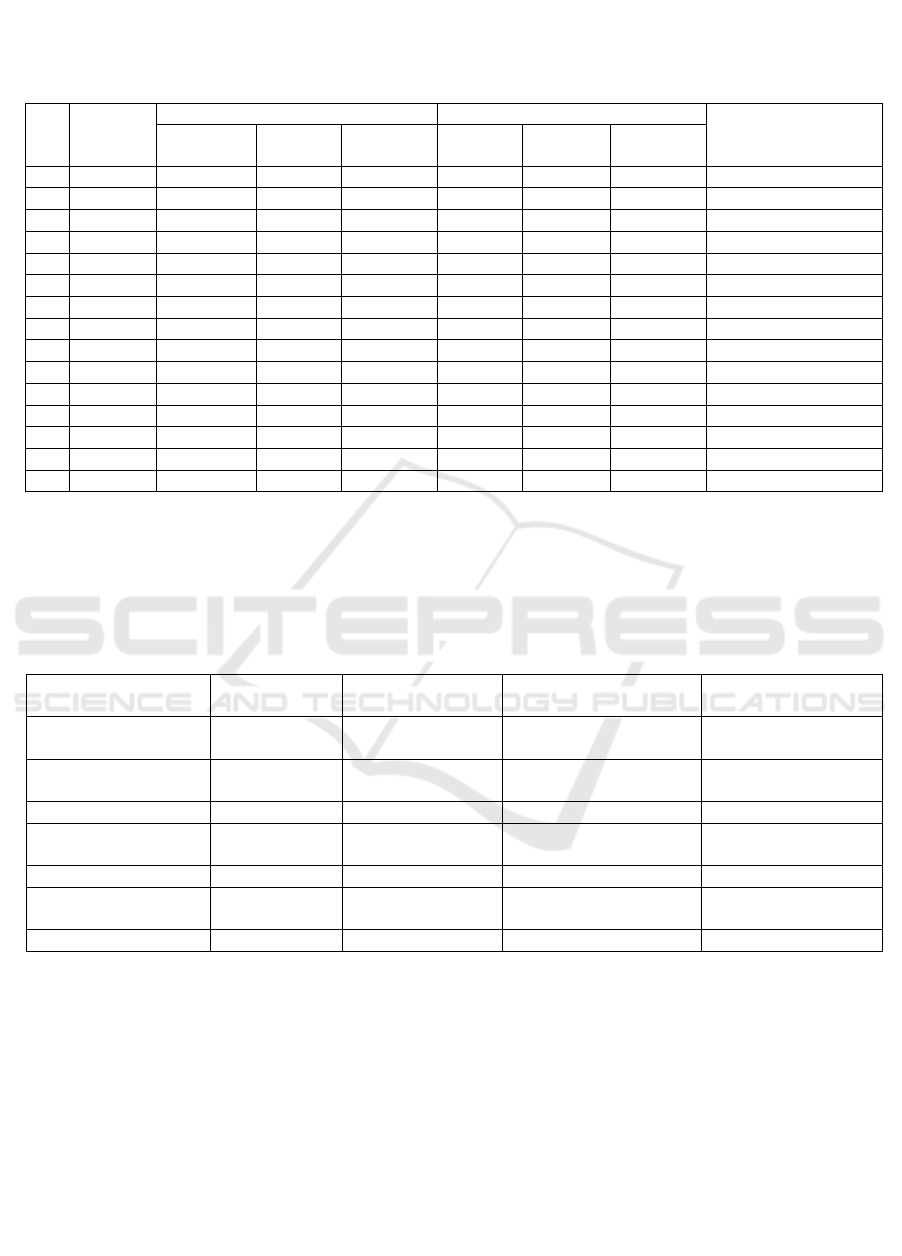
development of the difference, the ROE of retail
companies has d ecreased.
Table 7: Change of Return on Equity (%)
No
Code
Before
After
Average difference
(after deducting
before
(t-2)
(t-1)
Average
(t+1)
(t+2)
Average
1
ACES
26,26
23,24
24,75
23,16
15,99
19,58
(5,18)
2
AMRT
21,85
19,04
20,45
10,46
0,92
5,69
(14,76)
3
CENT
(4,29)
(6,34)
(5,32)
(2,87)
(2,59)
(2,73)
(2,59)
4
CSAP
10,58
14,01
12,30
5,29
4,49
4,89
(7,41)
5
ERAA
12,66
7,11
9,89
7,68
6,45
7,07
(2,82)
6
GOLD
8,51
3,73
6,12
(1,54)
0,33
(0,61)
(6,73)
7
HERO
12,53
0,80
6,67
2,21
1,28
1,75
(4,92)
8
KOIN
41,75
23,16
32,46
(0,01)
(10,25)
(5,13)
(37,59)
9
LPPF
-147,20
799,10
325,95
108,86
81,92
95,39
(230,56)
10
MAPI
13,50
2,81
8,16
6,51
6,10
6,31
(1,85)
11
MIDI
13,44
22,39
19,92
21,90
5,11
13,51
(6,41)
12
RALS
12,14
10,57
11,36
12,24
10,61
11,43
0,07
13
RANC
8,38
2,32
5,35
9,17
5,97
7,57
2,22
14
RIMO
10,30
7,96
9,13
4,63
2,38
3,51
(5,62)
15
TELE
21,27
12,19
16,73
14,63
8,10
11,37
(5,37)
Source: Processed from financial statement, 2013-2017
Based on Table 8 below it appears that the
financial performance of retail companies has four
significant variables as the impact of the digital
economy. The significant variable is the ratio of
activities proxy by IT and TATO. In addition,
profitability ratios show significant results which are
proxy by ROA and ROE.
Table 8: Hypothesis Testing Results
Variables
Before average
After average
Average difference
(before-after)
Statistical Test Z
Wilcoxon
Liquidity:
CR (%)
16,6
14,7
(1,9)
0,229
Activity:
IT (x)
49,6
32,1
(17,5)
0,082**
TATO (x)
17,6
14,0
(3,6)
0,001*
Solvency:
DAR (%)
12,2
59,1
46,9
0,420
DER (%)
17,8
15,1
(2,7)
0,948
Profitability:
ROA (%)
68,3
52,2
(16,1)
0,069**
ROE (%)
33,6
11,9
(21.7)
0,005*
Source: Processed from secondary data, 2018
Level of significant *5% **10%
5 DISCUSSIONS
The overall financial performance after digital
economy shows a decrease based on the average
difference between two years after and two years
before. The liquidity ratio is proxy by CR showing a
decline of 1.9%, which means that the ability of retail
companies to pay short-term liabilities tends to
decrease. However, if you pay attention to the
average before and after the impact of the digital
economy, there is no difficulty because it is still
above the normal limit of 2: 1. The change in CR after
the above before in the statistical findings is not
significant. This means that the impact of the two-
year digital economy of retail companies still has a
positive CR value.
The overall financial performance after digital
economy shows a difference between two years after
and two years before. The liquidity ratio is proxy by
CR showing a decline of 1.9%, which means that the
Financial Performance Changes in the Digital Economy of Indonesian Retail Companies
11

ability of retail companies to pay short term liabilities
tends to decrease. However, if you pay attention to
the average before and after impact of the digital
economy, there is no difficulty because it is still
above the normal limit of 2: 1. The change in CR after
the above before in the statistical findings is not
significant. It means that the impact of the two-year
digital economy of retail companies still has a
positive CR value.
The leverage ratio proxy by DAR and DER has a
different development. The DAR increase of 46.9%
as a result of digital economy indicates that retail
companies add a higher external funding source,
namely 46.9%. Table 8 shows that the average two
years before the DAR digital economy is 12.2%. The
impact of digital economy causes a high increase in
debt, namely 46,% to 59.1%. Based on the statistical
test Z Wilcoxon found results that statistically the
solvency ratio after the digital economy occurs is
insignificant. This means that the average value after
and before the digital economy does not give a real
influence that retail companies change funding
decisions. These findings are consistent with the
findings of the study (Widjajanti, 2010) that the
occurrence of privatization does not contribute
significantly to the leverage ratio. These findings not
consistent with (Kaniel & Parham, 2016) about
causality between media attention and consumer
investment behavior, independent of the conveyed
information.
The calculation of profitability ratios proxy by
ROA and ROE shows a change in decline. This
means that the impact of digital economy has
evidence empirical, retail companies experience a
decline in net income. The decrease in the average
difference is quite high on the ROE variable of
21.7%, which mean that the retail company's net
profit target is not achieved as a result the capital used
for sales activities is relatively ineffective in
generating an increase in net income. The Wilxocon
statistical test found significant results, meaning that
the change in the decrease in ROE after the digital
economy occurred was empirically proven. The
results has same as (Edeling & Himme, 2018) but
different from (Widjajanti, 2010) where results are
found to be insignificant as a result of privatization.
6 CONCLUSION, LIMITATION
AND SUGGESTION
The financial ratio that is significantly after the
digital economy occurs is the activity ratio and
profitability ratio. The activity ratio is proxy by
inventory turnover and total asset turnover while the
profitability ratio is proxy by return on assets and
return on equity. On average, all financial ratios have
decreased performance. The decrease in the highest
average difference is return on equity and the lowest
current ratio. Profitability ratios that experience a
decline can be interpreted as a retail company
experiencing a decline in sales. This condition can be
seen that the level of inventory turnover is decreasing
is a reflection of the inventory that accumulates in the
warehouse is high enough so that the sales cycle has
decreased.
The topic of this study is very interesting and
relevance is in accordance with the real conditions
facing Indonesia today. The impact of industry 4.0 on
various business sectors not only in the trade sector
for retail companies but also disruptive all fields of
business such as transportation, medical, commerce,
tourism, education, health and so on. The conclusion
of this study only applies to retail companies, whereas
other business sectors allow changes in financial
performance. Further research is recommended to
conduct empirical testing for other business sectors so
that conclusions will be obtained more
comprehensively.
Another limitation of this study only examines the
impact of digital economics using variable financial
ratios such as liquidity, solvency, activity on
profitability so this finding only limited to the
company's fundamentals even though market
performance will be very important, especially for
investors. Subsequent research can add market ratio
variables so that it will complement this study and be
useful for investors in financial investment decision
making.
REFERENCES
Ayres, R. U., & Williams, E. (2004). The digital economy :
Where do we stand ? Technological Forecasting &
Social Change, 71, 315–339.
https://doi.org/10.1016/j.techfore.2003.11.001
Barclay, M. J., & Smith, C. W. (1995). The Maturity
Structure of Corporate Debt. The Journal of Finance,
L(2), 609–631.
Barth, A. J. R., & Miller, S. M. (2018). Benefits and Costs
of a Higher Bank “Leverage Ratio.” Journal of
Financial Stability.
https://doi.org/10.1016/j.jfs.2018.07.001
Carlsson, B. (2004). The Digital Economy : what is new
and what is not ? Structural Change and Economic
Dynamic, 15, 245–264.
https://doi.org/10.1016/j.strueco.2004.02.001
SEABC 2018 - 4th Sriwijaya Economics, Accounting, and Business Conference
12

Dehning, B., Richardson, V. J., & Zmud, R. W. (2007). The
Financial Performance Effects of IT-based Supply
Chain Management Systems in Manufacturing Firms.
Journal of Operation Management, 25, 806–824.
https://doi.org/10.1016/j.jom.2006.09.001
Edeling, A., & Himme, A. (2018). When Does Market
Share Matter? New Empirical Generalizations from a
Meta-Analysis of the Market Share-Performance
Relationship. Journal of Marketing, 82(3), 1–24.
Experd, C. (2017). Be Desruptive. Kompas.
Hanafi, M. (2016). Manajemen Keuangan (2nd ed.).
Yogyakarta: BPFE.
Hoshi, T., Kashyap, A., & Scharfstein, D. (1991).
Corporate Structure, Liquidity, and Investment:
Evidence from Japanese Industrial Groups. The
Quarterly Journal of Economics, 106(1), 33–60.
https://doi.org/https://doi.org/10.2307/2937905
Kaniel, R., & Parham, R. (2016). The Impact of Media
Attention on Consumer and Mutual Fund Investment
Decisions. Journal of Financial Economics, 123(2),
337–356. https://doi.org/10.1016/j.jfineco.2016.11.003
Kaynak, H. (2003). The Relationship Between Total
Quality Management Practices and their Effects on
Firm Performance. Journal of Operations
Management, 21, 405–435.
https://doi.org/10.1016/S0272-6963(03)00004-4
Lu, L., & Chang, H. (2013). Online Shoppers ’ Perceptions
of E-retailers ’ Ethics , Cultural Orientation , and
Loyalty An exploratory study in Taiwan. Internet
Research, 23(1), 47–68.
https://doi.org/10.1108/10662241311295773
Muritala, T. A. (2012). An Empirical Analysis of Capital
Structure on Firms ’ Performance in Nigeria.
International Journal of Advances in Management and
Economics, 1(5), 116–124.
Ozili, P. K. (2018). Impact of Digital Finance on Financial
Inclusion and Stability. Borsa Istanbul Review, xx, 1–
12. https://doi.org/10.1016/j.bir.2017.12.003
Ross, S. A., Westerfield, R. W., & Jaffe, J. (2005).
Corporate Finance (7th ed). New York: McGraw-Hill.
Tandelilin, E. (2018). Bagaimana Pendidikan Bisnis
Menyiapkan Mahasiswa untuk Bersaing di Era
Disruptif? Annualy APPMI.
Utami, W. B. (2017). Analysis of Current Ratio Changes
Effect , Asset Ratio Debt , Total Asset Turnover ,
Return On Asset , And Price Earning Ratio In
Predictinggrowth Income By Considering Corporate
Size In The Company Joined In Lq45 Index Year 2013
-2016. International Journal of Economics, Business
and Accounting Researcah (IJEBAR), 1(1), 25–37.
Widjajanti, K. (2010). Perubahan Kinerja Keuangan
Privatisasi BUMN. Jurnal Keuangan Dan Perbankan,
14(Edisi Khusus Oktober 2010), 621–632.
Financial Performance Changes in the Digital Economy of Indonesian Retail Companies
13
