
The Study on Physical and Chemical Water Quality Parameters at
Pasir Putih, Situbondo
Anita Diah Pahlewi
Marine Engineering, Agricultural Department, 68312 Universitas Abdurachman Saleh Situbondo, Indonesia
Keywords: Water Quality, Pasir Putih Situbondo, Temperature, Turbidity, pH, DO.
Abstract: Indonesian coastal and marine biodiversity has important role for both economical and developmental state
aspects. This field offer environmental services such as marine tourism. Considering its coastal area
potentials, Situbondo develops their marine tourism, such as Pasir Putih Beach. The present of white sand
beach and coral reef ecosystems in Pasir Putih attract tourist and researcher intention to explore. Water
quality is very influential on the biodiversity of aquatic biota, coral reef ecosystem indeed. Therefore, study
on the physical and chemical parameters of water quality needed as monitoring effort of the Pasir Putih’s
water quality. Data of temperature, turbidity, pH, and DO, TSS and salinity compared to the standards of
water quality under The Decree of the Minister of Environment No.51/2004. Result of turbidity,
temperature, pH, and DO parameters show that they are in safe criteria, but TSS and salinity parameters
ranges are exceed the water quality standards under The Decree of the Minister of Environment
No.51/2004.
1 INTRODUCTION
Indonesia marine and coastal biodiversity is present
in the form of coral reef ecosystems, mangroves, sea
grass beds, estuaries, beaches, open sea, and deep
seas (Dahuri, 2003). This marine and coastal
biodiversity has high economic natural resources
potential. Furthermore, this area are able to offer
environmental services for public developmental
purposes. The scope of marine and coastal
environmental services are education and research
aspects, defence and security aspects, climate
control, marine tourism, maritime transportation and
communications, source of energy, conservation and
preservation, and also living-system supports
(Dahuri, 2003). Tourism as one of environmental
services gives obvious contributing for both local
and national economic development. It is contribute
to the country’s foreign exchange and increase local
income.
Situbondo’s coastline is 131.575 km along
(Sukandar, 2016) and marine tourism become its
main tourism. One of its marine tourism is Pasir
Putih beach that located in Bungatan sub-district.
This beach is accessible and passed by Pantura road.
Pasir Putih beach offers beauty of its white sand and
underwater sceneries to the tourist. They can
swimming, canoeing, snorkelling, or diving. The
diversity of its marine biota such as coral reefs,
nektons, and benthic species attract both tourists and
researchers to explore this area. The local
government’s efforts to promote and conserve Pasir
Putih environment are organizing the national water
sport, diving and culture event placed in Pasir Putih
Beach, publishing Situbondo’s Regent Regulation
No.19/2012 about Pasir Putih Coral Reef
Conservation (Peraturan Bupati Situbondo, 2012),
and building and renewing the infrastructures.
Seeing the potentials, it is possible for increasing the
developments of Pasir Putih underwater tourism in
future years.
The condition of Pasir Putih marine biota can not be
separated with its water quality. Water as substance
that surrounding marine biota and medium for
chemical reaction occurs, both inside and outside of
organism body (Nybakken, 1988). The optimum
development and growth of marine biota reach if
waters environment in balance ecosystem condition.
The presence of disturbing factors cause the break of
one or more food chain in its web food (Wibisono,
2011). The waters physical-chemical parameters
influence the living of marine biota around.
Biodiversity that exists in an ecosystem is reflection
Pahlewi, A.
The Study on Physical and Chemical Water Quality Parameters at Pasir Putih, Situbondo.
DOI: 10.5220/0008374800770081
In Proceedings of the 6th International Seminar on Ocean and Coastal Engineering, Environmental and Natural Disaster Management (ISOCEEN 2018), pages 77-81
ISBN: 978-989-758-455-8
Copyright
c
2020 by SCITEPRESS – Science and Technology Publications, Lda. All rights reserved
77
of its physical-chemical parameters characteristics
(Dahuri, 2003). The study of physical and chemical
water quality is necessary for water quality indicator
and comparison data on environmental monitoring
assessment (Tatangindatu, et.al, 2013). Therefore,
the research on physical and chemical parameters at
Pasir Putih waters needs to be carried out as
monitoring of water quality that is closely related to
the condition of its marine biota.
2 MATERIAL AND METHODS
2.1 Study Area
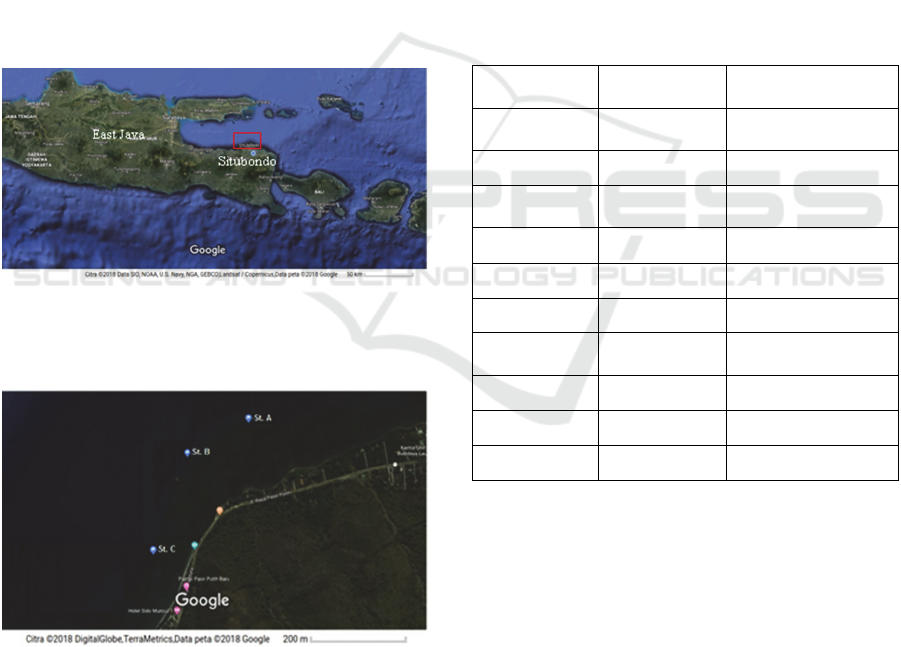
Pasir Putih beach located at Pasir Putih village,
Bungatan subdistrict, Situbondo regency, East Java.
It is about 25 km from the downtown area. The
beach is passed by Pantura road and make it
accessible. Fig. 1 shown the location of the study
area.
Figure 1: Study Area.
2.2 Sampling and Data Analysis
Figure 2: Sampling Location.
The measurement of water quality data have been
conducted for three stations (see Fig. 2). The
coordinate point each sampling’s site are A site (S
7°41’4.8” E 113°49’56.1”), B site (S 7°41’10.8” E
113°49’45”), C site (S 7°41’27.7” E 113°49’38.8”).
Sampling of water quality takes 2 kind of depth, (1)
0.5 m under water surface and (2) 0.5 m above the
sea bed. Van Dorn Sampler horizontal type is used
for collect sea water sample.
The sampling of turbidity, temperature, DO, pH
parameters using in-situ methods. Meanwhile, TSS
and salinity parameters deriving from laboratory
analysis. Sampling of seawater sample for laboratory
analysis packed in dark bottle and should be storage
at cooler box. The sample should not more than 24 h
picked up to the laboratory for maintaining its
stability and quality.
Kinds of water quality parameters, sampling
methods, and methods specification shown in Table
1. The available data are analyzed descriptively
using graphics and tables then compared with the
water quality standard under The Decree of the
Minister of Environment No.51/2004.
Table 1: Parameters, sampling methods and methods
specification.
Parameters
Sampling
Methods
Methods Specification
Sampling’s
coordinate
Insitu GPS
Depth Insitu Gauge stone
Physical
Parameters
Turbidity Insitu Turbidimeter
Temperature Insitu Digital Termometer
TSS Laboratory SNI 06-6989.3 - 2004
Chemical
Parameters
Salinity Laboratory Refractometer
pH Insitu pH meter
DO Insitu DO meter
3 RESULT AND DISCUSSION
Since the publishing of Situbondo’s Regent
Regulation No.19/2012, Pasir Putih has already
became not only marine tourism but also coral reef’s
conservation area. The water environmental
condition as limiting factor influence the living of
marine biota around. The physical and chemical
water quality monitoring at Pasir Putih waters was
conducting on October 2018 at dry season in ebb
condition. At dry season, the minimum input of
freshwater can minimize the effect of rain diluting
ISOCEEN 2018 - 6th International Seminar on Ocean and Coastal Engineering, Environmental and Natural Disaster Management
78
the salts in the ocean. The water depth each
sampling site shown in Table 2.
Table 2: Water Depth (Ebb Condition).
Location Coordinate Depth
Station A S 7°41’4.8” E 113°49’56.1” 4 meter
Station B S 7°41’10.8” E 113°49’45” 5.5 meter
Station C S 7°41’27.7” E 113°49’38.8” 5 meter
Comparison between physical-chemical
parameters measurement data and water quality
standard for marine biota and marine tourism under
Ministerial Decree of Environment Number 51/2004
given at Table 3.
Table 3: Comparison of measurement data and
Government’s Quality Standard.
Parameters
Water
quality
standard
(biota)
Water
quality
(tourism)
Unit
The results
Station A Station B Station C
A1 A2 B1 B2 C1 C2
Physical Parameters
Turbidity < 5 < 5 NTU 0.85 1.78 0.31 2.82 0.41 6.41
Temperature 28 – 30 Natural °C 30.1 29.1 29.2 28.9 29.3 29.3
TSS 20 20 mg/l 26 27 27 29 21 27
Chemical Parameters
Salinity 33 – 34 Natural ‰ 35.1 35.1 35.2 35.3 34.8 35.3
pH 7 – 8.5 7 – 8.5 - 8.08 7.64 7.66 7.89 7.69 7.85
DO > 5 > 5 mg/l 11.13 7.74 8.9 8.11 8.14 7.88
3.1 Physical Parameters
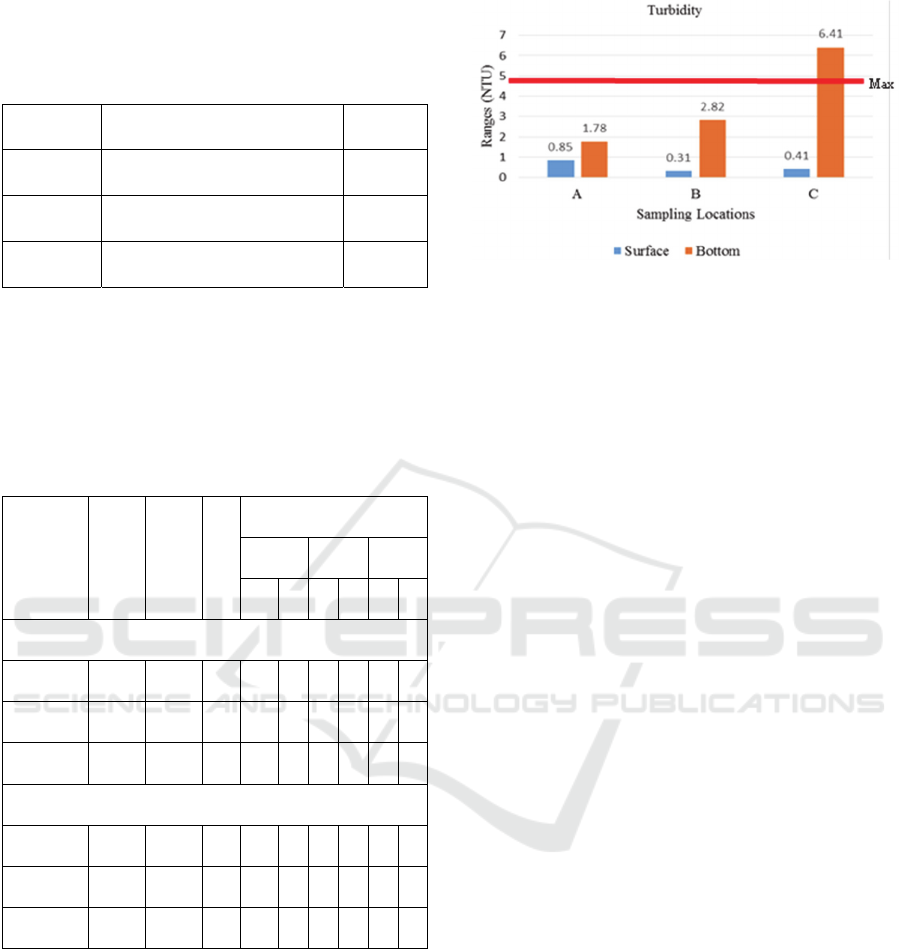
3.1.1 Turbidity
The turbidity measurement data (Fig. 3) at three
sampling sites taken from surface (0.5 m under
water surface) and bottom (0.5 m above the seabed).
The turbidity value at 3 sampling site are within safe
criteria, for marine biota and marine tourism.
Figure 3: Turbidity measurement data.
The standard quality of turbidity range for marine
biota and marine tourism under The Decree of the
Minister of Environment No.51/2004 is less than 5
NTU (red line as maximal standard quality criteria).
The turbidity mean range at Station A is 1.315
NTU, not exceed the standard quality. At Station B,
mean range of turbidity is 1.56 NTU are also not
exceed the quality standard. Mean range of turbidity
at Station C is 3.41 NTU. Seeing its mean range,
turbidity is still in safe condition, because it is not
exceed the quality standard. At Station C, the range
in bottom site exceed the water quality standard.
Turbidity caused by dissolved suspended organic or
anorganic particles in water body which make it
turbid (Wibawa and Luthfi, 2017). The high range of
turbidity bottom side at station C probably caused by
substrate stirred by marine organism such as nekton
or by water current in sampling moment.
3.1.2 Temperature
The mean temperature at all sampling station are
within normal condition because it is not exceed the
maximal range of water quality standard for marine
biota and marine tourism. The mean temperature in
Station A is 29.6 °C, Station B is 29.5 °C, and
Station C is 29.3 °C. The surface water as first
receptor of direct sunlight accept more heat than the
underwater layer. The consequent is temperature at
surface always higher than other underwater
columns. This is illustrate at Fig. 4, which the
surface temperature in the sampling station higher
than bottom temperature. The temperature at the
surface and bottom site is not much different,
because the water depth consider as shallow water,
so it cannot form temperature stratification.
Temperature Station A at surface part is 30.1 °C,
little higher than maximal range of water quality
standard, 30°C. The increase of this temperature is
temporary as effect from boat machine heat through
the line occasionally. Water temperature parameter
The Study on Physical and Chemical Water Quality Parameters at Pasir Putih, Situbondo
79
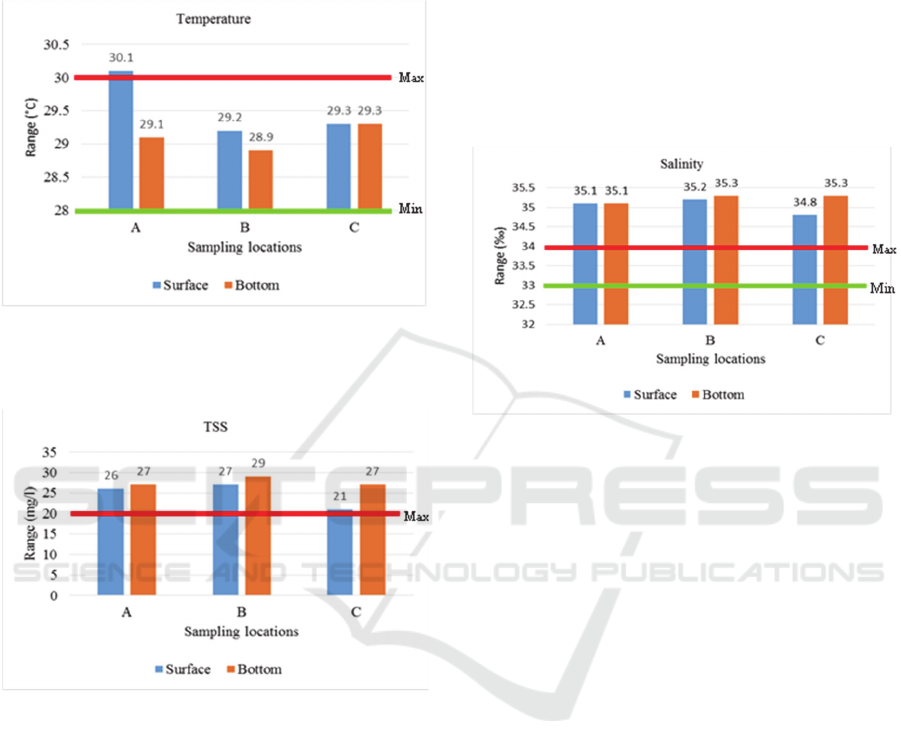
should be considered since the increasing of water
surface temperature caused coral bleaching and
present coral diseases (Wibawa and Luthfi, 2017).
The illustration of water temperature condition in
Pasir Putih beach shown in Fig. 4.
Figure 4: Temperature measurement data.
3.1.3 TSS (Total Suspended Solids)
Figure 5: TSS measurement data.
Fig. 5 shows the range of TSS in all sampling
stations exceed water quality standard allowed. The
mean TSS range at A station is 26.5 mg/l. The mean
range of TSS at B station is 28 mg/l. The mean
range of TSS at station C is 24 mg/l. TSS is
suspended materials (diameter > 1µm) which
detained on milipore filter with pore diameter 0.45
µm. TSS consist of mud and fine sand and
microorganism, as the result of land erosion flush to
the water body (Effendi, 2013). The monitoring of
TSS used for knowing the water quality, because
highly TSS range indicate the high risk pollution and
inhibit the sun light penetration to water body
(Maulana, et.al, 2015). Generally, the content of
suspended solid affects the level of water turbidity
and temperature (Edward, 2003). Despite of its high
TSS value, it is not driven the turbidity and
temperature exceed the water quality standard yet.
Highly TSS range at sampling station probably
caused by highly nutrient content due to floating net
cages near sampling location. Further research
needed to investigate the impact of floating net
cages to the water quality at Pasir Putih waters.
3.2 Chemical Parameters
3.2.1 Salinity
Figure 6: Salinity measurement data.
Fig. 6 shows the range of salinity in the surface is
not much differ from salinity range in bottom site.
This is indicate that overall there are homogeneous
salinity distribution at each depth. Mean range of
salinity at Station A is 35.1 ‰, station B is 35.25 ‰,
station C is 35.05 ‰. The salinity range exceed
water quality standard allowed for marine biota. The
range salinity for the marine tourism water quality
standard is natural, depend on normal condition and
varied at time (noon, night, season). Salinity range in
this area is still appropriate to the marine water
salinity range, 30 – 40 ‰ (Effendi, 2013).
The present salinity range are differ from research
data in 2013, which Pasir Putih water salinity range
30 - 31 ‰ (Aunurohim, 2013). The present salinity
range close to the salinity range of the floating net
cage research in 2017 (Anrosana, 2017). This
probably caused by the fact that salinity is measured
under laboratory process, not insitu measurement.
On the real condition, salinity is influenced by
several factors such as evaporation, rainfall, current
circulation pattern, fresh water flush and
anthropogenic activities (Nontji, 1987). The
sampling stations are also located near ponds.
ISOCEEN 2018 - 6th International Seminar on Ocean and Coastal Engineering, Environmental and Natural Disaster Management
80
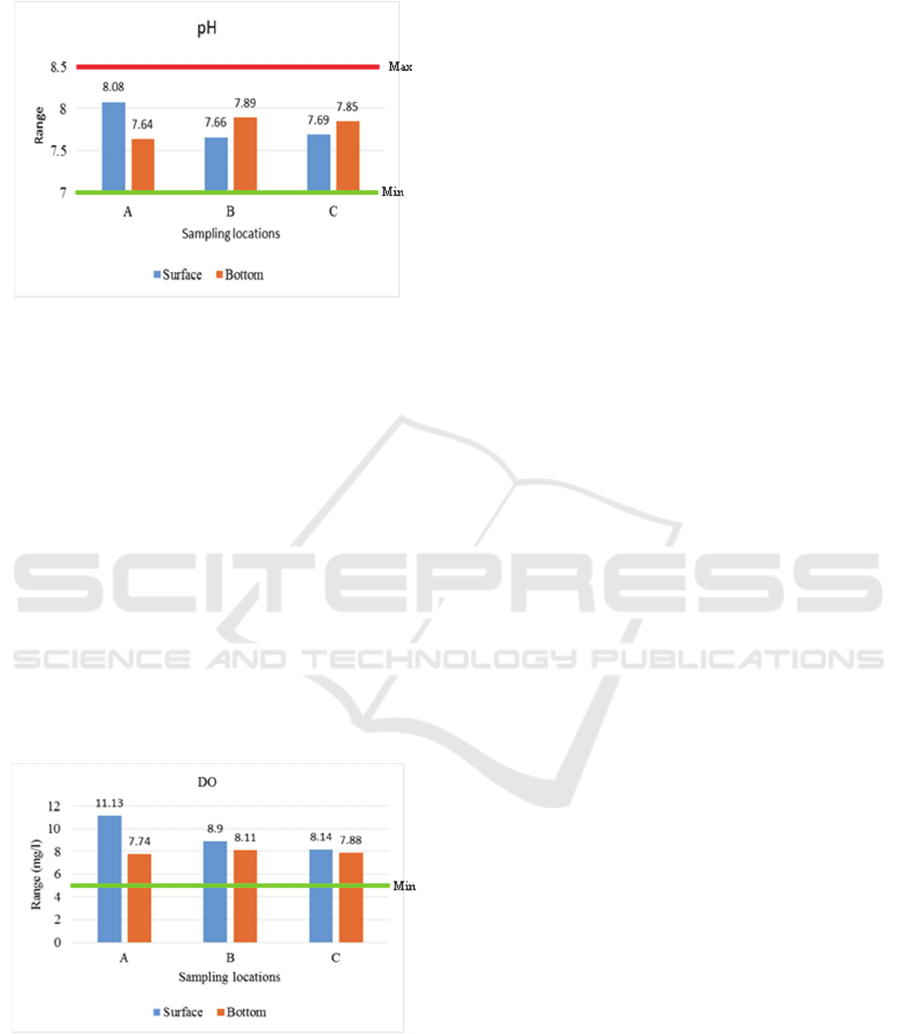
3.2.2 PH
Figure 7: PH measurement data.
According to water standard quality for marine biota
and marine tourism, the range salinity of pH is 7 –
8.5. Mean pH range at Station A, B, C are 7.86,
7.78, and 7.77. Fig. 7 show that pH range at three
sampling sites appropriate with the government’s
water standard quality for marine biota and marine
tourism. The pH content is hydrogen ion
concentration unit in solution, usually for defining
acidity or base of solution (Wibawa and Luthfi,
2017). Change in pH affect the marine biota
chemical and biological process. The pH affect the
toxicity of water chemical compound. The pH’s
range is very influential for water biochemical
process as nitrification will end in lower pH range
(Tarsim and Wardiyanto, 2004).
3.2.3 DO
Figure 8: DO measurement data.
Fig. 8 shows the measurement of DO’s range. The
range of DO quality standard for marine biota and
marine tourism is more than 5 mg/l. The mean range
of DO at Station A, B, C are 9.44 mg/l, 8.51 mg/l,
and 8.01 mg/l. The three mean range more than 5
mg/l, which show that DO range is within safe
criteria, not exceed the range of water quality
standard under The Decree of the Minister of
Environment No.51/2004. Dissolved oxygen are
needed for respiration process of living organism.
The lower DO content at bottom-side show the
presence of respiration process by coral or other
marine biota (Wibawa and Luthfi, 2017).
4 SUMMARY
The condition of physical and chemical parameters
include turbidity, temperature, pH, DO are still
within water quality standard allowed. TSS and
salinity parameters are exceed the water quality
standard allowed. It is needed the further research
about highly range of TSS content in Pasir Putih
water and salinity measurement should be done on
location.
REFERENCES
A. Nontji, 1987. Laut Nusantara, Djambatan, Jakarta.
F. Tatangindatu, O. Kalesaran, R. Rompas, 2013. Bud.
Perairan e-J., 1.
H. Effendi, 2013. Telaah Kualitas Air, Kanisius,
Yogyakarta.
I.A. Anrosana P, 2017. A.A. Gemaputri, J. Il. Inov, 17.
I.B. Subagio, Aunurohim, 2013. J. Sains dan Seni
POMITS, 2.
I.G.N. A. Wibawa, O.M. Luthfi, 2017. J. Segara, 13, 23-
35.
J.W. Nybakken, 1988. Marine Biology: An Ecological
Approach, Gramedia, Jakarta.
L. Maulana, A. Suprayogi, A.P. Wijaya, 2015. J. Geodesi
Undip, 4, 139-148.
M.S. Taringan, Edward, 2003. J. Makara Sains, 3, 109-
119.
M.S. Wibisono, 2011. Pengantar Ilmu Kelautan, UI Press,
Jakarta.
Peraturan Bupati Situbondo Nomor 19 Tahun 2012.
R. Dahuri, 2003. Keanekaragaman Hayati Laut: Aset
Pembangunan Berkelanjutan Indonesia, Gramedia
Pustaka Utama, Jakarta.
Sukandar et al, 2016. Profil Desa Pesisir Provinsi Jawa
Timur, Diskanla Jatim, Surabaya.
Suntoyo, H. Ikhwani, M. Zikra, N.A. Sukmasari,
G.Angtaeni, H. Tanaka, M. Umeda, S. Kure, 2015.
Procedia Earth and Planetary Science, 14.
Tarsim and Wardiyanto, 2004. J. Lap. Penelit. UNILA.
The Study on Physical and Chemical Water Quality Parameters at Pasir Putih, Situbondo
81
