
Accuracy Assessment of the Geospatial Information Agency’s Tidal
Prediction
Khomsin and Danar G. Pratomo
Geomatics Engineering Department, Faculty of Civil Engineering, Environment, and Geo-Engineering,
Institut Teknologi Sepuluh Nopember, Surabaya, Indonesia
Keywords: Accuracy Assessment, BIG, Tide Prediction, Tide Observation.
Abstract: Bathymetric survey requires tide data to reduce sounding data to the preferability vertical datum. A tidal
observation is performed in the vicinity of the survey area to achieve the tide correction for the depth
measurement. In order to obtain vertical references, it is necessary to conduct a direct tide observation for at
least 15 days period. An in-situ tidal observation takes high operating cost and needs a lot of effort to install
a tide gauge in the survey area. Thus, to reduce the time and the cost for tide observation, tidal prediction data
can be used as an alternative solution. This research attempted to perform the accuracy assessment of the tidal
prediction model from Geospatial Information Agency (BIG). There are 128 tidal stations from BIG which
spread across Indonesia archipelago. These stations provide real time tide observation. Based on the data, BIG
established a tidal prediction model for Indonesia waters. The research examined the BIG tide model with
direct tidal observation data from two locations (Ambon and Cilacap). The results show the accuracy of tidal
prediction from BIG is 0.085m for Ambon and 0.385m for Cilacap. The residual of MSL, HHWL, and LLWL
between tidal prediction and in-situ data in Ambon are -0.022m, -0.063m and +0.020m, and in Cilacap are -
0.147m, -0.122m, and -0.173m, respectively.
1 INTRODUCTION
A hydrographic surveyor has to be able to associate
all measured depths with respect to a vertical datum,
regardless of the water surface variation along the
time of sounding. A water level datum can be a ‘tidal
datum’ when defined in terms of a certain phase of
tide. The datum to which depths on a chart are
referred is known as the chart datum (IHO, 2005). In
Indonesian coastal waters, Mean Sea Level (MSL) is
used for topographic map and Lowest Low Water
Level (LLWL) is used for hydrographic map
(Republik Indonesia, 2011) are computed from
tabulation of the observations of the tide, in this case
the average of the tidal waters everyday over a 19 year
period.
The tide plays an important role both in the land
and sea surveying. In Indonesian’s Constituent No. 4
2011 about Geospatial Information Law, states that
(Republik Indonesia, 2011):
1) The Indonesian base map must consist of
coastline (Article 12),
2) The coastline is a adjoint line between the land
and the sea which is affected by the tides (Article
13, paragraph 1).
3) There are three types of coastlines: a Lowest Low
Water Level (LLWL) is used as nautical chart
reference, Mean Sea Level (MSL) is used as
topographic reference and the Highest High Water
Level (HHWL) (Article 13, paragraph 2).
Tides are the phenomenon of rising and falling of
sea surface caused by the attraction between earth and
celestial bodies such as the Moon and the Sun (IHO,
2005; Triatmojo, 1999; Parker, 2007). Although the
mass of the moon is smaller than the mass of the sun,
but because its distance to the earth is much closer,
the influence of the moon's attraction on the earth is
greater than the influence of the sun. Tidal generating
forces vary inversely as the cube of the distance from
the tide generating object. Gravitational attractive
forces only vary inversely to the square of the
distance between two objects (Thurman, 1994). The
attraction of the moon that affects the tides is 2.2
times greater than the sun attraction.
Khomsin, . and Pratomo, D.
Accuracy Assessment of the Geospatial Information Agency’s Tidal Prediction.
DOI: 10.5220/0008374600650070
In Proceedings of the 6th International Seminar on Ocean and Coastal Engineering, Environmental and Natural Disaster Management (ISOCEEN 2018), pages 65-70
ISBN: 978-989-758-455-8
Copyright
c
2020 by SCITEPRESS – Science and Technology Publications, Lda. All rights reserved
65
The observation of sea surface variation can be
applied in the following areas (IHO, 2005): a. water
level requirement planning; b. preliminary water level
zoning development; c. control water level station
operation; d. supplemental water level station
installation, operation, and removal; e. data quality
control, processing, and tabulation; f. datum
computation and datum recovery; g. generation of
water level reducers and the final tidal zoning. The
observation of the water level variation is also
essential for supporting hydrographic survey.
However, the development of a tidal station in fields,
either permanent or temporally, is unintelligible. The
complication of developing a tidal station depends on
the topography of the shore and the accessibility of
the survey area, especially if it is located in a remote
area.
The Geospatial Information Agency (BIG) is the
government institution that responsible for providing
geospatial data in Indonesia. One of the responsibility
of BIG is providing tidal data across the country with
an online tide prediction service (BIG, 2018). Yet,
this tide prediction is lack of information related to
the tide data (i.e.: the vertical reference of
downloaded data is unclear). Thus, the data cannot be
directly applied for determining vertical reference
and depth correction in hydrographic survey. This
study aims to examine the accuracy of tidal prediction
data downloaded from tides.big.go.id with in-situ
data in two locations of tidal observations.
Furthermore, the study also analyzed the feasibility of
this tidal prediction for depth correction during the
hydrographic survey.
2 DATA AND METHOD
2.1 Data and Research Area
The research used tidal prediction data downloaded
from tides.big.go.id/pasut. The data are adjusted to
the location and time of in-situ data measurement.
There are two in-situ tidal observation used in the
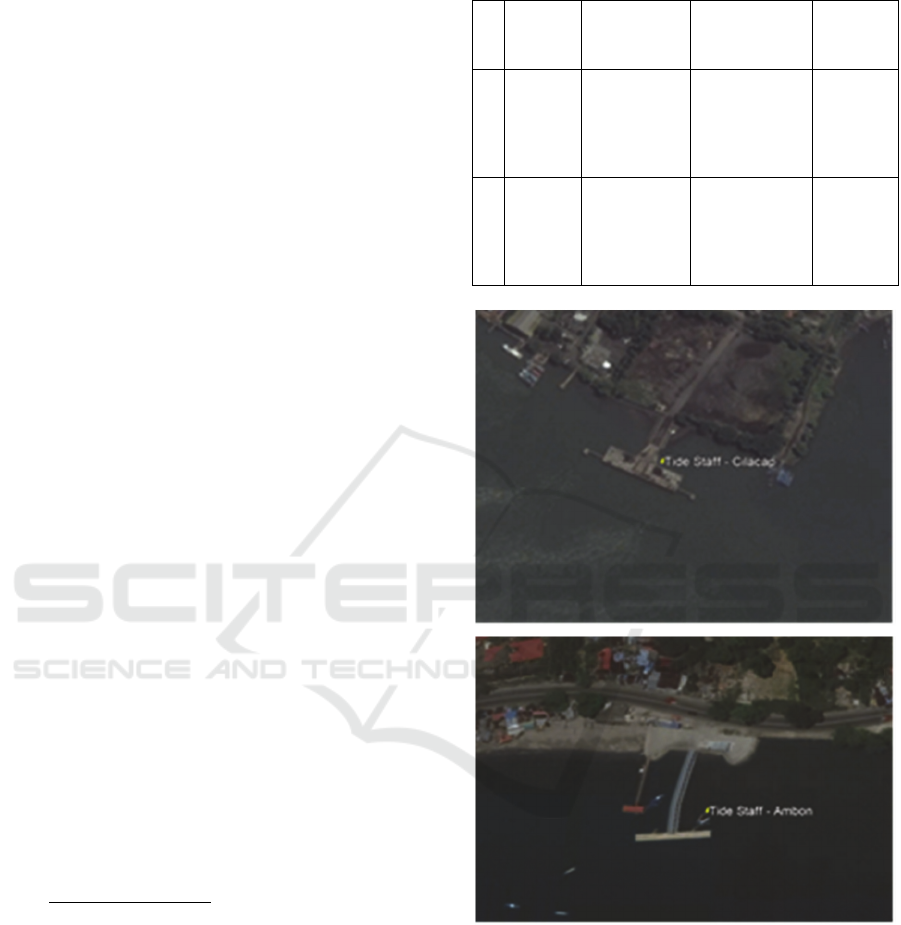
research: Cilacap and Ambon. The geographical
coordinates of these locations and the date when the
data were taken be seen in Table 1. The aerial image
of the in-situ stations is shown in Fig 1).
2.2 Method
The downloaded tidal prediction is in ASCII format
comprises geographical positions of the station, the
date and the time observation, and the water elevation
(Fig 2). The time is recorded in UTC (Universal Time
Coordinate). The time is converted to the local time,
Table 1: Geographical coordinates of the tidal staff.
No Location Latitude (S) Longitude (E) Date
1 Cilacap 7°44'37.34" 108°59'57.24"
12 July
–
26 July
2017
2 Ambon 3°39'42.34" 128°10'43.05”
14 August
–
28 August
2018
Figure 1: The location of the tidal staff in Cilacap (top) and
Ambon (bottom).
which is in Ambon is UTC + 9 (Eastern Indonesia
Time) and in Cilacap is UTC + 7 (Western Indonesia
Time). The tidal prediction and in-situ data, then,
were plotted overlaid each other to see the difference
between the tidal prediction and in-situ data. The
accuracy of the tidal prediction is represented by Root
Mean Square error (RMSe).
ISOCEEN 2018 - 6th International Seminar on Ocean and Coastal Engineering, Environmental and Natural Disaster Management
66
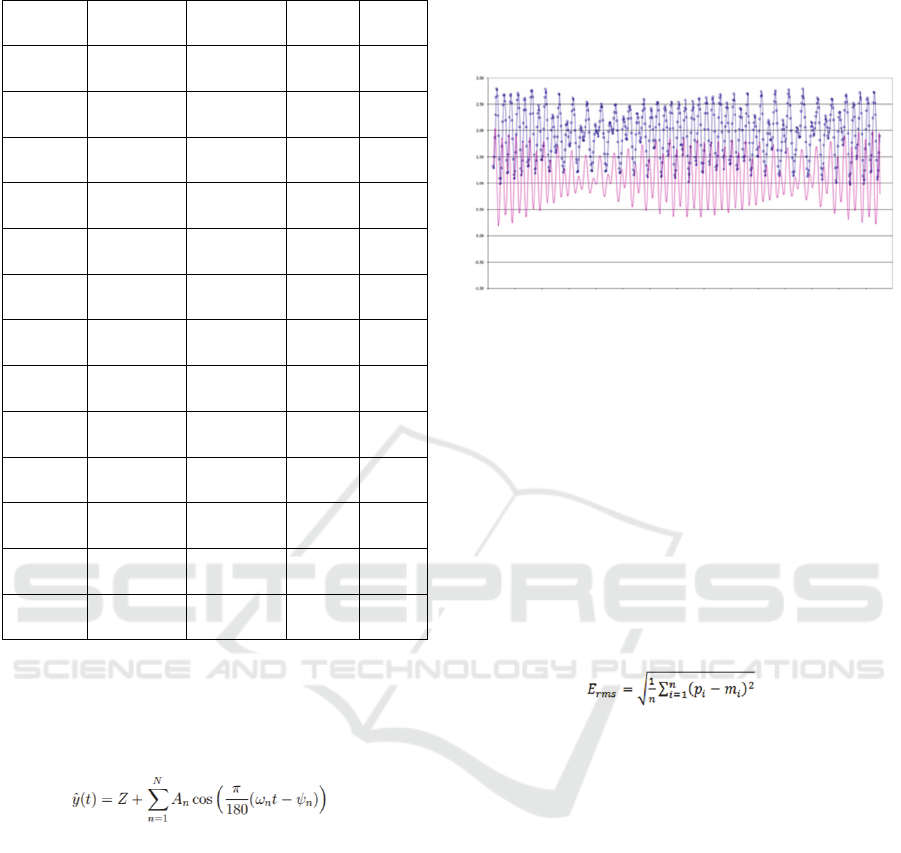
Table 2: Tidal prediction data in UTC.
Latitude Longitude Date Time Z (m)
-7.743 108,9992 8/14/2018 0:00:00 0,211
-7.743 108,9992 8/14/2018 1:00:00 0,601
-7.743 108,9992 8/14/2018 2:00:00 0,866
-7.743 108,9992 8/14/2018 3:00:00 0,936
-7.743 108,9992 8/14/2018 4:00:00 0,787
-7.743 108,9992 8/14/2018 5:00:00 0,452
-7.743 108,9992 8/14/2018 6:00:00 0,009
-7.743 108,9992 8/14/2018 7:00:00 -0,436
-7.743 108,9992 8/14/2018 8:00:00 -0,777
-7.743 108,9992 8/14/2018 9:00:00 -0,933
-7.743 108,9992 8/14/2018 10:00:00 -0,87
-7.743 108,9992 8/14/2018 11:00:00 -0,607
-7.743 108,9992 8/14/2018 12:00:00 -0,213
The tide analysis was performed using least
square estimation to predict the variation of the water
level over the time which is shown in the following
mathematical equation (Stephenson, 2016):
(1)
where:
y(t) = water level at time t
Z = Mean Sea Level
N = number of tide components, from n=1
to n=N
An = Amplitude of the average harmonic
components
ɷn = angular speed of tidal wave component.
t = time based on GMT.
ψn = Greenwich phase of tidal component n at t =
0 which varies before corrected.
Figure 2: shows the tide prediction and in-situ data
overlaid at the same time reference and the height of
the tide prediction is adjusted to the same reference of
the in-situ data.
Figure 2: The tide prediction (blue) and in-situ (blue) graph
use the same reference.
The difference between the tide prediction and in-
situ data is computed to get the accuracy. Here the
accuracy is represented by root mean square error.
RMSe is a frequently used measure of the difference
between values predicted by a model and the values
observed from the environment that is being
modelled. These individual differences are also called
residuals, and the RMSe serves to aggregate them into
a single measure of predictive power. The RMSe of a
model prediction with respect to the estimated
variable Xmodel is defined as the square root of the
mean squared error (FEMA, 2016):
(2)
where Erms is dimensional RMSe, pi is tidal
prediction data, mi is tidal in-situ observed values the
time i. In this case pi is the tidal heights of BIG tidal
prediction and mi is the tidal heights of in-situ
observation. The accuracy of the amplitude of tidal
constituents can also be computed by Eq. 2.
Vertical references that are often used in
topographic and hydrographic mapping are computed
from the amplitude of each tidal component that has
been determined by least square method based on Eq.
1. According to (Latief, et.al, 2018), highest high
water level and lowest low water level can be
determined by these equations:
𝐻𝐻𝑊𝐿 𝑍0 𝑀2𝑆2𝑃1𝐾2𝑂1𝐾1
(3)
𝐿𝐿𝑊𝐿 𝑍0 𝑀2𝑆2𝑃1𝐾2𝑂1𝐾1
(4)
Accuracy Assessment of the Geospatial Information Agency’s Tidal Prediction
67
3 RESULTS AND DISCUSSION
The analysis of the accuracy was performed at two
locations which will be explained more detail at the
following section.
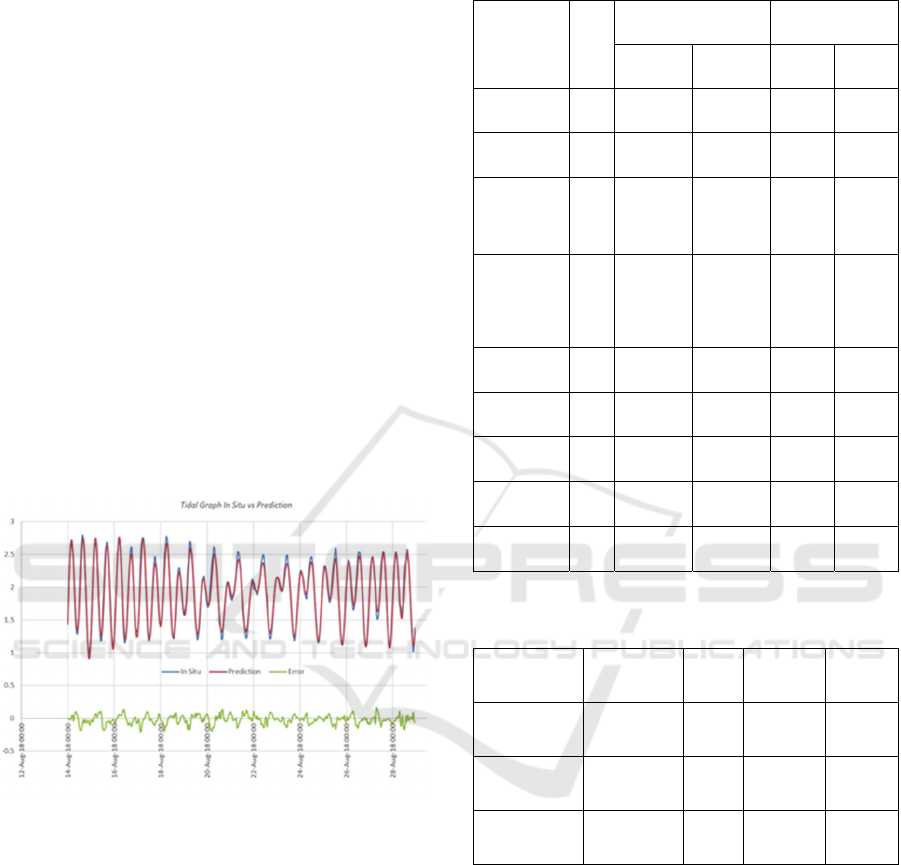
3.1 Ambon
The tide prediction from BIG and the tide observation
at Ambon waters can be seen in the tide graph in
Figure 3. Based on the graph, the tidal prediction has
a similar pattern with tidal in-situ (in-situ is blue and
prediction is red in the Fig 3). The residual for each
tidal elevation from time to time can be seen in a
green color. The Erms on Eq. 2, the accuracy of BIG
tidal prediction is ± 8.5 cm. Based on the tidal
constituents produced by least square method in
Table 3 the residual of the amplitude of the 9 (nine)
tidal prediction and in-situ less than 13 cm. The
accuracy of tidal prediction amplitude to in-situ is 5.3
cm computed by Erms. The phase of M2, N2, K2, M4
and MS4 tidal prediction are slower than tidal in-situ
and otherwise for other phases.
Figure 3: Tidal prediction and in-situ graph at Ambon.
According to the results of the tidal component
calculation for data prediction and in-situ, the vertical
reference such as Mean Sea Level (MSL), High
Highest Water Level (HHWL) and Lowest Low
Water Level (LLWL) which are used in the
hydrographic mapping can be computed from Eq. 3
and Eq. 4. The height difference of MSL, HHWL and
LLWL between tidal prediction and in-situ can be
seen on Table 4. It shows that the height residual of
MSL (-2.2 cm), HHWL (-6.3 cm) and LLWL (2 cm)
are very small.
Table 3: Amplitude and Phase of tidal constituents at
Ambon.
Constituents Sy
m
bol
Phase (degree) Amplitude (m)
In-situ Prediction In-situ Prediction
Main lunar
constituent
M
2
234.4557° 230.8995° 0.5657 0.5604
Main solar
constituent
S
2
208.3771° 217.7096° 0.1055 0.2322
Lunar
constituent,
due to Earth-
Moon distance
N
2
206.3367° 195.3842° 0.1058 0.1178
Soli-lunar
constituent,
due to the
change of
declination
K
2
209.7330° 47.8323° 0.0750 0.0646
Soli-lunar
constituent
K
1
223.3428° 237.4431° 0.2739 0.1885
Main lunar
constituent
O
1
112.9094° 123.5641° 0.1718 0.1343
Main solar
constituent
P
1
7.3897° 240.0212° 0.0575 0.0569
Main lunar
constituent
M
4
263.2144° 119.0107° 0.0078 0.0001
Soli-lunar
constituent
MS
4
296.2383° 129.8310° 0.0173 0.0001
Table 4: Vertical references which can be derived from tidal
constituents.
Vertical
Reference
Abbreviation
In-situ
(m)
Prediction
(m)
Residual
(m)
Mean Sea
Level
MSL 1.9337 1.9121 -0.0216
Highest High
Water Level
HHWL 3.2121 3.1489 -0.0632
Lowest Low
Water Level
LLWL 0.6553 0.6752 0.0199
3.2 Cilacap
The same method used for Ambon was performed for
analyzing tidal prediction and in-situ data at the
Cilacap waters. This is described on tidal chart
(Figure 4). From the graph, we can see that the tidal
prediction and in-situ have the same pattern.
However, the amplitudes of some points are very
different. Generally, the height difference of tidal
prediction and in-situ is between -0,5 m and 1 m.
Using Erms formula on Eq. 2, the accuracy of BIG
tidal prediction in Cilacap is ± 38.5 cm. Based on the
tidal constituents produced by least square method in
ISOCEEN 2018 - 6th International Seminar on Ocean and Coastal Engineering, Environmental and Natural Disaster Management
68
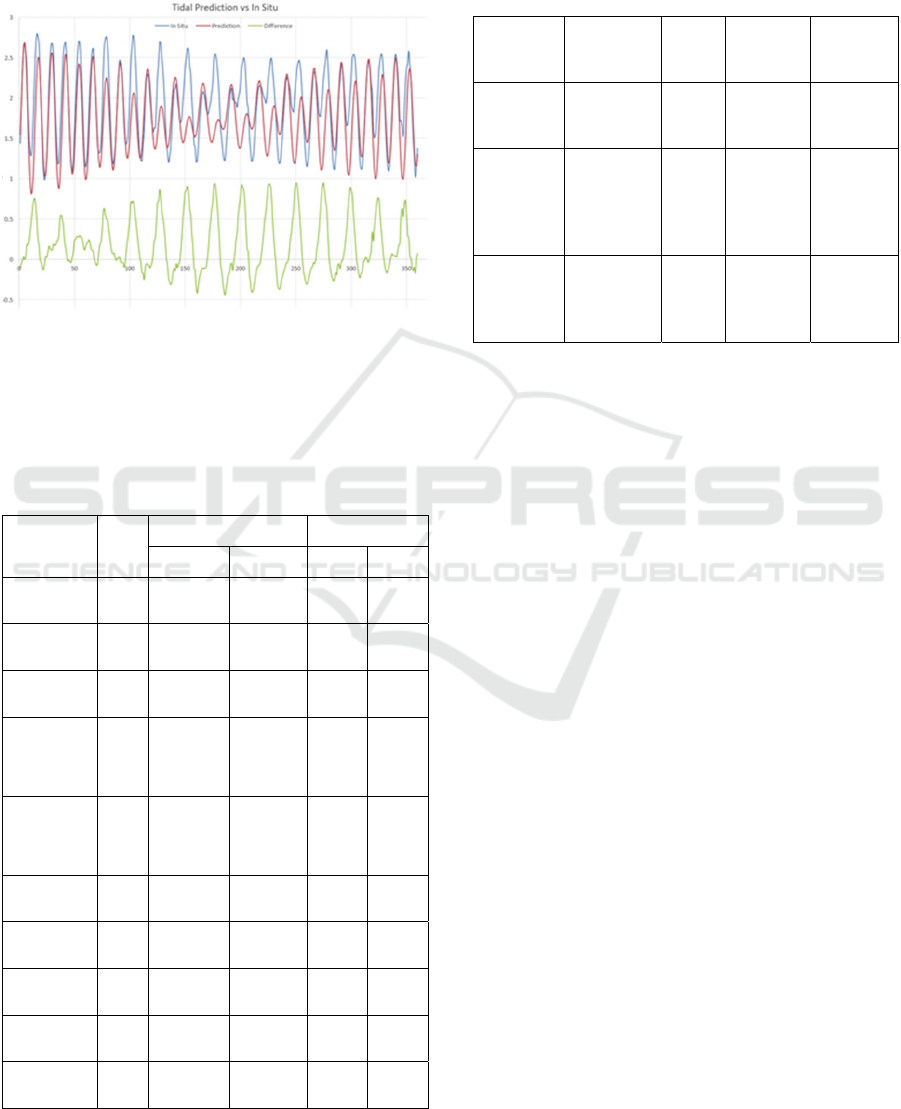
Table 5, the residual of the amplitude of the tidal
prediction and in-situ less than 3 cm and the accuracy
of amplitude of tidal prediction to in-situ is 1.4 cm.
The phase of M2, N2, K2, and S2 are faster than tidal
in-situ and otherwise for other phases.
Figure 4: Tidal prediction and in-situ chart at Cilacap.
According to the results of the tidal component
calculation for data prediction and in-situ, the height
difference of MSL, HHWL and LLWL between tidal
Table 5: Amplitude and phase of tidal constituents at
Cilacap.
Constituents Symbol
Phase (degree) Amplitude (m)
In-situ Prediction In-situ Prediction
Average water
level
Z
0
2.2360 2.0886
Main lunar
constituent
M
2
47.1235° 30.7097° 0.4948 0.5024
Main solar
constituent
S
2
36.1647° 13.2859° 0.2583 0.2906
Lunar
constituent, due
to Earth-Moon
distance
N
2
209.5123° 202.0489° 0.1241 0.1204
Soli-lunar
constituent, due
to the change
of declination
K
2
161.1427° 153.9478° 0.1032 0.1111
Soli-lunar
constituent
K
1
122.5043° 286.9136° 0.2003 0.1776
Main lunar
constituent
O
1
7.7426° 186.8371° 0.1161 0.1162
Main solar
constituent
P
1
41.9251° 218.2835° 0.1121 0.1127
Main lunar
constituent
M
4
294.0919° 319.4123° 0.0001 0.0002
Soli-lunar
constituent
MS
4
281.3738° 328.9046° 0.0001 0.0002
shows that the difference of height of MSL (-14.7
cm), HHWL (-12.2 cm) and LLWL (-17.32 cm) are
relatively small.
Table 6: Vertical reference which can be derived from tidal
constituents at Cilacap.
Vertical
Reference
Abbreviation
In-situ
(m)
Prediction
(m)
Difference
(m)
Mean Sea
Level
MSL 2.2360 2.0886 -0.1472
Highest
High
Water
Level
HHWL 3.5207 3.3992 -0.1215
Lowest
Low Water
Level
LLWL 0.9512 0.7780 -0.1732
4 CONCLUSIONS
In this study, an accuracy assessment has performed
to examine the tide model from Geospatial
Information Agency and in-situ observations from
two areas, Cilacap and Ambon. Based on the study,
both data have similar pattern in hourly basis for 15
days period. The residual height of water level
between tidal prediction and in-situ in Ambon is
0.085m and in Cilacap is 0.385m. The differences of
MSL, HHWL, and LLWL between tidal prediction
and in-situ data in Ambon are -0.022m, -0.063m and
+0.020m and in Cilacap are -0.147m, -0.122m and -
0.173m.
ACKNOWLEDGMENTS
The authors would like to thank Geospatial
Information Agency (BIG) for providing the tidal
prediction data.
REFERENCES
A. G. Stephenson, 2016. Harmonic Analysis of Tides Using
Tide Harmonics. URL: https://CRAN.R-project.org/
package=TideHarmonics.
B. Triatmodjo, 1999. Teknik Pantai. Beta Offset.
Yogyakarta.
Accuracy Assessment of the Geospatial Information Agency’s Tidal Prediction
69

B. B. Parker, 2007. Tidal Analysis and Prediction. NOOA
Special Publication NOS CO-OPS 3.
BIG, 2018. Online Tide Prediction. http://tides.big.go.id/
pasut/.
FEMA, 2016. Guidance for Flood Risk Analysis and
Mapping, Coastal Water Levels. May.
H. Latief, M.R. Putri, F. Hanifah, I.N. Afifah, M. Fadli,
D.O. Ismoyo, 2018. Coastal Hazard Assessment in
Northern part of Jakarta. Science Direct, 212: 1279-
1286. January.
H. V. Thurman, 1994. Introductory Oceanography (7 ed.).
New York, NY: Macmillan.
IHO. Manual on Hydrography, 2005. Publication M-13. 1st
edition. Monaco. International Hydrographic Bureau.
Republik Indonesia, 2011. Undang-Undang Republik
Indonesia Nomor 4 Tahun 2011 Tentang Informasi
Geospasial. Lembaran Negara Republik Indonesia
Tahun 2011 Nomor 49.
ISOCEEN 2018 - 6th International Seminar on Ocean and Coastal Engineering, Environmental and Natural Disaster Management
70
