
Monitoring of Changes of Coastal Conditions as a Result of Increased
Industrial Activities: Case Study - Lamong Bay
Cherie Bhekti Pribadi
1
, Teguh Hariyanto
1
and Akbar Kurniawan
1
1
Geomatics Engineering Department, Faculty of Civil, Environment, and Geo Engineering, Institut Teknologi Sepuluh
Nopember
Keywords: Coastal Condition, Industrial Activities, Lamong Bay
Abstract: Many kinds of activities in Lamong Bay area will have a big impact on the environment and surrounding
communities. Disposal of large quantities of mud and continuously, the construction and expansion of ports
in Lamong Bay was indicated to result in changes of functions around the coast of Lamong Bay. There are
several parameters that can be used to determine changes in coastal functions, one of which is the change of
land cover classes that occur around the coastal and marine areas. Remote sensing methods with satellite
imagery can be a solution for conducting research related to monitoring land cover, because this method is
more efficient and effective in large-scale research, and can be done temporally. The satellite image data used
in this study are various satellite images from 2002 to 2017. The results of the image processing land cover
class validated using the In-Situ data reference from the results of sampling in the field to obtain the linear
correlation value (R2).
1 INTRODUCTION
The port management system in Indonesia should be
able to provide optimal services to the parties
associated with the port. Environmental and
sustainability issues are a major issue related to the
issue of global warming, climate change and energy
consumption (Lam and Voorde, 2012). It’s affects the
changes in physical conditions around the coastal and
marine areas in Teluk Lamong.
Lamong River is one og nine major river in East
Java, Condition of water quality for a few important
parameters as water pollution indicator is exceeded
the boundary conditions which determine the
standard (Wahyuningsih, et.al, 2010). Lamong Bay
port will become an international category with plans
to shift the burden of maritime transportation
movements previously in the silver cape port which
is currently overcapacity, making the Lamong Bay
area the center of the industrial area.
There are several parameters which can be used to
determine changes in coastal functions, one of which
is the change in land cover classes that occur around
the coastal and marine areas. Remote sensing
methods with satellite imagery can be a solution to
research the problem of land cover mapping in coastal
and marine areas, because this method more efficient
and effective in large-scale research. Some multi
temporal satellite imagery can be used from 2002 to
2017 to examine the problem, has good and multi
temporal spatial resolution.
The final result will be expected to provide
information about land cover classes, along with
changes that affect the recommendations for coastal
and marine management in Lamong Bay in order to
optimize the results of mapping research using
satellite image technology and can be useful for the
management of coastal and marine areas in context of
regional development sustainable coastal areas.
2 METHODS
2.1 Study Area
The location of this study took Lamong Bay, which is
located in a geographical position 7°11’13” LS and
112°41’ 24” BT. The study area is presented in the
following figure :
Pribadi, C., Hariyanto, T. and Kurniawan, A.
Monitoring of Changes of Coastal Conditions as a Result of Increased Industrial Activities: Case Study - Lamong Bay.
DOI: 10.5220/0008373100290032
In Proceedings of the 6th International Seminar on Ocean and Coastal Engineering, Environmental and Natural Disaster Management (ISOCEEN 2018), pages 29-32
ISBN: 978-989-758-455-8
Copyright
c
2020 by SCITEPRESS – Science and Technology Publications, Lda. All rights reserved
29
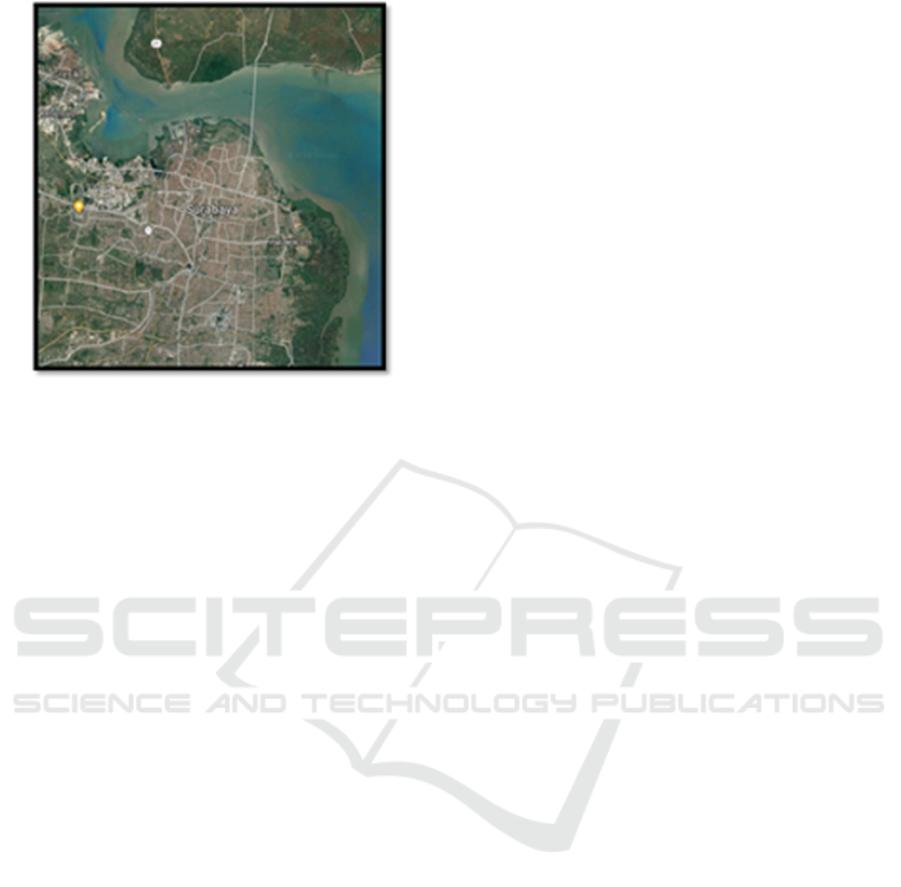
Figure 1: The study area
2.2 Data Acquisition
The data used in this study are Landsat-7 satellite
image data path / row: 118/065 in 2002 and Landsat-
8 satellite image data path / row: 118/065 in 2017.
Data in a period of 15 years was used to determine the
major changes of physical condition such as land
cover changes that occur in the coastal area.
2.3 Data Processing
2.3.1 Digital Classification
Digital classification that used in this image
classification process is a supervised classification
with the type of maximum likelihood classification
using image processing software. Guided
classification is the stage of making comparisons
between each pixel image with each category in key
interpretation is done numerically by determining the
training area. Ground truth is carried out in this
classification process aims to take samples of field
data that are used as reference data to test the accuracy
of image classification using confusion matrix
calculations. Remote sensing techniques, including
the use of conventional aerial photography, can be
used effectively to complement surveys based on
ground observation and enumeration, so the potential
of a timely and accurate inventory of the current use
of the Nation's land resources now exists (Anderson,
et.al, 1976).
2.3.2 Sub-setting Study Area
The research area used in Lamong Bay and its
surroundings, the image used must be subset based on
the specified study area.
2.3.3 Ground Truth
In this research, field survey or groundtruth is
something that must be done. It aims to determine the
condition of sedimentation in field and condition of
the waters in general. Field data is used as a basis for
the interpretation of satellite imagery that represents
the area so that it can support the process of making
land cover maps. The results of the digital
classification are determined by the truth or accuracy
through a test of classification accuracy which is done
by calculating the confusion matrix using image
processing software. Things that must be done before
performing the classification accuracy test are
groundtruth which aims to check in the field about the
truth of the image classification results with the
appearance of the land cover objects in the field.
3 RESULT AND DISCUSSION
Based on research conducted by Ecoton, type of river
from Lamong River which has a high sedimentary
estuary, makes this area as a transit and feeding area
for migra birds from continental Europe to Australia.
Assessment of Land cover changes and
transformation for 15 years in the study area is
extracted from the Landsat 7 images (30 m) for the
period of 2002 and Landsat 8 images (30 m) for the
period 2017 using the Maximum Likelihood
Classifier (MLC) algorithm of supervised image
classification technique. Thus, the result describes the
different land cover feature classes based on the
Level-II category of USGS-LULC classification table
with overall classification accuracies of 79.93% and
81.67% and overall Kappa coeffient statistical values
of 0.69 and 0.76 respectively. The information of land
cover changes and transformation is an essential
source for coastal resources management in the
coastal area.
3.1 Assessment of Land Cover Change
between 2002 and 2017
Assessment of land cover change area in coastal area
of Lamong Bay can be seen in the following table
ISOCEEN 2018 - 6th International Seminar on Ocean and Coastal Engineering, Environmental and Natural Disaster Management
30
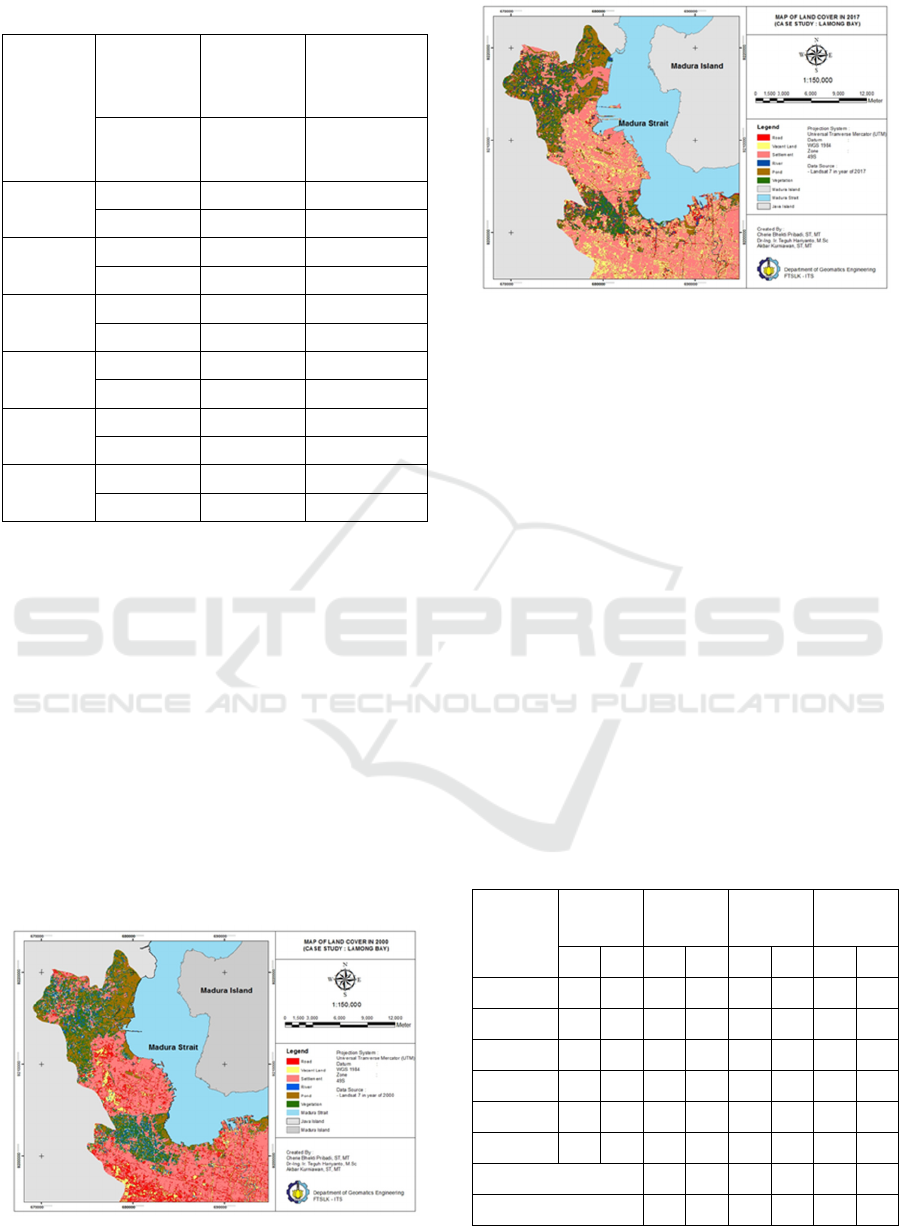
Table 1: Land Cover Change During 15 Years
Land
Cover
Feature
Area in
Period of
2002 (Ha)
Area in
Period of
2017 (Ha)
Area in
Change
During 15
years
% of
distribution
% of
distribution
% of Change
During 15
years
Road
15844.77 8079.48 -7765.29
17.69% 6.94% -29,02
Vacant
Land
9089.71 16937.31 7847.6
10.15% 14.56% 29.32
Settlement
30877.31 33236.28 2358.97
34.47% 28.57% 8.81
River
6704.23 6283.48 -420.75
7.48% 5.40% -1.57
Pond
17850.62 35280.38 17429.76
19.93% 30.32% 65.13
Vegetation
9217.27 16528.33 7311.06
10.29% 14.21% 27.32
Table 1 tell us classification results during 2002
to 2017 to identify the dynamics of change in land
cover in coastal area. The proportions of change in
land cover feature indicate where development
pressure has occurred and they demonstrate an
increase in settlement areas to the detriment of dense
vegetation. In 2002, many residential buildings.
There were some land cover changes area in 2002 to
2017. It occurs due to a change which the increase
occurred, namely the residential area of 2358.97 Ha.
Land cover change in 2002 to 2017 includes changes
vacant land to waters, vacant land to settlements,
vegetation to waters, vacant land to ponds, vegetation
to ponds, vegetation to road. The most dominant
changes are from vacant land to settlements amount
2700.12 Ha.
Figure 2: Map of land cover in 2000
Figure 3: Map of land cover in 2017
3.2 Accuracy Assessment
Accuracy assessment is an integral process of feature
extraction from the classified images. It highlights the
possible sources of errors in a classified image, thus
enhancing the quality of information derived from the
data (Lea and Curtis, 2010). The results of the digital
classification are determined by accuracy assessment
which is done by calculating the confusion matrix
using image processing software. From the results of
the confusion matrix calculation, the results of the
accuracy of all classification results for Landsat 8
satellite images in 2002 were 79.93% and Landsat 8
in 2017 was 81.67%. With the results of the
calculation of the accuracy of the classification, the
results of the land cover classification with five
classes are considered correct because the value is
more than 75%. Overall observation of accuracy
shows the reliability of land cover features in terms of
location area and spatial distribution in the study area.
Table 3: Accuracy assessment of classified Landsat 8
images for 2002 and 2017
Land Cover
Feature
Producer’s
accuracy
(%)
User’s
Accuracy
(%)
Commission
(%)
Omission
(%)
2002 2017 2002 2017 2002 2017 2002 2017
Road 76.38 67.92 22.32 77.42 77.68 22.58 23.62 32.08
Vacant Land 95.47 76.74 94.91 69.47 5.09 30.53 4.53 23.26
Settlement 74.44 91.92 90.06 88.78 9.94 11.22 25.56 8.08
River 80.49 89.82 37.92 74.00 62.08 26.00 19.51 10.18
Pond 83.75 76.86 98.71 90.74 1.29 9.26 16.25 23.14
Vegetation 96.12 100 88.57 90.48 11.43 9.52 3.88 0
Overall Accuracy 79.93 81.56
Overall Kappa Coefficient 0.69 0.76
Monitoring of Changes of Coastal Conditions as a Result of Increased Industrial Activities: Case Study - Lamong Bay
31

4 CONCLUSION
Based on results of this study, there were some land
cover changes area in 2002 to 2017. It occurs due to
a change in the function which the largest increase
occurred, namely the residential area of 2358.97 Ha.
Increase in pond area amount 17429.76 Ha, and
increase in fields area amount 7847.6 Ha. Land cover
change in 2002 to 2017 includes changes vacant land
to waters, vacant land to settlements, vegetation to
waters, vacant land to ponds, vegetation to ponds,
vegetation to road. The most dominant changes are
from vacant land to settlements amount 2700.12 Ha.
REFERENCES
Anderson, J. R., Hardy, E. E., Roach, 1976. J. T., Witmer,
R. E. A Land Use and Land Cover Classification
System for Use with Remote Sensor Data. United
States, Geological Survey Professional, p. 964.
Lam, J.S.L. and van de Voorde, E. 2012. Green Port
Strategy for Sustainable Growth and Development.
Transport Logistics for Sustainable Growth at a New
Level. International Forum on Shipping, Ports and
Airports (IFSPA), 27- 30.
Lea, C., Curtis, A.C. 2010. Thematic accuracy assessment
procedures: National Park Service Vegetation
Inventory, version 2.0. Natural Resource Report
NPS/2010/NRR––2010/204, National Park Service,
Fort Collins, Colorado, USA.
Wahyuningsih, S., Anwar, N., Edijatno, Karnaningroem,
N., 2010. A Comparative Study of Water Quality
Characteristics at East Java River.
ISOCEEN 2018 - 6th International Seminar on Ocean and Coastal Engineering, Environmental and Natural Disaster Management
32
