
Tidal and Seasonal Variability Circulation Patterns in the Coral Reef
System, Berau Continental Shelf, East Kalimantan
Ayi Tarya
1
, A. J. F. Hoitink
2
and M. van der Vegt
3
1
Department of Oceanography, Faculty of Earth Sciences and Technology, Bandung Institute of Technology,
Bandung 40132, Indonesia
2
Hydrology and Quantitative Water Management Group, Wageningen University,
Droevendaalsesteeg 3, 6708 PB Wageningen, The Netherlands
3
Institute for Marine and Atmospheric Research Utrecht/IMAU, Department of Physical Geography, Utrecht University,
P.O. Box 80115, 3508 TC Utrecht, The Netherlands
Keywords: Tidal Variability, Seasonal, Coral Reef System, East Kalimantan.
Abstract: The present study examines tidal and seasonal circulation dynamics in the coral reefs, Berau Continental
Shelf, East Kalimantan which exist multiple reef passages by using analysis field data and a three-dimensional
hydrodynamic model. The predicted M2 tidal currents, velocities, salinity profiles and sea surface elevation
show a good agreement with observed. The model results demonstrate the reef-scale circulation patterns on
tidal to monsoonal variation. On the seasonal timescale, the circulation patterns strongly reflect the Monsoon
seasonality. The coral reefs exposed by river plume when southwesterly wind prevailed. In this period, the
vertical structure of salinity displays a thin stratified water column. The velocity profiles exhibit a classical
estuarine circulation with outflow at the top layer and inflow at the bottom layer. For the tidal periods, the
tidal currents present complex structures at the reef passages and exhibit the tidal eddies generated by
irregularities reef gaps. The flow in the centre of the reef passage is often opposed to the flow near the reef
boundaries. A mixed vertically water column occurs during spring tide. During neap tide, the water column
structures form a thin stratified on top layer and a classical estuarine circulation for velocity profiles. At the
cross-section of reef passages, the lateral velocities develop the two-cell circulation with upward flow at reef
shores and an axial convergence (downward flow) at mid-reef passage during flood and reverse pattern during
ebb. At the reef slope of continental shelf edge, the model results suggest an upward flow that generated by a
Bernoulli effect during flood tide, which may be lifting the nutrient-rich water to the reef passage.
1 INTRODUCTION
Circulation dynamics in coral reef systems can be
driven by a number of forcing functions such as
waves, tides, wind and density gradients (Andrews
and Pickard, 1990; Kraines, 1998; Wolanski, et.al,
1988; Wolanski and Thomson, 1984; Hoitink, 2004;
Monismith, et.al, 2006). The associated length scales
are ranging from an individual coral colony to the
reef, island, and basin scale (Monismith, 2007). In
coral reef systems, the hydrodynamics play a crucial
role in ecological and biogeochemical processes
including dispersal of larval fish and corals (Black,
1993), supply of nutrients to reef organisms (Falter,
et.al, 2004), renewal of oxygen (Nakamori, et.al,
1992), delivery of phytoplankton (Yahel, et.al, 1998),
the dynamics of zooplankton (Yahel, et.al, 2005),
transport of terrigenous sediments (Storlazzi, 2004;
Haitink and Hoekstra, 2003), and the distribution of
mobile reef fishes (Clarke, et.al, 2005). Therefore, to
understand biological and ecological patterns and
function in coral reef systems, it is critical to identify
the circulation and transport processes.
The importance of wind and waves on circulation
patterns in coral reef environments has been
investigated extensively (e.g. Wolanski and
Thomson, 1984; Hoitink and Hoekstra, 2003;
Wolanski and Pickard, 1985; Yamano, et.al, 1998;
Presto, et.al, 2006; Kench, et.al, 2009). Wolanski and
Thomson (1984), Wolanski and Pickard (1985))
reported that the subtidal sea level dynamics and
currents are found to be highly coherent with the local
wind variability in the Great Barrier Reef. Trade
wind-driven processes are found to be the dominant
Tarya, A., Hoitink, A. and van der Vegt, M.
Tidal and Seasonal Variability Circulation Patterns in the Coral Reef System, Berau Continental Shelf, East Kalimantan.
DOI: 10.5220/0008372500090015
In Proceedings of the 6th International Seminar on Ocean and Coastal Engineering, Environmental and Natural Disaster Management (ISOCEEN 2018), pages 9-15
ISBN: 978-989-758-455-8
Copyright
c
2020 by SCITEPRESS – Science and Technology Publications, Lda. All rights reserved
9

control for circulation and sediment dispersal on the
shallow, broad reef flats off southern Molokai,
Hawaii (Presto, et.al, 2006). The interaction between
tides, local bathymetry, coral reef shape, size and
spacing can result in periodic reef-scale flow patterns,
featuring tidal jets, eddies and circulation cells across
the reef passage (Wolanski, et.al, 1988; Wolanski and
Hamner, 1988; Young, et.al, 1994; King and
Wolanski, 1996). Using a regional model with a 2 km
resolution, (King and Wolanski, 1996) established
that such local features result from flow interaction
with complex topography. Local residual flows may
impact the fate of river effluents reaching coral reef
areas, which pose a contemporary threat to the health
of coral reefs. The reef chain under study features a
monsoonal pattern exposed to river plume spreading
(Tarya, et.al, 2015). (Tarya, et.al, 2018) revealed that
the coastal ecosystem communities at the BCS are
most exposed to low salinity when southwesterly
winds are prevalent, at neap tide. These findings
motivate the present study to further investigate the
circulation patterns on the coral reef-scale and on the
intratidal periods. In this contribution, we focus on
the detailed circulation processes across the reef
passages at the BCS, over a tidal cycle.
Figure 1: Map of the Berau barrier reef (a), showing depth
in meters. Berau Continental Shelf and the position of the
Berau barrier reef (b) and map of Indonesia (c). The dashed
red line Te-Tf and Tg-Th indicates the location of the depth
profile across-northern passages (d) and across-southern
passages (e), respectively. The dashed red line Ta-Tb and
Tc-Td are depth profile along the northern (f) and southern
passage (g), respectively. The red circles indicate fixed
ADCP and CTD stations near Derawan Island. Red
triangles indicate fixed ADCP stations at Masimbung inner
shelf and Masimbung outer shelf. The red square indicates
the sea surface elevation at CG station.
2 STUDY AREA
The Berau barrier reef is a juxtaposition of permanent
and periodically exposed reef islets at the edge of the
BCS, East Kalimantan (Figure 1). It features a
species-rich coral reef ecosystem (Hoeksema and
Suharsono, 2004; Renema, 2006; Renema, 2006;
Voogd and Becking, 2009), which is part of the Coral
Triangle in the central Indo-West Pacific (Tomascik,
et.al, 1997; Hoeksema, 2007). The islets are
elongated in the along-shelf direction, and are
separated by 0.8 to 3 km wide passages with depths
between 5 and 50 m (Figure 1d and 1e). In the
northern areas of the barrier reef, passages can be as
deep as 50 m, whereas in the south the depths in the
passages are less than 15 m. The reef flats emerge
only during low water spring tide. The inner shelf
separating the barrier reef from the Berau estuary is
about 30 km wide. Depths in that area are typically
around 30 m. Figures 1f and 1g show typical bottom
profiles across the passages. The northern passage has
a depth of about 50 m and in the southern passage, the
depth is in the order of 10 m or less. Further seaward,
the shelf break is located with a very steep bottom
slope. Corals are found across a water gradient from
fluvially influenced to fully oceanic conditions.
Inshore, reefs feature a relatively low coral cover,
with high densities of filter feeders such as sponges,
soft corals and crinoids (Renema, 2006). Coral rubble
in the areas close to the mainland is often covered by
fine mud and silt, with a terrigeneous origin. The
outer shelf reef is comprised of diverse reef types,
dominated by dense stands of corals and coarse sand
(Renema, 2006).
3 METHODS
3.1 Field Surveys
Flow velocities, sea surface elevations and
meteorological data were gathered during three field
campaigns in the period between September 2006 and
February 2008. Acoustic Doppler current profiler
(ADCP) surveys were collected with an RD
Instruments Broadband 1200-kHz ADCP, pinging at
2 Hz over 60 depth cells with a size of 0.5 m. The
ADCP transducer was mounted approximately 0.5 m
below the sea surface, and had a 0.5 m blanking
distance. The survey boat sailed at a speed of
approximately 2 m/s. As a result of the extremely
clear water conditions, ADCP backscatter rapidly
decreased with depth, limiting the observation range
to 15 m. Repeated transect measurements were
carried out across several cross-sections in a northern
and a southern reef passage. The track length was
chosen to include the largest number of cross-sections
that could be covered within about 1.5 hours, such
ISOCEEN 2018 - 6th International Seminar on Ocean and Coastal Engineering, Environmental and Natural Disaster Management
10
that each location on the track was repeated 10 times
within an M2 tidal cycle.
3.2 Hydrodynamic Model
The simulations were performed using the Princeton
Ocean Model (POM) (Blumberg and Mellor, 1987).
This is a three-dimensional, terrain-following finite
difference model based on sigma-coordinates, which
solves for water level, velocity, temperature, salinity,
turbulence kinetic energy and macro-scale turbulence
properties. The model adopts the turbulence closure
scheme by (Mellor and Yamada, 1982) to
parameterise vertical mixing and uses the
(Smagorinsky, 1963) diffusivity formulation for
horizontal diffusion. POM has been used in a variety
of oceanic and coastal applications including coral
reef systems (e.g. Ezer, et.al, 2005; Ezer, et.al, 2010).
The local model was nested in the existing
regional model by (Tarya, et.al, 2015) and features a
200 × 200 horizontal orthogonal curvilinear grid, with
a resolution ranging from 40 m at reef passages to
about 100 m at the outer shelf. 15 sigma levels were
defined at 2, 4, 6, 8, 10, 15, 25, 40, 50, 60, 70, 80, 90,
95 and 100% of the water depth. The depth of each
grid cell in the reef environment was interpolated
from bathymetry data measured during a field survey.
Depths in the parts of the domain that cover the shelf
and deep sea areas were derived from the Indonesian
Naval Hydro-Oceanographic Office (DISHIDROS).
A computational time step of 1 s was used for the
external mode, while the internal mode time step was
set to 10 s.
Sea surface elevation, currents, temperature and
salinity at the open boundaries were obtained from
the BCS regional model (Tarya, et.al, 2015). The sea
surface elevation and momentum variables were
implemented adopting the radiation condition of
(Orlanski, 1976) that allows incoming waves to freely
propagate into the domain, and pass out to the exterior
without any reflection back into the computational
domain. Time-variable winds are imposed uniformly
over the domain model. Hourly observations were
collected from Derawan station (see Figure 1) for
the period from March 2007 to January 2008,
while the wind data for the period February 2006 to
January 2007 was extracted from the NCEP
reanalysis database, provided by the National
Oceanic and Atmospheric Administration (NOAA)
(www.esrl.noaa.gov/psd).
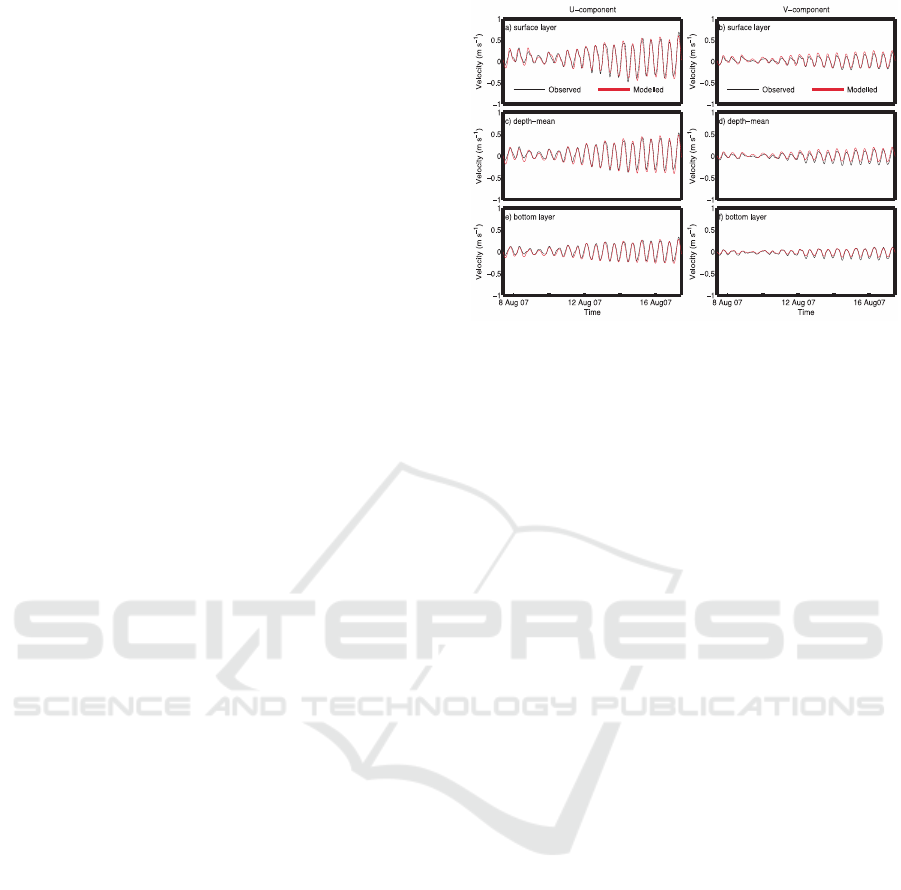
Figure 2: Modelled and observed comparison for surface
layer (a and b), depth-mean (c and d) and bottom layer (e
and f) velocity for east (left panels) and north direction
(right panels) components of the flow near Derawan (see
Figure 1).
4 RESULTS
4.1 Comparison of Model Results and
Measurements
Modelled sea surface elevation, velocity profiles and
salinity were compared with observations to evaluate
the performance of the model. Figure 2 present time-
series of observed and modelled velocity for the
surface layer, the depth-averaged and the bottom
layer near Derawan Island. Model performance is
quantified by the Mean Absolute Error (MAE), the
Root Mean Square Error (RMSE) and the Correlation
Coefficient (CC) (Liu, et.al, 2009; Vested, et.al,
2013) as displayed in Table 1. The CC score between
modelled and observed values of sea surface
elevation is 0.95. RMSE and MAE are 0.08 m and
0.09 m, respectively. The modelled velocity profiles
reveal a CC score above 0.86; MAE and RMSE are
lower than 0.14 m/s. For the salinity profiles, the CC
score is above 0.86. MAE and RMSE are less than 0.1
psu. Overall, model-data comparisons have shown
that the model performs well in reproducing the
observations.
Tidal and Seasonal Variability Circulation Patterns in the Coral Reef System, Berau Continental Shelf, East Kalimantan
11
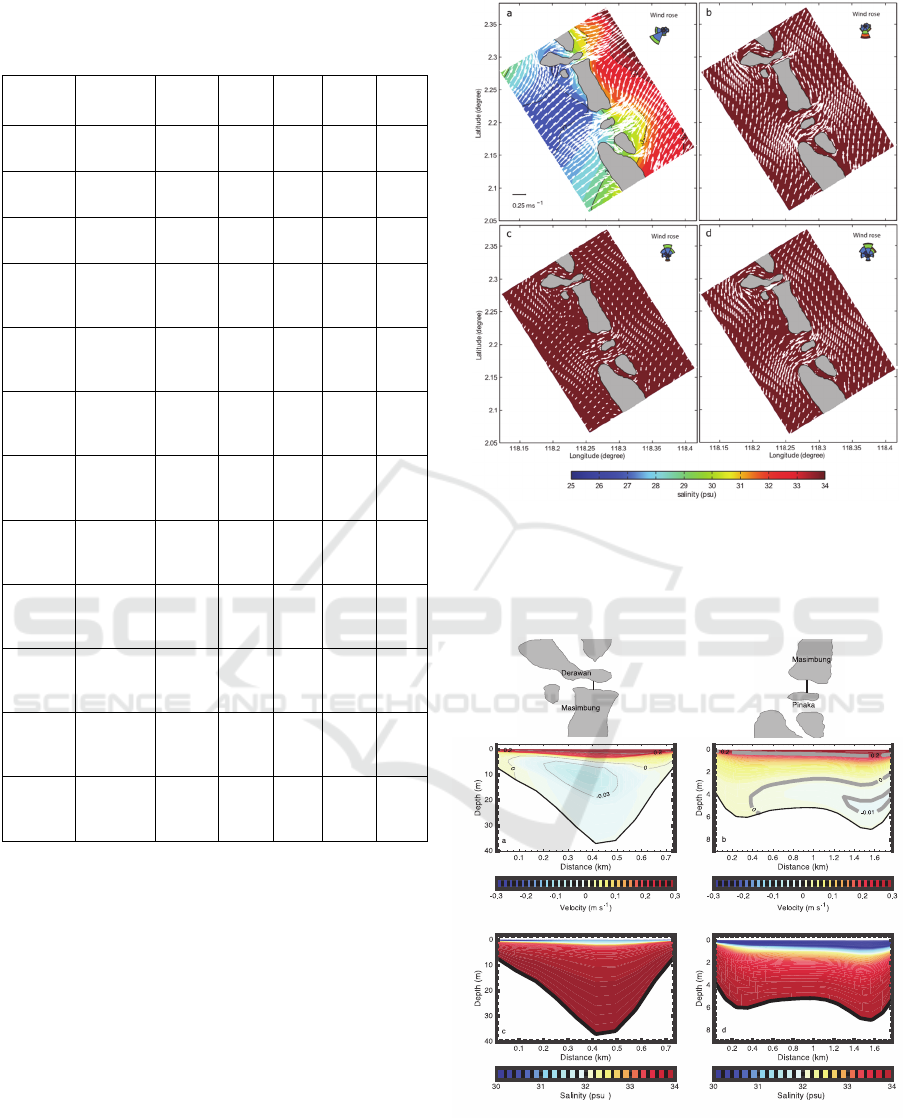
Table 1: Validation model results with observations based
on the Mean Absoulte Error (MAE), Root Mean Square
Error (RMSE) and Correlation Coefficient (CC).
Location Parameter Layer Period MAE
RMS
E
CC
Derawan Salinity Surface
8 Aug
07
0.04
psu
0.08
psu
0.87
Middle
8 Aug
07
0.04
psu
0.07
psu
0.91
Bottom
8 Aug
07
0.03
psu
0.05
psu
0.95
Salinity Surface
14
Aug
07
0.05
psu
0.06
m/s
0.94
Middle
14
Aug
07
0.03
psu
0.05
m/s
0.93
Bottom
14
Aug
07
0.03
psu
0.04
m/s
0.95
Derawan
East
velocity
Surface
7-17
Aug
07
0.07
m/s
0.09
m/s
0.93
Middle
7-17
Aug
07
0.10
m/s
0.13
m/s
0.84
Bottom
7-17
Aug
07
0.05
m/s
0.04
m/s
0.96
North
velocity
Surface
7-17
Aug
07
0.04
m/s
0.05
m/s
0.92
Middle
7-17
Aug
07
0.05
m/s
0.06
m/s
0.81
Bottom
7-17
Aug
07
0.03
m/s
0.03
m/s
0.94
4.2 Seasonal Circulation Dynamics
The Figure 3 describes the mean circulation and
salinity patterns for the surface layer demonstrate a
monsoonal pattern. During the transition from the
Northwest to the Southeast Monsoon (Figure 3a), the
south westerly wind generates the residual northeast
flow toward the coral reefs. The vertical structure of
velocity exhibits a classical estuarine circulation with
offshore flow in a low- density top layer and inshore
flow in the bottom layer, for both reef passages
(Figure 4).
During the Southeast Monsoon (Figure 3b), the
steady southerly winds drive northward residual
currents aligned with the barrier reef. In this period,
there are no freshwater influences in the barrier reef
area. The wind changes from southerly to northerly
Figure 3: Seasonal pattern of salinity and velocity in the
surface layer during transition from the Northwest to the
Southeast Monsoon (a), the Southeast Monsoon (b), the
transition from the Southeast to the Northwest Monsoon
(c), and the Northwest Monsoon (d).
Figure 4: Modelled mean velocity profiles during the
transition from the Northwest to the Southeast Monsoon in
cross-sections of the northern reef passage between
Derawan and Masimbung (a) and the southern reef passage
between Masimbung and Pinaka (b). The bottom panels
show the corresponding salinity field. The locations of the
transects are indicated in the top plots.
ISOCEEN 2018 - 6th International Seminar on Ocean and Coastal Engineering, Environmental and Natural Disaster Management
12
during the Southeast to Northwest Monsoon
transition. This shifts the surface circulation patterns
from northward to southward flow (Figure 3c).
Subsequently, the currents through the reef passages
weaken and reverse from offshore to inshore.
Although the wind is relatively weak during this
period, it is effective in dispersing the river plume to
the south of the BCS (Tarya, et.al, 2010) and thus the
reef passages present vertically uniform seawater and
homogeneous velocity profiles directed inshore.
During the Northwest Monsoon (Figure 3d), the mean
circulation and mean salinity patterns are similar to
those in the transition period, but the flow is stronger
due to increased northerly wind speed.
4.3 Seasonal Circulation Dynamics
4.3.1 Horizontal Structures
Figure 5 displays depth-mean instantaneous velocity
patterns over a tidal cycle in two reef passages. The
asymmetric topography of the barrier reef causes
flood flow patterns to deviate from the ebb flow
patterns. This holds especially in the northern passage
(Figure 5 left panels), where several eddies are
created in the lee of reef outcrops. The flow in the
center of the reef passage is often opposed to the flow
near the reef boundaries. The reef waters are subject
to tidally-driven flow separation and transient eddy
development, as observed previously by (Pingree,
1978; Black and Gay, 1987; Signell and Geyer,
1991). Reef outcrops can act as headlands, generating
an adverse pressure gradient where the laterally
confined flow diverges and decelerates again.
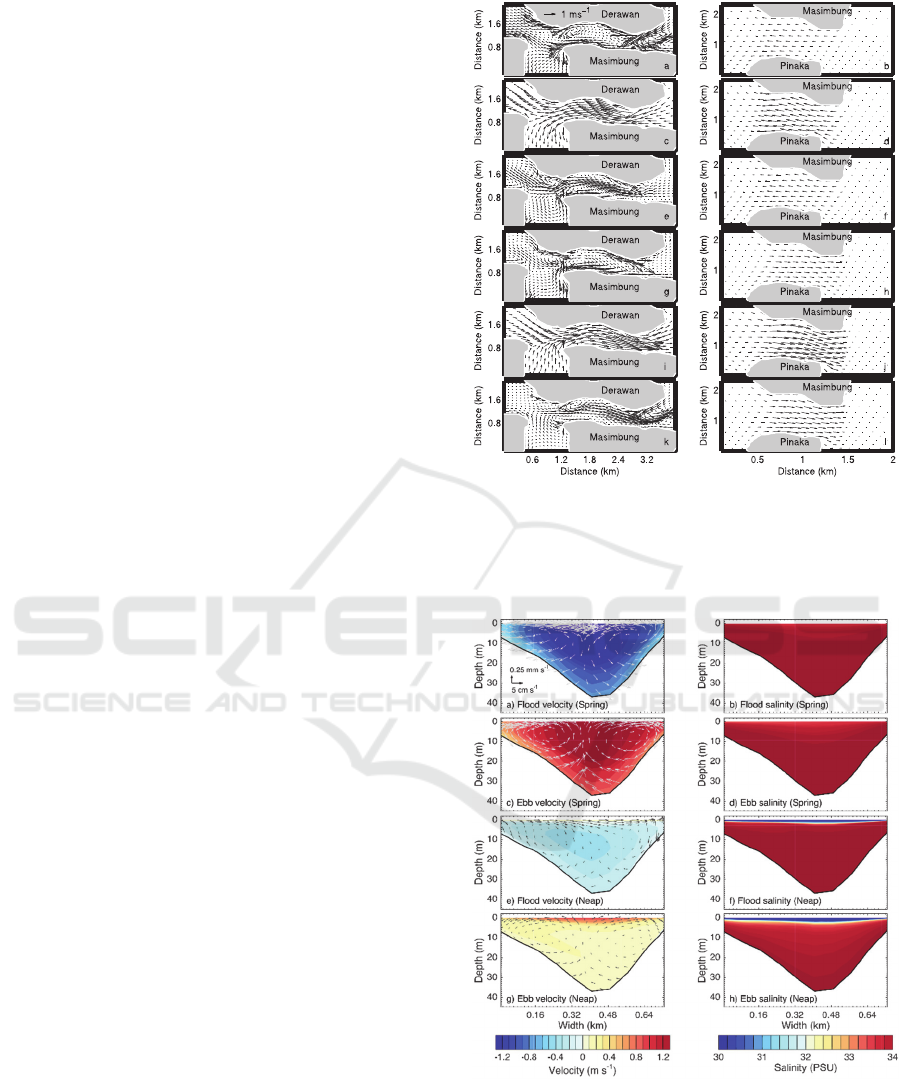
4.3.2 Vertical Structures
Figures 6 illustrates streamwise and lateral velocities
for peak flood and peak ebb during spring and neap
tides, across the northern reef passage. The flow
structure presents a distinctive temporal evolution
over a tidal cycle. During spring tide, along-channel
velocities attain magnitudes above 1 m/s, which
causes strong vertical mixing, preventing
stratification. The lateral flow structure exhibits a
two-cells pattern with surface flow convergence
toward the middle of the passage and bottom flow
divergence. The secondary circulation reverses
during ebb. For neap tide, along-channel velocities
become weaker and allow stratification. The same
two counter-rotating cells of lateral circulation on
either side of the channel axis are evident at neap tide.
However, the flow magnitude is reduced compared to
spring tide conditions.
Figure 5: Depth-mean velocity structure during spring tide
at early flood (a,b), maximum flood (c,d), late flood (e,f),
early ebb (g,h), maximum ebb (i,j), and late ebb (k,l) in
northern (left panels) and southern reef passages (right
panels).
Figure 6: Flow velocities (a,c,e and g) and salinity (b,d,f and
h) for a cross-section in northern passage during spring tide
and neap tide. The transect is the same as in Figure 5. Colors
in the left panels indicate along-reef velocity in the passage.
Red indicates offshore flow and blue represents flow
toward the inner shelf. Arrows display lateral and vertical
velocity components. Color in right panels indicates
salinity.
Tidal and Seasonal Variability Circulation Patterns in the Coral Reef System, Berau Continental Shelf, East Kalimantan
13

5 DISCUSSION
The south westerly wind during the transition period
drives a north eastward flow that pushes the river
plume to the barrier reef and results in reef exposure
to terrestrial contaminants. The Northwest Monsoon
induces a southward residual current that conveys
seawater from the open sea. This sequence is essential
for flushing of poor quality water. The importance of
wind-driven flow to the survival of corals was
previously demonstrated by (Kitheka, 1997), who
found that the onshore wind-driven flow traps the
brackish plume along the south- western coast of the
Gazi Bay in Kenya. This ensures that turbid water
from the rivers does not reach the coral reef
ecosystem in Gazi Bay. Wind induced circulation
patterns that play a role in flushing of poor quality
water was also reported for the Florida Keys coral
reefs (Smith, 2009).
The present study highlights two important
processes in coral reef circulation. First, coral reefs
that possess a highly irregular shoreline and bottom
generate eddies (Pingree and Maddock, 1978). Over
time these eddies grow and decay with tidal phases
and result in a non-uniform residual flow field. This
asymmetry in flow creates a potentially longer
retention time of water masses in certain areas around
the reef. The generation of the eddies has been
proposed as an important physical mechanism that
may limit the dispersion of larvae due to the
recirculating properties of the water masses that trap
and conserve propagules near reefs.
Second, lateral velocity shear in a reef passage
with longitudinal density gradients produces the two-
cell secondary circulation patterns that form a mid-
channel axial convergence and divergence zone over
a tidal cycle (Nunes, 1985). The present results
highlight the secondary flow structure in the reef gaps
during ebb tide and suggest that the water masses of
the river plume may be advected in a downward
direction leading to additional exposure of the reefs.
This process occurs at the shallow reef gaps during
neap tides when stronger buoyancy forcing exists.
6 CONCLUSIONS
Coral reefs that possess a highly irregular shoreline
and bottom generate eddies. Over time these eddies
grow and decay with tidal phases and result in a non-
uniform residual flow field limiting the dispersal of
larvae. Lateral velocity shear in a reef passage with
longitudinal density gradients produces the two-cell
secondary circulation patterns that form a mid-
channel axial convergence and divergence zone over
a tidal cycle.
ACKNOWLEDGEMENTS
This work was partially funded by Research,
Community Service and Innovation, Bandung
Institute of Technology (P3MI-ITB 2018). The
fieldwork was part of the East Kalimantan
Programme (EKP) funded by WOTRO Science for
Global Development, a division of the Netherlands
Organisation of Scientific Research (NWO) under
grants WT77–204.
REFERENCES
A. Blumberg, G. L. Mellor, 1987. Three-Dimensional
Coastal Ocean Models, Amer. Geophys. Union,
Washington D.C, Coastal and Estuarine Sciences 4, pp.
1–20.
A. Tarya, A. J. F. Hoitink, M. Van der Vegt, 2010. J.
Geophys. Res. 115, c09029.
A. Tarya, A. J. F. Hoitink, M. Van der Vegt, M. van
Katjwijk, B. Hoeksema, T. Bouma, L.P.M. Lamers,
M.J.A. Christianen, 2018. Cont. Shelf Res. 153, 1.
A. Tarya, M. Van der Vegt, A.J.F. Hoitink, 2015. J.
Geophys. Res. 120, 16.
A. J. F. Hoitink, 2004. Marine Geology 208, 13.
A. J. F. Hoitink, P. Hoekstra, 2003. Estuarine Coastal Shelf
Sci. 58, 743.
B. Hoeksema, Suharsono, D. Cleary, 2004. Marine
biodiversity of the coastal area of the Berau region, East
Kalimantan, Indonesia. Progress report East
Kalimantan Program– Pilot phase (October 2003),
Naturalis, Leiden, 2004, pp. 7–16.
B. King, E. Wolanski, 1996. J. Mar. Syst. 9, 187.
B. W. Hoeksema, in Biogeography, Time, and Place:
Distributions, Barriers, and Islands, 2007. edited by W.
Renema, Springer Netherlands, Dordrecht, pp. 117–
178.
C. D. Storlazzi, A.S. Ogston, M. H. Bothner, M. E. Field,
M. K. Presto, 2004. Cont. Shelf Res. 24, 1397.
E. Wolanski, E. E. Drew, A. K. M., J. O’Brien, 1988.
Estuarine Coastal Shelf Sci. 26, 169.
E. Wolanski, G. L. Pickard, 1985. Coral Reefs 4, 47.
E. Wolanski, R. E. Thomson, 1984. Estuarine Coastal Shelf
Sci. 18, 271.
E. Wolanski, W. M. Hamner, 1988. Science 241, 177.
G. Yahel, A. Post, K. Fabricius, D. Marie, D. Vaulot, A.
Genin, Limnol. 1998. Oceanogr. 4, 551.
G. L. Mellor, T. Yamada, 1982. Rev. Geophys. Space Phys.
20, 851.
H. Yamano, H. Kayanne, N. Yonekura, H. Nakamura, K.
Kudo, 1998. Coral Reefs 17, 89.
ISOCEEN 2018 - 6th International Seminar on Ocean and Coastal Engineering, Environmental and Natural Disaster Management
14

H. J. Vested, J. W. Nielsen, H. R. Jensen, K. H. Kristensen,
2013. Quantitative Skill Assessment for Coastal Ocean
Models, American Geophysical Union, pp. 373–396.
I. Orlanski, 1976. Journal of Computational Physics 21,
251.
I. Young, K. Black, M. Heron, 1994. Cont. Shelf Res. 14,
117.
J. Falter, M. Atkinson, M. Merrifield, Limnol. 2004.
Oceanog. 49, 18.
J. Smagorinsky, 1963. Mon. Weather Rev. 91, 99.
J. C. Andrews, G. L. Pickard, 1990. Coral Reefs, edited by
Z. Dubinsky. Elsevier, Ecosystems of the world 25,
chap. 2, pp. 11–48.
J. U. Kitheka, 1997. Estuarine Coastal Shelf Sci. 45, 177.
K. P. Black, 1993. Coral Reefs 4, 201.
K. P. Black, S.L. Gay, 1987. J. Geophys. Res. 92, 9514.
M. Presto, A. Ogston, C. Storlazzi, M. Field, 2006.
Estuarine Coastal Shelf Sci. 67, 67.
N. de Voogd, L. Becking, D. Cleary, 2009. Mar. Ecol.
Prog. Ser. 396, 169.
N. P. Smith, 2009. Cont. Shelf Res. 29, 362.
P. Kench, K. Parnell, R. Brander, 2009. Mar. Geol. 266, 91.
R. Nunes, 1985. J. Simpson, Estuarine Coastal Shelf Sci.
20, 637.
R. Signell, W.R. Geyer, 1991. J. Geophys. Res. 96, 2561.
R. Yahel, G. Yahel, A. Genin, 2005. Coral Reefs 24, 75.
R. D. Clarke, E.J. Buskey, K.C. Marsden, 2005. Mar. Biol.
146, 1145.
R. D. Pingree, L. Maddock, 1978. Deep Sea Res. 25, 53.
S. Monismith, A. Genin, M. Reidenbach, G. Yahel, 2006.
J. Koseff, J. Phys. Ocean. 36, 13.
S. B. Kraines, 1998. Coral Reefs 17, 133.
S. G. Monismith, 2007. Annual Review of Fluid Mechanics
39, 37.
T. Ezer, D. V. Thattai, B. Kjerfve, W. D. Heyman, 2005.
Ocean Dynamics 55, 458.
T. Ezer, W. D. Heyman, C. Houser, B. Kjerfve, 2010.
Ocean Dynamics 61, 581.
T. Nakamori, A. Suzuki, Y. Iryu, 1992. Cont. Shelf Res. 12,
951.
T. Tomascik, A. J. Mah, A. Nontji, M. K. Moosa, 1997. The
Ecology of the Indonesian Seas, Vol. 7 of The Ecology
of Indonesia Series, Periplus Editions (HK) Ltd.,
Singapore, 1388 p.
W. Renema, 2006. Coral Reefs 25, 351.
W. Renema, 2006. Mar. Micropaleontol. 58, 73.
Y. Liu, P. MacCready, B. M. Hickey, E. P. Dever, P. M.
Kosro, N. S. Banas, 2009. J. Geophys. Res. 114,
c00B04.
Tidal and Seasonal Variability Circulation Patterns in the Coral Reef System, Berau Continental Shelf, East Kalimantan
15
