
Analysis of Eugenol Content in Ethanolic Extract of Galangal
Rhizome (Alpinia galanga L. Willd) Ointment Using UV-VIS
Spectrophotometry Method
Adi Yugatama, Sholichah Rohmani and Rizky Apriliani
Department of Pharmacy, Faculty of Mathematics and Natural Sciences, Sebelas Maret University, Indonesia
Keywords: eugenol, ointment, galangal rhizome, UV-Vis spectrophotometry
Abstract: Galangal (Alpinia galanga L.) is a plant that commonly used by people as traditional medicines. Galangal
rhizome contains various compounds such as galangin, methyl cinnamate, cineole, camphor, δ-pinene, and
eugenol. Eugenol has an analgesic, antioxidant, and antibacterial activity that is usually used in topical
preparations. In manufactured drugs, it is necessary to examine active compound which is one of the
requirements to ensure its quality. This study aims to find out eugenol levels in the ointment of ethanolic
extract from galangal rhizome. The method used to extract secondary metabolite from galangal rhizome is
digestion using ethanol 70%. Eugenol separation from ointment of ethanolic extract of galangal rhizome
was done by liquid-liquid extraction using chloroform as a solvent. The eugenol was analyzed using a UV-
Vis Spectrophotometer because eugenol has chromophore, a benzene ring, so able to absorb ultraviolet
light. Parameters of validation method used in this study are linearity, accuracy, precision, Limit of
Detection (LOD) and Limit of Quantification (LOQ). The result showed that analysis method of eugenol in
the ointment of ethanolic extract of galangal rhizome has good validation, with linearity, accuracy and
precision occupied the requirement, LOD level is 2.388 μg/mL and LOQ level 7.235 μg/mL. Determination
of eugenol level in the ointment of ethanolic extract from galangal rhizome obtained the result of 5.187
mg/gr sample.
1 INTRODUCTION
Galangal is a plant that has been used traditionally as
a medicinal plant. The galangal rhizome is easily
obtained and often used as food spices. Galangal
rhizome contains various compounds, such as
flavonoids, terpenoids, saponins, phenolic acids and
essential oils (Tang et al., 2018). In galangal
essential oils, eugenol has various activities as an
analgesic, antifungal, antitermitic, antibacterial, anti-
inflammatory, and antioxidant (Magalhães et al.,
2018; Park et al., 2011; Xie et al., 2015; Zhang et
al., 2017).
The utilization of ethanol extract of galangal
rhizome as topical medicines when used directly on
the skin is not optimal and is less comfortable, so it
is necessary to create an ointment preparation form.
This form of ointment is preferred, because it is
easier to use, practical, site-specific application of
drug on affected area, convenient for unconscious
patients having difficulty in oral administration,
chemically more stable, and avoid first-pass
metabolism of drug (Shelke and Mahajan, 2015). In
manufactured drugs, it is necessary to examine
active compounds which is one of the requirements
to ensure its quality. A good quality of drug
preparation will greatly support the achievement of
the expected therapeutic effect.
Eugenol has chromophore which is a group in
organic compounds that is capable of absorbing
ultraviolet light and visible light. The use of UV-Vis
spectrophotometry for analyzing eugenol levels in
drug preparation has great benefits in the industrial
world. The method is simple, fast, economical, able
to measure a solution with very small
concentrations, and can produce results accurately.
Until now, there has been no research that performed
the analysis of eugenol in ointment of ethanol
extract of galangal rhizome using UV-Vis
spectrophotometry. Based on the reasons mentioned
above, it is necessary to examine an analytical
method to determine the level of eugenol in the
90
Yugatama, A., Rohmani, S. and Apriliani, R.
Analysis of Eugenol Content in Ethanolic Extract of Galangal Rhizome (Alpinia galanga L. Willd) Ointment Using UV-VIS Spectrophotometry Method.
DOI: 10.5220/0008239900900095
In Proceedings of the 1st Muhammadiyah International Conference on Health and Pharmaceutical Development (MICH-PhD 2018), pages 90-95
ISBN: 978-989-758-349-0
Copyright
c
2021 by SCITEPRESS – Science and Technology Publications, Lda. All rights reserved

ointment of ethanol extract of galangal rhizome
using UV-Vis spectrophotometry method.
2 MATERIALS AND METHOD
2.1 Materials
The tools used in this study are rotary evaporator
(RVO 400SD Boeco Germany), magnetic stirrer
(IKA C-MAG HS 7), stirrer bar, analytical scale
(KERN ALJ), UV-Vis Spectrophotometer (Thermo
Scientific Genesys 10S), waterbath. Galangal
rhizome obtained from Wonogiri regency, vaseline
album (Bratacco), cera alba (Bratacco), stearyl
alcohol (Bratacco), standard eugenol (Merck),
ethanol 70%, ethanol pa (Merck), KOH (Merck),
H2SO4 (Merck), n-hexane, ethyl acetate pa (Merck),
chloroform pa (Merck), filter paper, and aquadest.
2.2 Methods
2.2.1 Preparation of Ethanolic Extract
Galangal Rhizome
The galangal rhizomes were washed, finely
chopped, dried at 50ºC and then powdered. Galangal
powder was extracted using 70% ethanol with 1:10
ratio. The extraction was heated in waterbath at 40-
50ºC and stirred in 3000 rpm for 1 hour. The liquid
extract obtained was separated, then thickened using
rotary evaporator at 50ºC until viscous extract was
obtained.
2.2.2 Qualitative Test for Ethanolic Extract
of Galangal Rhizome
Extract and standard eugenol was spotted on TLC
plate (silica gel GF254) and eluted with mobile
phase (n-hexane:ethyl acetate, 4:1 v/v). Spots were
observed at UV 254 nm. The separation was done
and Rf value of extract was calculated and then
compared to Rf value of standard eugenol.
2.2.3 Formula Ointment of Ethanolic Extract
of Galangal Rhizome
Vaseline album, cera alba, stearyl alcohol were
heated in waterbath until they melted. Vaseline
album and cera alba were put into a warm mortar,
mixed and stirred until cool. Subsequently, stearyl
alcohol was added, stirred until homogeneous and
formed an ointment base. Then ethanol extract of
galangal rhizome was added and stirred until
homogeneous. The ointment obtained was tested by
organoleptic. The formula of the ointment is
described in Table 1.
2.2.4 Extraction Eugenol from Ointment
The separation process of eugenol from the ointment
was carried out by liquid-liquid extraction method
(LLE) using separating funnel. The sample used was
the ointment of ethanolic extract of galangal
rhizome. 2.5 grams of ointment was weighed and 20
mL of KOH solution 0,8 N was added to break the
ointment matrix, then stirred at 2000 rpm for 30
minutes at 25ºC. The base was then separated and
water-soluble phase was taken. The water phase was
added with chloroform and shaken for 10 minutes to
allow 2 layers to form. The layers were separated
and the aqueous phase taken, added with H
2
SO
4
until pH 4 then added with 10 mL of chloroform and
extracted 3 times. The chloroform phase was
evaporated, then the residue was dissolved in 5 mL
of ethanol, filtered and inserted to the flakon.
2.2.5 Determination of Lambda Maximal of
Eugenol
Stock solution was prepared by dissolving 10 mg
standard eugenol in ethanol of up to 100 ml to obtain
1000 ppm of eugenol stock solution. From this stock
solution, 100 µL was dissolved in 10 mL of ethanol
(10 ppm), then the determination of λ max was
carried out.
2.2.6 Preparation of Standard Curve of
Eugenol
From eugenol stock solution, 3, 5, 15, 25, 30, 35
µg/mL were prepared and scanned in
spectrophotometry UV. The corresponding
absorbances were noted and then a calibration curve
was plotted.
2.2.7 Validation Method
Validation of the analysis method included linearity,
precision, accuracy, LOD and LOQ. Linearity was
Table 1. Ointment formula of ethanolic extract of
galangal rhizome
Ingredients
Quantity
(%)
Ethanolic extract galangal rhizome 10
Vaseline album 78
Cera alba 9
Stearyl alcohol 3
Analysis of Eugenol Content in Ethanolic Extract of Galangal Rhizome (Alpinia galanga L. Willd) Ointment Using UV-VIS
Spectrophotometry Method
91
performed by adding standard concentrations of 3, 5,
15, 25, 30, and 35 μg/mL to the samples prior to
extraction process. The absorbance was measured
and calibration curve was determined by linear
regression equation and correlation coefficient was
calculated. Precision was tested as repeatability
(intraday) and intermediate precision (interday).
Repeatability: analyzing the samples that have been
added with the series of eugenol standard solutions
5, 15, 25, 30, 35 μg/mL, measured three times in one
day. Percentage of RSD was calculated from the
obtained absorbance to determine variations within a
day. Intermediate precision: analyzing the samples
that have been added with the series of eugenol
standard solutions 5, 15, 25, 30, 35 μg/mL,
measured on three different days. The percentage of
RSD was calculated from the obtained absorbance to
determine the variation between days. Accuracy test
was performed by adding solution series of eugenol
concentrations of 5, 15, 25, 30, 35 μg/mL and
replicated 4 times. Accuracy was indicated as %
recovery. The analysis was repeated three times.
LOD and LOQ was performed by calibration curve
method using linear regression line. The standard
deviation was calculated using calibration curve then
calculated to find the value of LOD and LOQ.
2.2.8 Determination of Eugenol Level in
Ointment of Ethanolic Extract of
Galangal Rhizome
Eugenol levels were determined by liquid-liquid
extraction method (LLE) using separating funnel
and then measured using a UV-Vis
spectrophotometer. The method used is standard
additions. The absorbance of the sample without the
addition of standard solution was then inserted into
the calibration curve previously obtained, and the
regression equation was generated.
3 RESULT AND DISCUSSION
Ethanol was chosen as a solvent because it is a
universal solvent that can attract polar and non-polar
compounds. Ethanol is also selected because
eugenol has good solubility in alcohols (O’Neil and
Budavari, 2001). Digestion method was selected
because heating and stirring can reduce the
viscosity, therefore increasing the dissolution of
insolvent chemical content. The viscous extract
obtained was thick, blackish brown, had distinctive
smell and weighing 137 gr with a yield percentage
of 16.407%.
The advantages of TLC were easy to use,
relatively fast, and simple. The selection of mobile
phase for TLC was based on the polarity of the
compound. The mobile phase that was used is a
mixture of some organic solvents because the
elusions can be adjusted so that separation can be
optimal. In this study, eugenol is a nonpolar
tendency compound so that the mobile phase used
was a mixture of n-hexane and ethyl acetate (4:1
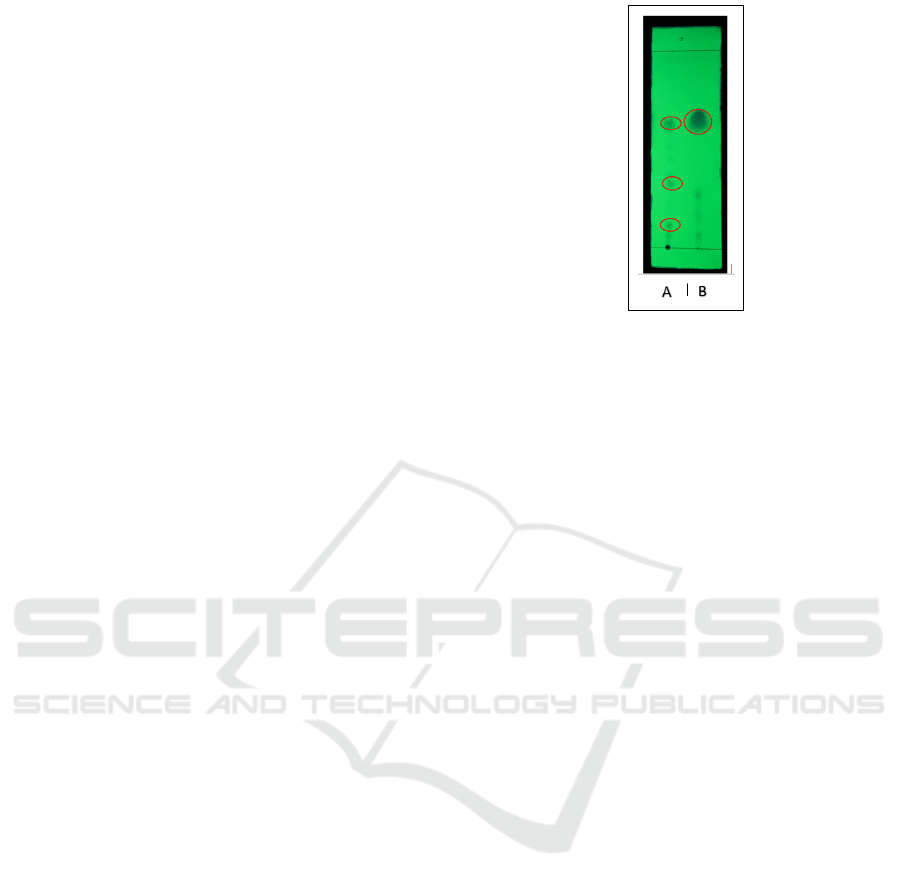
v/v) (Yugatama et al., 2017). Based on TLC result, it
can be seen that Rf value of standard eugenol was
0.662 (spot B) and Rf value of sample was 0.650
(spot A). The result of the quantification test can be
seen in Figure 1.
Ointment formulation was selected because it
allows longer contact with skin than other topical
preparation so that the release of the active
compound will be maximal. In addition, the ethanol
extract of galangal rhizome can be dissolved in the
suitable ointment base. The base of ointment used in
this study is hydrocarbon type. The base of this
ointment has properties that are difficult to be
washed by water so that contact with the skin will
last longer and does not allow evaporation into the
air. The fat base is an occlusive cover so it can
hydrate the skin (Khar et al., 2013). The ointment
was prepared by melting method; some of the
ingredients were mixed by way of melting and
cooled by constant stirring until they solidified
(Allen, 2014). The obtained ointment has a rather
dense, brownish shape and has distinctive odor.
Figure 1: Qualitative test of eugenol in ethanol extract
galangal rhizome (A) extract (B) eugenol standard.
MICH-PhD 2018 - 1st Muhammadiyah International Conference on Health and Pharmaceutical Development
92
Measurements of the maximum wavelength are
performed because it has maximum sensitivity. The
result of spectra obtained shows there are 3 peaks.
The existence of several peaks is due to ethanol
solvent effect with 205 nm UV cut-off 205 nm, so
that the absorption peak of maximum wavelength
eugenol that is at 282 nm.
The separation process of the analyte from the
sample (ointment base) can be broken down by
adding a chemical compound. This process is
intended for analysis of the analyte so it is not
disturbed by the existence of the sample matrix. In
this study, we used a strong base KOH 0.8 N to
break down the sample matrix, which would change
the eugenol into its salt form that can dissolve in
water. Eugenol has phenolic properties that are
highly influential in color change because phenols
are reactive to air and bases. The reaction will occur
when the phenol is in contact with air, strong bases
and heat, are oxidation reactions where phenol binds
the oxygen causing the change of color.
The process of breaking down the sample matrix
needs to be assisted by heating and stirring which
aims to accelerate and maximize the process (Putri
et al., 2014). The addition of KOH to the sample
will form two parts: K-eugenolate (water layer) and
other organic compounds. The KOH (strong base)
will react with phenol so that it will form its salt (K-
eugenolate). The soluble phenol (water layer) was
added with chloroform to attract any impurities that
may exist at the time of separation. It then formed
two layers (water layer and chloroform layer) that
was then separated and the water layer was taken.
To eliminate the phenol from the salt, H
2
SO
4
5 N
was added to neutralize the remaining base. It was
intended to regain the analytes in the whole
molecule (eugenol) (Daryono, 2015; Fitri and
Kawira, 2006). Then, Liquid-liquid extraction (LLE)
was performed by partition using separating funnel
with chloroform as non-mixing solvent. The
selection of chloroform is based on the principle of
‘like dissolve like’ where the nonpolar eugenol tend
to be soluble in chloroform. The selection of the
separation funnel method was due to the ease of
separating the compound between the two non-
interfering solvents. Small droplets of the solvent
will create a larger surface area so that it will
accelerate the equilibrium of the solute between the
two solvents. The solvent obtained from the
extraction (chlorophorm phase) is evaporated. The
resulting eugenol was subsequently dissolved in
ethanol.
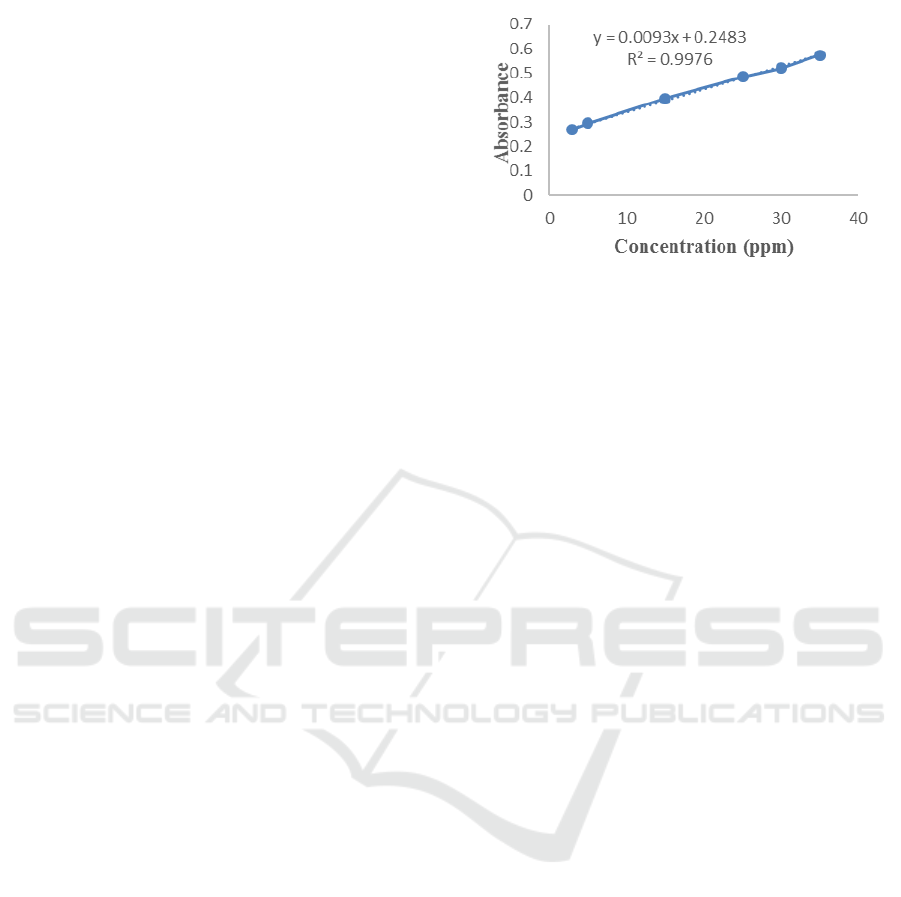
Linearity test is necessary because in this area we
will get the correct validation method of an analyte.
The curve between absorbance and concentrations is
linear because there is an increase in concentration
value followed by an increase in absorbance value.
At 282 nm wavelengths a linear range of
concentrations of 3-35 ppm yields a linear equation
y = 0.0093x + 0.2483 with R2 = 0.9976. According
to ICH, the requirement of linearity is when the
coefficient of determination (r
2
) ≥ 0.997 (Chan et al.,
2004). Calibration curve of eugenol can be seen in
Figure 2.
Precision is a measure that indicates the
suitability of individual test results as measured by
the average outcome distribution if the procedure is
repeatedly defined. In this study, the measurements
at concentrations of 5, 15, 25, 30 and 35 ppm in each
replication were then calculated to achieve the
standard deviation and relative standard deviation.
The variations that appear in precision results can be
caused by various factors that are difficult to control
such as disturbance and different conditions of each
measurement. The precision result of the analytical
method is described in Table 2.
In this accuracy test, standard addition method
was used where a number of known standard
solutions of concentration are added to the sample
and then analyzed. The selection of standard
solution series concentrations used in accuracy test
is based on the results of calibration curve that has
met the range and linearity. Given the addition of
standard eugenol series to sample, at 282 nm there
will be a significant increase in absorbance value.
The result obtained from the calculation of %
recovery is 98.195%.
Figure 2: Calibration curve of eugenol.
Analysis of Eugenol Content in Ethanolic Extract of Galangal Rhizome (Alpinia galanga L. Willd) Ointment Using UV-VIS
Spectrophotometry Method
93

The method that we used in this study to
determine LOD and LOQ is calculation. From the
result of linear equation y = 0.0093x + 0.2483, we
can calculate LOD value and LOQ value based on
standard deviation and slope of a standard curve
obtained. From the statistical calculation using the
standard curve equation, the LOD value that was
obtained was 2.388 μg/mL and LOQ value 7.235
μg/mL.
The determination of eugenol content in the
sample uses standard method addition. This method
is done by adding the standard eugenol to the
sample. The sample absorbance of 0 ppm (without
the standard addition) is plotted to the calibration
curve (Fig. 3). The results obtained from the
calculation of eugenol content in the ointment of
ethanol extracted from galangal rhizome with
accuracy 98.195% is 5.093 mg/g, so that the actual
eugenol content in the ointment extract of galangal
rhizome ethanol is 5.187 mg/g.
4 CONCLUSIONS
The study shows that the UV-Vis
spectrophotometric method is a good method for
analyzing eugenol in the ointment of ethanolic
extract of galangal rhizome with validation
parameters occupied the requirements. From the
result, we know that the content of eugenol in
ointment ethanolic extract of galangal rhizome is
5.187 mg/g.
ACKNOWLEDGEMENTS
We are thankful to Sebelas Maret University for the
financial support.
REFERENCES
Allen, L., 2014. Ansel’s Pharmaceutical Dosage Forms
and Drug Delivery Systems. Lippincott Williams &
Wilkins.
Chan, C.C., Lee, Y.C., Lam, H., Zhang, X.-M., 2004.
Analytical Method Validation and Instrument
Performance Verification. John Wiley & Sons.
Daryono, E.D., 2015. Reactive extraction process in
isolation of eugenol of clove essential oil (Syzigium
aromaticum) based on temperature and time process 8,
564–569.
Fitri, N., Kawira, J.A., 2006. Perbandingan Variabel Pada
Isolasi Dan Pemurnian Eugenol Dari Minyak Daun
Cengkeh. Media Penelit. Dan Pengemb. Kesehat. 16.
https://doi.org/10.22435/mpk.v16i2 Jun.895.
Khar, R.K., Khar, R.K., Vyas, S.P., Ahmad, F.J., 2013.
The Theory and Practice of Industrial Pharmacy:
Lachman/Lieberman’s. CBS Publishers &distributors.
Magalhães, C.B., Casquilho, N.V., Machado, M.N., Riva,
D.R., Travassos, L.H., Leal-Cardoso, J.H., Fortunato,
R.S., Faffe, D.S., Zin, W.A., 2018. The anti-
inflammatory and anti-oxidative actions of eugenol
improve lipopolysaccharide-induced lung injury.
Respir. Physiol. Neurobiol.
https://doi.org/10.1016/j.resp.2018.07.001
O’Neil, Budavari, S., 2001. The Merck Index: An
Encyclopedia of Chemicals, Drugs, and Biologicals.
Wiley.
Park, S.-H., Sim, Y.-B., Lee, J.-K., Kim, S.-M., Kang, Y.-
J., Jung, J.-S., Suh, H.-W., 2011. The analgesic effects
and mechanisms of orally administered eugenol. Arch.
Pharm. Res. 34, 501–507.
https://doi.org/10.1007/s12272-011-0320-z
Putri, R.L., Hidayat, N., Rahmah, N.L., 2014. Pemurnian
Eugenol Dari Minyak Daun Cengkeh Dengan Reaktan
Basa Kuat KOH Dan Ba(OH)
2
(Kajian Konsentrasi
Reaktan). J. Ind. 3, 1–12.
Shelke, U.Y., Mahajan, A.A., 2015. Review on: an
Ointment. ijppr 4, 170–192.
Tang, X., Xu, C., Yagiz, Y., Simonne, A., Marshall, M.R.,
2018. Phytochemical profiles, and antimicrobial and
antioxidant activities of greater galangal [Alpinia
galanga (Linn.) Swartz.] flowers. Food Chem. 255,
Table 2: Repeatability and intermediate precision of UV-Vis spectrophotometry method.
C
(µg/mL)
Repeatability (n=4) Intermediate precision (n=4)
Mean Absorbance±SD %RSD Mean Absorbance±SD %RSD
5 0,295±0,0019 0,639 0,297±0,0026 0,864
15 0,395±0,0026 0,646 0,399±0,0051 1,282
25 0,478±0,0054 1,130 0,481±0,0085 1,763
30 0,524±0,0024 0,466 0,525±0,0034 0,649
35 0,571±0,0033 0,586 0,573±0,0041 0,715
MICH-PhD 2018 - 1st Muhammadiyah International Conference on Health and Pharmaceutical Development
94

300–308.
https://doi.org/10.1016/j.foodchem.2018.02.027
Xie, Y., Yang, Z., Cao, D., Rong, F., Ding, H., Zhang, D.,
2015. Antitermitic and antifungal activities of eugenol
and its congeners from the flower buds of Syzgium
aromaticum (clove). Ind. Crops Prod. 77, 780–786.
https://doi.org/10.1016/j.indcrop.2015.09.044
Yugatama, A., Ardiyati, N.W., Yulianti, I., 2017.
Optimation of Ethanol Concentration in Extraction of
Eugenol from Galangal Rhizome. Asian J. Pharm.
Clin. Res. 10, 18–20.
https://doi.org/10.22159/ajpcr.2017.v10s2.19474
Zhang, Y., Wang, Y., Zhu, X., Cao, P., Wei, S., Lu, Y.,
2017. Antibacterial and antibiofilm activities of
eugenol from essential oil of Syzygium aromaticum
(L.) Merr. & L. M. Perry (clove) leaf against
periodontal pathogen Porphyromonas gingivalis.
Microb. Pathog. 113, 396–402.
https://doi.org/10.1016/j.micpath.2017.10.054
Analysis of Eugenol Content in Ethanolic Extract of Galangal Rhizome (Alpinia galanga L. Willd) Ointment Using UV-VIS
Spectrophotometry Method
95
