
Spatial Distribution of Potentially Toxic Trace Elements in Soils
Downstream of a Lead–Zinc Mine in Southern China
Pengwei Qiao
1
, Sucai Yang
1*
, Nan Dong
2
, Mei Lei
3
and Yanjun Cheng
1
1
Beijing key Laboratory of Remediation of industrial Pollution Sites, Environmental Protection Research Institute of Light
Industry, Beijing 100089, China.
2
Comprehensive Institute of Geotechnical Investigation and Surveying, Ltd., Beijing 100007, China.
3
Institute of Geographic Sciences and Natural Resources Research, Chinese, Beijing 100101, China.
Keywords: Soil contamination, Potentially toxic trace elements (PTEs), Risk evaluation, Spatial variability
Abstract: Spatial distribution of potentially toxic trace elements (PTEs) concentrations in soils is essential for pollution
and risk evaluation. In this study, 33 samples were collected downstream of a lead–zinc mine in Southern
China. Contamination factors (CFs) of As, Pb, Zn, Cu, Cr, and Ni were all near 1 (low contamination), while
12% of the sample sites showed high contamination of Cd (CF>6). The highest concentration of Cd was about
40× natural background value of study area. Variogram analysis allowed detecting the principal direction of
variation. High soil pH value and rocks could prevent PTEs vertical migrating in the mountain. The spatial
distribution of Zn and Cu may be resulted from lateral transportation with soil erosion.
1 INTRODUCTION
Potentially toxic trace elements (PTEs) in soils have
negative effects on environment and food quality
(Song et al., 2009; Liu et al., 2015), and may threaten
human health (Chen et al., 2005; Salehipour et al.,
2015; Praveena et al., 2015). Spatial distribution of
PTEs is important for evaluation of contamination
level.
There are many occurrence elements in Pb-Zn
mine, such as Cd (Hosseini-Dinani et al., 2015; Ye et
al., 2016). These elements have potential hazards for
environment. Therefore, assessment contamination
level of PTEs in Pb-Zn mine is necessary.
In addition, the study area is located in the
downstream of Pb-Zn mine in southern China, which
is near residence community. Therefore, assessment
contamination level in this region is important.
However, the exist researches mainly been conducted
in upstream regions that are heavily polluted (Zhang
et al., 2013), while few studies about downstream
areas have been conducted.
The objectives of this paper were to: (1) assess
contamination degree of PTEs, (2) analyse spatial
distribution of PETs downstream a Pb-Zn mine.
2 MATERIALS AND METHODS
2.1 Study Area
The study area lies in Huanjiang County in southern
China. Study area is located downstream of a lead–
zinc mine with an area about 300 km2, where was
polluted by a tailing dam break in 2001. This region
was contaminated by PTEs, such as As, Pb, Cd, Cu,
Cr, Ni, Zn. Mountains with calcareous soil are located
in the east of the study area, while the west is
relatively flat with red soil. The land use types include
farmland, forests, orchards and grasslands. Forests
are mainly distributed in the eastern mountains
(Figure 1). After the tailing dam broke, the flood level
reached about 123 m above the Huanjiang River
surface, while low-lying areas in the west were
submerged.
260
Qiao, P., Yang, S., Dong, N., Lei, M. and Cheng, Y.
Spatial Distribution of Potentially Toxic Trace Elements in Soils Downstream of a Lead–Zinc Mine in Southern China.
DOI: 10.5220/0008188502600263
In The Second International Conference on Materials Chemistry and Environmental Protection (MEEP 2018), pages 260-263
ISBN: 978-989-758-360-5
Copyright
c
2019 by SCITEPRESS – Science and Technology Publications, Lda. All rights reserved
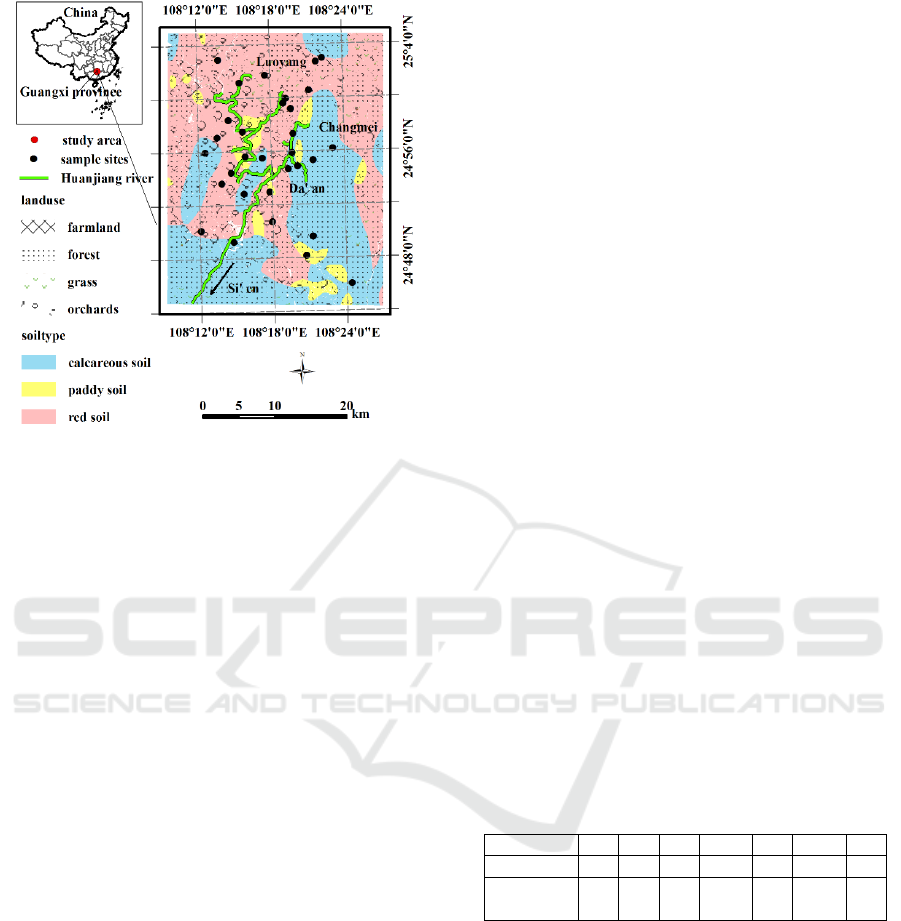
Figure 1: Soil sample locations.
2.2 Sampling and Chemical Analysis
Approximately 33 topsoil samples (0–20 cm) were
collected from the study area (Figure 1). Of these, 11
samples were from forest areas with calcareous soil,
while 19 samples were from orchard areas with red
soil, and 3 samples were from orchard areas, where
were underlain by paddy soil.
Soil samples were air-dried and ground to be able
to pass through a 100-mesh sieve. And then they were
digested with HNO3 and H2O2, and added HCl
adapting to the follow-up instrument according to
USEPA (United States Environmental Protection
Agency) Method 3050B (1996). The concentrations
of As were determined by atomic fluorescence
spectroscopy (HG-AFS, AFS-9800, Haiguang
Instrumental CO., China), whereas Pb, Cd, Cu, Zn,
Ni, and Cr were determined by inductively coupled
plasma optical emission spectrometry (ICP-OES,
Optima 5300DV, PerkinElmer, USA). Samples of
certified standard reference materials for soil (GSS-
2) were obtained from the Chinese National Standard
Material Centre, which was used for quality control.
Soil pH values were determined in solution using a
portable pH meter (Orion Model 868 pH).
2.3 Data Processing Methods
Theoretical variogram models were fitted by GS+
(version 9). Spatial distribution maps of PETs were
produced by ArcMap (version 9.3) and ArcScene
(version 9.3). Contamination level graphic of PTEs
was produced by Origin (version 8).
In addition, the contamination level of PTEs is
expressed in terms of contamination factor (CF),
which is the common evaluation method in many
existing literatures (Hakanson, 1980; Liu et al., 2005).
The assessment results of CF are trustworthy. The
greater the CF value, the more serious pollution of
PTEs in soils.
CF=C
m
Sample/ C
m
Standard (1)
CmSample is the PTEs concentration (mg/kg) of
sample, and CmStandard is the Environmental Class
2 Standard (mg/kg). CF<1 refers to low
contamination; 1≤CF<3 indicates moderate
contamination; 3≤CF≤6 indicates considerable
contamination; and CF>6 indicates very high
contamination (Mmolawa et al., 2011).
3 RESULTS AND DISCUSSION
3.1 Degree of PTEs Contamination in
Soils
The concentrations of Cd ranged from 0.28 mg/kg to
3.22 mg/kg, with a geometric mean of 0.80 mg/kg.
CVs of all PTEs were all less than 13%, indicating
weak variability. For all samples, the exceeding
standard rate of As, Pb, Cd, Zn and Ni was 3%, 45%,
97%, 15% and 24% respectively. The standard value
refer to Class 2, environmental quality standard for
soils (GB15618-1995), which is a national standard
of People's Republic of China.
Table 1: Standard concentration (mg/kg) of PTEs.
Metals
As
Pb
Cd
Cr
Cu
Zn
Ni
Class 2
30
300
0.3
200
100
250
50
Natural
background
15.7
18.9
0.08
67.5
17.3
42.6
9.81
Based on CF, only Cd reached high contamination
level, 12% of sample sites showing very high
contamination, 24% with considerable contamination
and 60% with moderate contamination. Low
contamination levels of As, Pb, Zn, Cr, Cu and Ni
were observed (Figure 2). This reflected that, Cd was
the most important contaminant downstream of a Pb–
Zn mining facility. These results were accordance
with previous study (Wang et al., 2009). This
phenomenon could be interpreted that, Cd was the
occurrence trace element and was enriched
surrounding Pb-Zn mine (Ye et al., 2016).
Spatial Distribution of Potentially Toxic Trace Elements in Soils Downstream of a Lead–Zinc Mine in Southern China
261
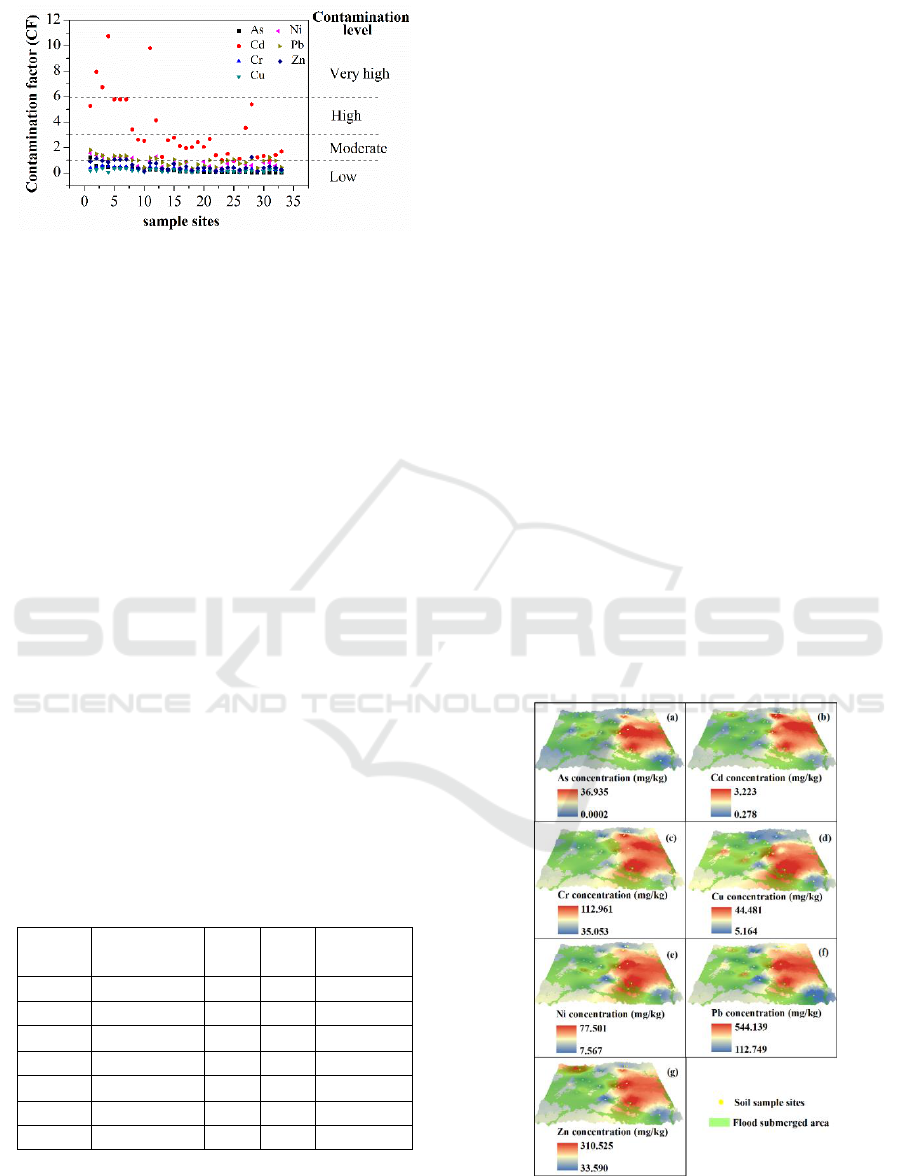
Figure 2: Contamination factors of As, Cd, Ni, Pb and Zn
concentration for the 33 sites studied.
According to the natural background value of
Huanjiang County (Ban and Ding, 1991) (Table 1),
all the PTEs had accumulated in topsoils. These PTEs
may result from the tailing dam broke, but also may
result from irrigation with the water from Huanjiang
River. Concentrations of PTEs in the branches of
Huanjiang river were as follows: As (0.015 mg/L), Cd
(0.002 mg/L), Cr (0.058 mg/L), Cu (0.024 mg/L), Ni
(0.037 mg/L), Pb (0.040 mg/L), Zn (0.606 mg/L).
These values were all near the standard for domestic
drinking water quality (GB5749-85). But use of water
containing PTEs at this levels could result in their
accumulation in soils.
3.2 Spatial Distribution of PTEs
Spatial distribution characteristic was expressed by
variogram models fitted by GS+ software. The best-
fit theoretical models were selected based on the
highest decision coefficient value (r2), while the ratio
of nugget to sill (RNS) reflected the degree of spatial
dependence. Principal direction was the spatial
distribution trend of PTEs (Table 2).
Table 2: Theoretical variogram models and their fitting
effect for PTEs.
Metals
Model
RNS
R
2
Principal
Direction
As
Gaussian
0.05
0.96
E-W
Pb
Gaussian
2.95
0.82
E-W
Cd
Exponential
24.0
0.97
E-W
Cr
Spherical
21.3
0.91
E-W
Cu
Exponential
6.12
0.90
E-W
Zn
Gaussian
0.50
0.98
NW-SE
Ni
Gaussian
25.7
0.85
E-W
Semivariances of Cd and Cu were best fit with
exponential model, while As, Pb, Ni, and Zn were
best fit with Gaussian model and Cr with Spherical
model. RNS for Ni was between 25% and 75%,
reflecting moderate spatial dependence, while for As,
Pb, Cd, Cr, Cu and Zn were all less than 25%,
showing strong spatial dependence. The principal
direction of variation of Zn was NW–SE, while that
of the other PTEs were E–W. The principal direction
of pH value was E–W, with high pH value on the west
(Figure 3).
The regions with higher concentrations of As, Pb,
Cd, Cr, Ni were mainly in higher terrain area, where
with calcareous soil, and higher pH value. These
areas were not flooded (Figure 3). This might because
that, higher pH value decreased the vertical migration
ability of PTEs, while rocks on the mountain also
could prevent the transportation of PTEs.
Additionally, lower pH value in relatively flat regions
in the west likely increased PTEs bioavailability,
enabling plants to absorb the PTEs, reducing
concentrations of PTEs in soils. Furthermore,
calcareous soil on the mountain has a high
background value. this phenomenon was accordance
with the conclusion of (Ban and Ding, 1991) and
(Wang et al., 2005), the difference between
concentrations of PTEs in soil parents is significant.
Higher concentrations of Zn were observed in the
north and northwest, that was parallel to the direction
of the Huanjiang River flow. Overall, concentrations
of PTEs were relatively high in the downstream
region, which could be explained by lateral migration
and accumulation downstream (Qiao et al., 2014).
Figure 3: Spatial distribution of seven PTEs.
MEEP 2018 - The Second International Conference on Materials Chemistry and Environmental Protection
262

4 CONCLUSIONS
Overall, low contamination levels of As, Cu, Cr, Zn,
Ni were observed in the study area, while Pb and Cd
were present at considerable contamination levels.
However, based on natural background values of
study area, all PTEs had an accumulation trend in
soils. Spatial anisotropy of the seven PTEs was
significant, with the principal direction of variation of
As, Pb, Cd, Cr, and Ni being E–W and that of Zn and
Cu being NW–SE. Spatial anisotropy of As, Pb, Cd,
Cr and Ni were in accordance with the spatial
distribution of soil type and pH value. Higher pH
values and rocks on the mountain could prevent
vertical migration of PTEs. Lower pH value in the flat
regions could increase transportation of PTEs. Spatial
distribution of Zn and Cu may result from lateral
transportation by soil erosion.
ACKNOWLEDGEMENTS
This work was supported by Beijing Postdoctoral
Research Foundation, and the postdoctoral program
set up by Beijing Key Laboratory of Remediation of
Industrial Pollution Sites, Environmental Protection
Research Institute of Light Industry, Beijing, China,
Uncertainty Analysis and Cause Analysis of Spatial
Distribution of Soil Pollution.
REFERENCES
Ban, L., Ding, Y.F., 1991. Research method of soil
background value and soil background value in
Guangxi. Scientific research academy of Guangxi
environmental protection, China.
Chen, T.B., Zheng, Y.M., Lei, M., Huang, Z.C., 2005.
Assessment of heavy metal pollution in surface soils of
urban parks in Beijing, China. Chemosphere, 60(4):
542-551.
Hakanson L., 1980. An ecological risk index for aquatic
pollution control A sedimentological approach. Water
Res, 14:975–1001.
Hosseini-Dinani, H., Aftabi, A., Esmaeili, A., et al. 2015.
Composite soil-geochemical halos delineating
carbonate-hosted zinc-lead-barium mineralization in
the Irankuh district, Isfahan, west-central Iran. Journal
of Geochemical Exploration, 156:114-130.
Liu, Q., Liu, J., Wang, Q.C., Wang, Y., 2015. Assessment
of Heavy Metal Pollution in Urban Agricultural Soils
of Jilin City, China. Human and Ecological Risk
Assessment, 21(7): 1869-1883.
Liu, W.H., Zhao, J.Z., Ouyang, Z.Y., Sὃderlund, L., Liu,
G.H, 2005. Impacts of sewage irrigation on heavy
metal distribution and contamination in Beijing, China.
Environment International, 31: 805-812.
Mmolawa, K.B., Likuku, A.S., Gaboutloeloe, G.K. 2011.
Assessment of heavy metal pollution in soils along
major roadside areas in Botswana. African Journal of
Environmental Science and Technology, 5(3): 186-196.
Praveena, S.M., Pradhan, B., Ismail, S.N.S. 2015. Spatial
Assessment of Heavy Metals in Surface Soil from
Klang District (Malaysia): An Example from a Tropical
Environment. Human and Ecological Risk Assessment,
21(7): 1980-2003.
Qiao, P.W., Zhou, X.Y., Yang, J., Chen, T.B., Lei, M. 2014.
Simulation of lateral migration of heavy metal in
Huanjiang watershed,Guangxi province of China.
Legislation, Technology and Practice of Mine Land
reclamation, Beijing, China: 443-446.
Salehipour, M., Ghorbani, H., Kheirabadi, H., Afyuni, M.
2015. Health Risks from Heavy Metals via
Consumption of Cereals and Vegetables in Isfahan
Province, Iran. Human and Ecological Risk
Assessment, 21(7): 1920-1935.
Song, B., Lei, M., Chen, T.B., Zheng, Y.M. 2009.
Assessing the health risk of heavy metals in vegetables
to the general population in Beijing, China. Journal of
Environmental Sciences, 21(12): 1702-1709.
USEPA. Method 3050B. 1996. Acid digestion of
sediments, sludges and soils. United States
Environmental Protection Agency.
Wang, D.D., Song, S.S., Lan, W.Y., Fan, Y.H. 2009.
Characteristics of heavy metals pollution in soils along
riverside of Huanjiang river. Guangxi Agricultural
Sciences, 40(3): 280-283(in Chinese).
Wang, X.S., Qin, Y., Sang, S.X. 2005. Accumulation and
sources of heavy metals in urban topsoils: a case study
from the city of Xuzhou, China. Environmental
Geology, 48(1): 101-107.
Ye, L., Li, Z.L., Hu, Y.S., Huang, Z.L., et al. 2016. Trace
elements in sulfide from the Tianbaoshan Pb-Zn
deposit, Sichuan Province, China: A LA-ICPMS study.
Aata Petrologica Sinica, 32(11): 3377-3393.
Zhang, C., Li, Z., Yang, W., Pan, L., et al. 2013.
Assessment of metals pollution on agricultural soil
surrounding a lead-zinc mining area in the Karst region
of Guangxi, China. Bull Environ Contam Toxicol,
90(6): 736-741.
Spatial Distribution of Potentially Toxic Trace Elements in Soils Downstream of a Lead–Zinc Mine in Southern China
263
