
A Soft-sencor and Parameter Optimization for Predicting Inulinase
Concentration at Recombinant Pichia Pastoris Fermentation Process
Qingqiang Guo
1
, Yingjia Zhang
1
, Yuxi Deng
1
and Xiuhong Wang
2*
1
School of Control science and engineering, Shandong University, Jinan 250061, China
2
Department of Electronic, Shandong College of Electronic Technology, Jinan 250061, China
Keywords: inulinase concentration, support vector machine, leave one out algorithm, particle swarm optimization
Abstract: Based on the least square support vector machine regression, a model is established to predict the inulinase
concentration during Pichia pastoris fermentation process, which is more suitable for the situation in which
there are more types but less numbers of input variables. To realize parameter optimization, leave one out
algorithm and particle swarm optimization algorithm are combined to recognize the model. Leave one out
algorithm is used as the target function to minimize the error of cross validation, and particle swarm
optimization algorithm is used to search the best parameters. The experimental results show that the
proposed model has better prediction accuracy than the soft-sensor based on standard support vector
machine. In addition, the proposed parameter optimization method can improve the prediction accuracy
significantly.
1 INTRODUCTION
Fructooligosaccharides has been widely used in
dietary supplements because it has many advantages,
such as indigestibility, caries resistance, improving
lipid metabolism and so on. One of the important
way to producing fructooligosaccharides is
hydrolysising inulin with endoinulinase that
obtained by Pichia pastoris (Zhang et al., 2004).
Pichia pastoris fermentation process involves many
important biochemical variables, which include
yeast concentration, methanol concentration and
inulinase activity concentration. According to many
type of input variables and little amount of samples,
it is difficult to set up the model of fermentation
process. The inulinase concentration still relies on
the offline analysis of enzyme activities, which not
only consumes lots of manpower and resources, but
also affects the implementation of real-time control
strategy and improvement of fermentation
technique.
Soft sensing is one of the effective ways to solve
the above measurement problem. Soft-sensor based
on Support Vector Machine (SVM) is more suitable
for the situation in which there are more types but
less numbers of input variables (Bogaerts and
Wouwer, 2003), since it uses a particular method to
compress process data information and extract the
feature of data to establish the relationship between
the dominant and auxiliary variables (Cortes and
Vapnik, 1995). Suykens proposed Least Squares
Support Vector Machines (LS-SVM), which not
only reduces the computational complexity, but also
accelerates the speed (Suykens and Vandewalle,
1999).
To optimize the kernel parameters setting for
SVM, Grid Search (GS) is done by minimizing some
estimates of the generalization error of SVM
(Chapelle et al., 2002). Huang presented a Genetic
Algorithm (GA) approach for feature selection and
parameters optimization (Huang and Wang, 2006).
Lin used Particle Swarm Optimization algorithm
(PSO) for parameter determination and feature
selection (Lin et al., 2008). Xi used Leave One Out
(LOO) method to cross validate the feature selection
result (Xi et al., 2016). While these methods deal
with offline data get good result, the balance
between speed and accuracy should be considered
when they are used in real-time control.
According to the character of our problem, a LS-
SVM based soft-sensor established to estimate and
predict inulinase concentration in the Pichia pastoris
fermentation process, which was difficult to be
measured online. Considering LS-SVM parameters
have important influence on the properties of the
14
Guo, Q., Zhang, Y., Deng, Y. and Wang, X.
A Soft-sencor and Parameter Optimization for Predicting Inulinase Concentration at Recombinant Pichia Pastoris Fermentation Process.
DOI: 10.5220/0008184700140018
In The Second International Conference on Materials Chemistry and Environmental Protection (MEEP 2018), pages 14-18
ISBN: 978-989-758-360-5
Copyright
c
2019 by SCITEPRESS – Science and Technology Publications, Lda. All rights reserved
soft-sensor, this paper present a LOO-PSO method
to realize parameter optimization.
2 EXPERIMENTAL MATERIALS
AND METHODS
2.1 Strains and Plasmids
In this experiment, inulin INU2 gene was cloned
from Aspergillus oryzae, which was constructed on
plasmids pPIC9K. The recombinant plasmid was
linearized to Pichia pastoris GS115, and the
expression of Inulinase INU2 was induced by
methanol. It is from China's general microbiological
preservation management center, pPIC9K vector and
GS115 pichia pastoris are all from national key
laboratory of microbiology technology.
2.2 Offline Measurement of Inulinase
Concentration
In this paper, the concentration of inulinase in
reaction solution was measured by Bradford method.
The linear fitting results of OD595 absorbance and
protein concentration were obtained from protein
standard solution:
2
0.0012 0.076
0.9982
yx
r
(1)
Here,
y
represents light absorption value of
protein standard liquid OD595,
x
represents protein
concentration,
2
r
represents goodness of fitting.
3 LS-SVM BASED SOFT-SENSOR
3.1 The Establishment of LS-SVM
Based Soft-sensor
LS-SVM regression soft-sensor is data-driven, the
number and quality of training samples will
significantly affect the model's estimation ability and
generalization ability. Online measurement variables
include fermentation time (h), dissolved oxygen
concentration (%), inlet flow rate (L/h), stirring
speed (r/min), pH, temperature (℃), methanol flow
speed ratio (L/h), ammonia flow speed ratio (L/h)
and the product of reaction liquid (L), off-line
measuring variables include methanol concentration
(g/L), pichia concentration (g/L) and inulin enzyme
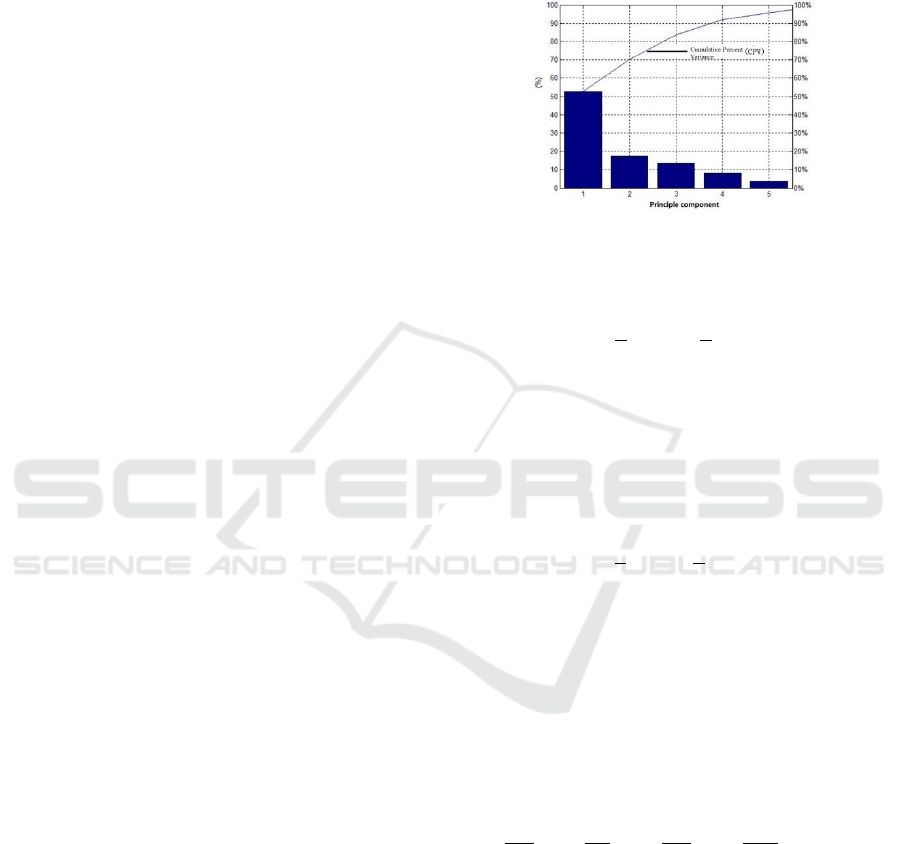
concentration (g/L). After principal component
analysis, the contribution rate of each principal
component can be obtained, as shown in Figure 1.
When the number of principal elements is 4,
Cumulative Percent Variance (CPV) is more than
90%, so the input principal elements of soft
measurement model are finally determined to be 4.
Figure 1: Score of principal components.
In LS-SVM regression estimation, optimization
problem can be expressed as equation (2) :
22
1
1
min ( , ) || ||
22
. . ( ) , 1,2 ...,
,
l
i
i
T
i i i
c
J
st y b i l
w ξ w
wx
(2)
In this formula,
1
l
w
is the weight vector of
the feature space,
1
l
ξ
is the relaxation vector, c
is the penalty coefficient, and b is the bias constant.
On the basis of formula (2), the Lagrange
function is constructed, as shown in formula (3).
22
1
1
1
min ( , ) || ||
22
( ( ) )
. . ( ) , 1,2 ...,
,
l
i
i
l
T
i i i i
i
T
i i i
c
L
by
s t y b i l
w ξ w
wx
wx
(3)
In this formula,
i
is the Lagrange multiplier.
Under the optimal conditions, the saddle point of
the Lagrange function satisfies the partial derivative
of the parameter
w
,
b
,
i
,
*
i
is equal to zero, as is
shown in formula (4).
*
0, 0, 0, 0
ii
L L L L
b
w
(4)
Further formula (5) can be obtained from
formula (4).
*
1
*
1
**
( ) ( )
( ) 0
0
0
l
i i i
i
l
ii
i
ii
ii
c
c
wx
1,2,...,il
.
(5)
Expected value
A Soft-sencor and Parameter Optimization for Predicting Inulinase Concentration at Recombinant Pichia Pastoris Fermentation Process
15

On the basis of the Mercer condition, the kernel
function is shown in formula (6).
( , ) ( ) ( ) 1,2,...
T
ii
K i lx x x x
(6)
1 1 1
11
1
0
0
1
1 ( , ) ( , )
1
1 ( , ) ( , )
1 1
l
ll
l l l
b
KK
y
c
y
KK
c
x x x x
x x x x
(7)
According to the definition of formula (5) (6)
and kernel function, the optimization problem can be
expressed as formula (7).
The sum can be obtained by solving the above
linear equations. The final decision function of LS-
SVM is shown in formula (8).
1
( ) ( , )
l
j i j i
i
f K b
x x x
(8)
It can also be expressed as formula (9) :
2
2
1
|| ||
( ) exp( )
2
l
ij
ji
i
fb
xx
x
(9)
In this formula,
represents the width of the
kernel function.
3.2 Soft-sensor Parameter
Optimization
It can be seen from the expression of soft-sensor that
penalty coefficient c and width coefficient of kernel
function
2
are parameters that need to be
optimized. The penalty coefficient c reflects
punishment degree of the model to sample data
beyond the range of insensitive loss. The width
coefficient of kernel function
2
reflects the degree
of correlation between support vectors. When c is
too small or
2
is too large, the model is relatively
simple, but the model precision is insufficient, and
the training error is large. On the contrary, the value
of c is too large or
2
is too small, the model
precision is high, but the model structure is too
complex, and the generalization ability drops.
LOO is a concrete realization method of cross
validation thought, the number of subsets with
training was set equals the number of training
samples, where each instance with a sample test, all
the remaining samples as training set. LOO, based
on the generalization error estimation theorem, has
been proved in theory to be an unbiased estimate of
the true error rate.
The given training set
{( , ), 1,2,..., }
ii
y i lx
,
l
represents the number of training samples.
The error estimation of the generalization ability
of this regression problem by LOO can be expressed
as formula (10).
1
1
( , ( ))
l
li
ii
i
E L y f
l
x
(10)
In this formula,
()
li
i
f x
represents the decision
function obtained by training with the remaining
training set after removing the i training sample;
( , ( ))
li
ii
L y f x
is the loss function.
Specific parameter optimization procedures are
as follows:
1) Initialize population size N and selection
times E of particle swarm optimization algorithm.
For the LS-SVM parameter pair (
c
,
2
) to be
optimized, N particles are generated within its
constraint range and the position and velocity values
of each particles are initialized.
2) Randomly select one sample from the sample
training set
{( , ), 1,2,..., }
ii
y i lx
as the test set and
the rest as training set.
3) The LS-SVM regression soft-sensor of
particle and training set was selected to obtain the
prediction model of inulinase concentration
1,1
(x)f
(subscript represents particle label and test sample
label respectively). Use
1,1
(x)f
to forecast the
sample data and get the prediction error
1,1
E
.
4) Repeat steps 2 and 3 to get a total of l
prediction errors
1,
( 1,2,..., )
i
E i l
. Combined with
formula (10), one method of cross validation error of
particles can be obtained, as is shown in
formula(11).
1 1, 1,1
11
11
| ( )|
ll
i i i
ii
E E y - f
ll
x
(11)
In addition, the fitness function of the particle
1
A
is
11
()F A E
.
5) For other particles
( 2,3,... )
j
A j N
, repeat
steps 2 to 4 to get the corresponding fitness function
value
()
j
FA
.
6) Compare
()
i
FA
with the optimal fitness
function value of the particle itself
()
gbest
FA
, if
( ) ( )
ibest gbest
F A F A
, adjust
( ) ( )
gbest ibest
F A F A
, and
take the current position of the particle as optimal
position of the whole particle group.
7) Compare
()
ibest
FA
with the optimal fitness
function value of the entire particle population
()
gbest
FA
, if
( ) ( )
ibest gbest
F A F A
, adjust
( ) ( )
gbest ibest
F A F A
, and take the optimal position of
MEEP 2018 - The Second International Conference on Materials Chemistry and Environmental Protection
16

particle as the optimal position of the whole particle
group.
8) Adjust the velocity and position of the current
particle according to the velocity adjustment formula
(12) and the position adjustment formula (13).
11
22
( 1) ( ) ( )( ( ) ( ))
( )( ( ) ( ))
i V i ibest i
gbest i
V t w V t c rand t A t A t
c rand t A t A t
(12)
( 1) ( ) ( 1)
i i A i
A t A t w V t
(13)
When the optimal fitness function value of the
whole particle swarm exceed presetting range, or the
optimization algebra reaches predetermined value,
the parameter optimization process will stop, and
output the optimization results of the parameters.
That is the optimal position value of the whole
particle swarm. If not, return to step 2) and continue
the optimization process.
4 ANALYSIS OF
EXPERIMENTAL RESULTS
4.1 Comparison of Parameter
Optimization Results
For GS method is the most widely used method in
the field of SVM parameter optimization (Aazi et
al., 2016). This section mainly compare the GS
method, the PSO algorithm and the LOO-PSO
algorithm parameters optimization effect, to test the
validity of the proposed LOO-PSO algorithm in LS-
SVM regression soft-sensor optimization. According
to experience, the range of parameters to be
optimized is set:
0 10
(2 ,2 )c
,
2 0 10
(2 ,2 )
. In
addition to the above settings, the main parameter of
the GS method is the search step length, which is set
as 0.1 in this paper.
For the parameter optimization process of PSO
and LOO-PSO, it can be seen from the PSO
algorithm formula that the initial parameter value
and its meaning need to be set as shown in Table 1.
In this paper, the Relative Standard Deviation
(RSD) is used to represent the estimation and
prediction error of inulinase concentration, and the
calculation formula is shown in formula (14).
n
i
i
n
i
ii
P
n
PP
n
PRSD
11
2
1
)
ˆ
(
1
)(
(14)
In this formula,
i
P
represents the actual measured
value of inulinase concentration at time i
()gL
, and
ˆ
i
P
represents the predicted value of inulinase
concentration at time i
()gL
.
The optimization time and prediction error of
various algorithms are shown in Table 2. Among
them, the optimization time of PSO and LOO-PSO
algorithm is the time required for the target function
after iterate 300 generations.
Table 1: Parameters of Particle Swarm Optimization.
Parameter names
Parameter
values
Input dimension of objective
function
2
Local search capability parameters
1.5
Global search capability parameters
1.7
Maximum evolutionary algebra
300
Population size
50
The elastic coefficient in the
velocity updating formula
1
The elasticity coefficient in the
population renewal formula
1
Maximum velocity variation of
particle velocity
0.1
Table 2: Comparison of different parameters optimization
methods.
Algorithm
names
(
1c
,
2
)
Running
time(s)
Training
error (%)
Prediction
error (%)
GS
(1024, 1)
283
3.92
11.1
PSO
(1024, 1)
78
3.92
11.1
LOO-PSO
(876.3,
11.6)
84
5.55
5.79
After analysing Table 2, the following two
conclusions can be obtained:
1) The GS method takes a long time, and its
accuracy is limited by the search step length. In the
actual optimization process, it can be seen that if the
step length is too large, it can reduce the running
time of GS, but will reduce the accuracy of the
optimal parameters obtained. If the step size is too
small, the search time will be significantly increased
while the parameter precision is improved. By
contrast, the PSO algorithm is not much different
from the GS method in terms of prediction error, but
the time of parameter optimization is greatly shorter.
Therefore, the PSO method is superior to the
traditional GS method.
2) Comparing the optimization results of the
LOO-PSO method with the previous two methods,
the optimization time of the LOO-PSO method is
between the GS method and the PSO method.
Although the training error is increased, the
prediction ability for the unknown samples is greatly
improved. The above changes are mainly due to the
use of leave one method on the basis of PSO
optimization. In every iteration, l-1 samples are
A Soft-sencor and Parameter Optimization for Predicting Inulinase Concentration at Recombinant Pichia Pastoris Fermentation Process
17

selected from all training samples. The remaining 1
sample is tested, and the average error of the l
prediction is taken as the objective function of the
optimization, so that the model is added to the model
generalization ability. Therefore, the prediction
accuracy of inulinase concentration for unknown
samples can be significantly improved by the LOO-
PSO method, which is the reason why it takes longer
time to find the optimal results than PSO method.
4.2 Comparison of SVM Regression
Soft-sensor
This section mainly compares the prediction effect
of LS-SVM regression soft-sensor and standard
SVM regression soft-sensor.
The parameter optimization effect of LOO-PSO
algorithm has been proved before, so in order to
guarantee the rationality of the contrast, in this
section, the LOO-PSO parameter optimization
method is adopted for the two soft measurement
models. The PSO parameter setting is the same as
that of the 4.1 section. See Table 1 for details.
The predictive effect of inulinase concentration
in standard SVM and LS-SVM regression soft-
sensor is shown in Table 3.
Table 3: Comparison of different soft-sensors based on
support vector machines.
Model
names
Optimization
time
Estimation
error (%)
Prediction
error (%)
Standard SVM
92
5.34
7.02
LS-SVM
84
5.55
5.79
It can be seen from the previous table that there
are not significant difference between standard SVM
model and LS-SVM model for the inulinase
concentration estimation results at the same LOO-
PSO parameter condition. But the prediction effect
of the LS-SVM regression soft-sensor is better than
the standard SVM regression soft-sensor.
5 CONCLUSIONS
According to the type of input variables and the
amount of samples, a soft-sensor is established to
predict inulinase concentration during the Pichia
pastoris fermentation process based on LS-SVM
regression. The prediction effect of LS-SVM soft-
sensor is better than the standard SVM regression
soft-sensor for unknown inulinase concentration.
To find the best parameters of LS-SVM soft
measurement model, this paper proposed LOO-PSO
parameter optimization method combined with PSO
and LOO method. By comparing the experimental
results with the GS method and the PSO, it is found
that the proposed LOO-PSO parameter optimization
method has the advantages of fast convergence
speed and high prediction precision in predicting the
accuracy of inulinase concentration of unknown
samples.
The soft-sensor can provide references and
guidance for the implementation of real-time control
strategy and improvement of fermentation
technique. Since fermentation process has the
character of shift and variety with time, the soft-
sensor should consider adjusting online to fit new
condition in the future.
ACKNOWLEDGEMENTS
Financial support for this work was provided by the
Key Research and Development Program of
Shandong Provence (No.2016ZDJS02B02).
REFERENCES
Aazi, F. Z., Abdesselam, R., Achchab, B., Elouardighi, A.,
2016. Feature selection for multiclass support vector
machines [J]. AI Communications, 29(5): 583-593.
Bogaerts, P., Wouwer, A. V., 2003. Software sensors for
bioprocesses[J]. ISA transactions, 42(4): 547-558.
Chapelle, O., Vapnik, V., Bousquet, O. et al., 2002.
Choosing multiple parameters for support vector
machines[J]. Machine learning, 46(1-3): 131-159.
Cortes, C., Vapnik, V., 1995. Support-vector networks[J].
Machine learning, 20(3): 273-297.
Huang, C. L., Wang, C. J., 2006. A GA-based feature
selection and parameters optimization for support
vector machines[J]. Expert Systems with applications,
31(2): 231-240.
Lin, S. W., Ying, K. C., Chen, S. C. et al., 2008. Particle
swarm optimization for parameter determination and
feature selection of support vector machines[J]. Expert
systems with applications, 35(4): 1817-1824.
Suykens, J. a. K., Vandewalle, J., 1999. Least Squares
Support Vector Machine Classifiers[J]. Neural
Processing Letters, 9(3): 293-300.
Xi, M. L., Sun, J., Liu, L. et al., 2016. Cancer Feature
Selection and Classification Using a Binary Quantum-
Behaved Particle Swarm Optimization and Support
Vector Machine[J]. Computational and Mathematical
Methods in Medicine, 10(115):9.
Zhang, L., Zhao, C., Zhu, D. et al., 2004. Purification and
characterization of inulinase from Aspergillus niger
AF10 expressed in Pichia pastoris[J]. Protein
expression and purification, 35(2): 272-275.
MEEP 2018 - The Second International Conference on Materials Chemistry and Environmental Protection
18
