
Photocatalytic Degradation of NH
3
-N in Aquaculture
Wastewater by Using CaF
2
(Tm
3+
)/TiO
2
under UV Light
Z W Nie, X C Yu*, J H Liu, L P Wang and M C Guo
College of Ocean Technique and Environment department, Dalian Ocean University,
China
Corresponding author and e-mail: X C Yu, xiaocyu@dlou.edu.cn
Abstrac t. The TiO
2
doped with CaF
2
(Tm
3+
) photocatalyst is employed to degrade NH
3
-N in
aquaculture wastewater under UV light. The photocatalyst was prepared by Sol-gel method
and characterized by SEM, EDS and XRD analysis. The effects of doping ratio of
CaF
2
(Tm
3+
), dosage, initial concentration of NH
3
-N, pH value, concentration of H
2
O
2
and
illumination time on NH
3
-N removal were investigated. The optimal conditions for the
degradation of NH
3
-N were as follows: the catalyst doping ratio was 15%, the dosage was 0.2
g/L, the initial concentration of ammonia nitrogen was 80 mg/L, the concentration of
hydrogen peroxide was 0.3 g/L, the pH value was 10 and the UV light irradiation time was 3
h. In this case, the removal rate of NH
3
-N can reach 68.34%. The results show that
CaF
2
(Tm
3+
)/TiO
2
photocatalyst can effectively remove NH3-N in aquaculture wastewater
under UV light.
1. Introduction
In recent years, aquaculture industry has been developing rapidly with the development of economy.
Meanwhile, water environment has been seriously affected by the direct discharge of untreated
aquaculture wastewater[1]. As a main target pollutant in aquaculture wastewater, NH
3
-N can cause
the explosion of eutrophication in a large area. The eutrophication not only seriously deteriorates the
water quality, but also leads to large-scale reproduction of algae and excessive consumption of
oxygen in the water, which leads to a severe hypoxic environment of the water. Fish is poisoned by
breeding pests, endangering human health[2]. Therefore, the treatment of NH
3
-N is extremely urgent.
Zhang W[3] used ZnO series as catalysts to treat NH
3
-N wastewater. The results showed that the
removal rate of NH
3
-N can reach 66%. Compared with ZnO, TiO
2
has been widely studied in recent
years, for corrosion resistance, no secondary pollutant, low expense and other characteristics. In
particular, the strong catalytic oxidation capacity of TiO
2
makes it widely applied in environmental
pollution control[4]. TiO
2
is a wide bandgap semiconductor which can only absorb near UV light.
Nowadays, people have been using precious semiconductor composite, metal deposition and other
methods to modify TiO
2
to improve the spectral absorption range of TiO
2
[5].Many studies have
shown that the final product of photocatalytic degradation of NH
3
-N is N
2
[6]. In this study, a TiO
2
doped CaF
2
(Tm
3+
) photocatalyst is employed to degrade NH
3
-N in aquaculture wastewater under
UV light.
Nie, Z., Yu, X., Liu, J., Wang, L. and Guo, M.
Photocatalytic Degradation of NH3-N in Aquaculture Wastewater by Using CaF2(Tm3+)/TiO2 under UV Light.
In Proceedings of the International Workshop on Environmental Management, Science and Engineering (IWEMSE 2018), pages 331-340
ISBN: 978-989-758-344-5
Copyright © 2018 by SCITEPRESS – Science and Technology Publications, Lda. All rights reserved
331

2. Experimental
2.1. Materials
The main chemicals include (NH
4
)
2
SO
4
, phenol, NaClO, Sodium citrate, Tm
2
O
3
, HF, CH
3
COOH,
C
2
H
5
OH, tetrabutyl titanate(TBOT), Ca(NO
3
)
2
, HNO
3
and H
2
O
2
.
2.2. Preparation of CaF
2
(Tm
3+
) nanoparticles
CaF
2
(Tm
3+
) nanoparticles were prepared by co-precipitation method. In a typical experiment, a
saturated solution of Ca(NO
3
)
2
was prepared using deionized water as a solvent. Under heating
conditions, a prescribed amount of Tm
2
O
3
was dissolved in concentrated HNO
3
. Then, under the
condition of stirring, Ca(NO
3
)
2
solution and Tm(NO
3
)
3
respectively drops into the HF solution at a
certain rate (Ca
2+
: F
-
=1:2, Tm
3+:
F
-
=1:3;molar ratio),after the titration, the magnetic stirring was
continued for 1 h. After this, the solution was centrifuged and washed 6 times to remove the
remaining NO
3-
.After drying and grinding, the CaF
2
(Tm
3+
) nanoparticles was obtained.
2.3. Preparation of CaF
2
(Tm
3+
)/TiO
2
photocatalyst
CaF
2
(Tm
3+
)/TiO
2
photocatalyst was synthesized using sol-gel method. TBOT, ethanol and a small
amount of glacial acetic acid were mixed and vigorously stirred to form solution A. The precise
amount of CaF
2
(Tm
3+
) nanoparticles was dissolved in deionized water and an appropriate amount of
ethanol was added. After 15 min of ultrasonic separation, solution B was obtained. Under the
condition of stirring, solution B was added dropwise to solution A. After the titration, the stirring was
continued for 60 min. After standing for 24 h, the sol was dried at 80°C for 12 h and ground to
powder, then the powder was calcined at 450°C for 2 h. Then, the samples were ground to form
CaF
2
(Tm
3+
)/TiO
2
photocatalyst. The molar ratios of Tm
3+
to TiO
2
are 0, 5, 10, 15, 20 and 25% .
2.4. Characterization techniques
The crystal structures of all prepared samples were characterized by X-ray diffraction (XRD) using a
D/MAX-2500X ray diffractometer with Cu Kα radiation (Japan). Scanning electron microscopy
(SEM) images using a Quanta 200FEG field emission environment scanning electron microscopy
(American) were employed to obtain a variety of physical and chemical properties of prepared
samples, such as morphology, composition, crystal structure, etc.
2.5. Photocatalytic activity measurements.
The photocatalytic activity of the CaF
2
(Tm
3+
)/TiO
2
photocatalyst under UV light(intensity: 18W) was
evaluated by measuring degradation of NH
3
-N in aquaculture wastewater. According to the
experimental requirements, different amounts of (NH
4
)
2
SO
4
were added in the seawater after
pumping (sampled in the waters near Dalian Ocean University, ammonia concentration of 0.9725
mg/L, pH=7.98) to obtain simulated aquaculture wastewater. The photocatalytic degradation of NH
3
-
N was analysed by various experimental parameters namely doping ratio, dosage, initial
concentration of NH
3
-N, pH value,concentration of H
2
O
2
and illumination time. The content of NH
3
-
N was estimated by indophenol blue colorimetric method[7].
3. Results and discussion
3.1. The characterization of CaF
2
(Tm
3+
)/TiO
2
photocatalyst
The XRD patterns of materials are shown in Figure 1. TiO
2
has obvious peaks at 2θ of 25.4287°,
37.8204°, 47.9708° and 70.3778°. The CaF
2
(Tm
3+
)/TiO
2
with doping ratio of 15% has obvious peaks
when 2θ is 25.3284°, 28.0843°, 38.0536° and 55.2359°. The photocatalyst of 25% has obvious peaks
at 2θ of 25.3289°, 28.0858°, 37.9646° and 55.1043°. Scherrer formula was used to calculate the
IWEMSE 2018 - International Workshop on Environmental Management, Science and Engineering
332
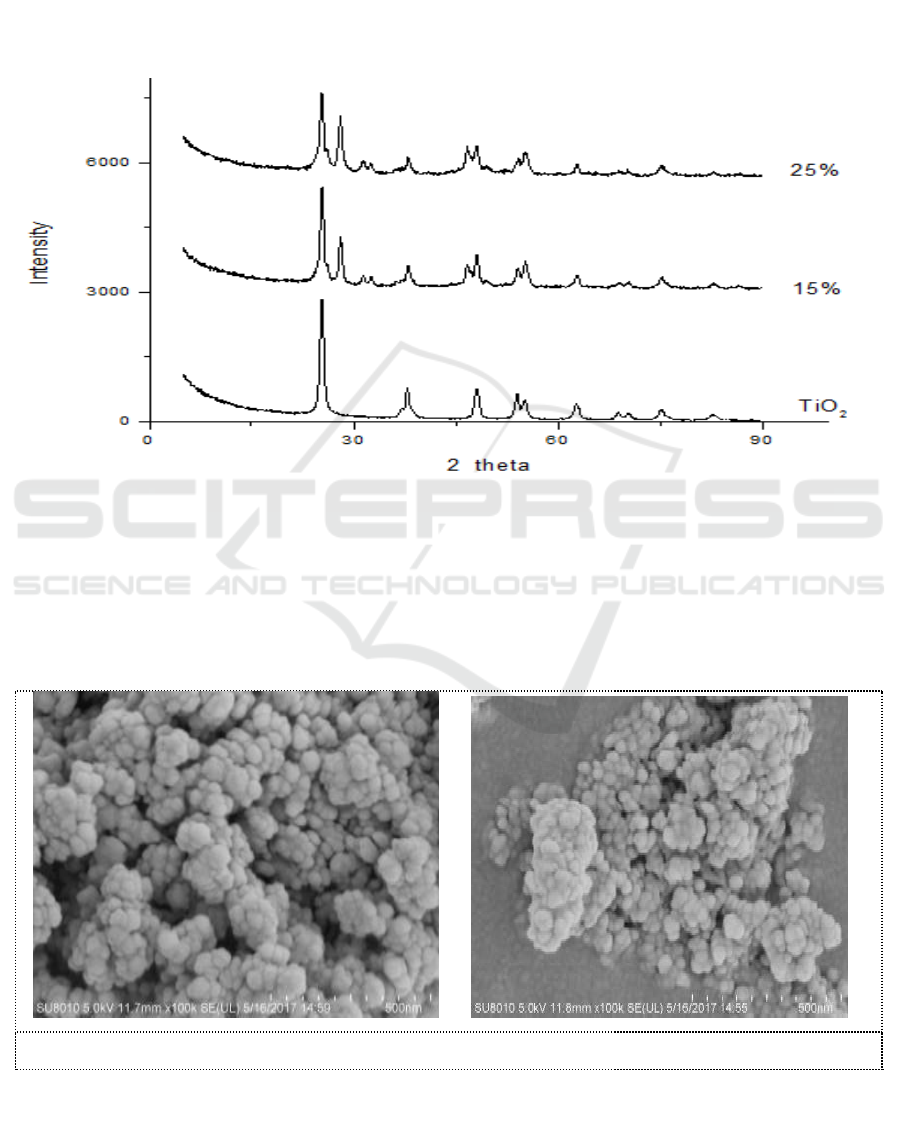
average particle size of the prepared photocatalyst. The lattice constants a, b and c of TiO
2
are 3.7830,
3.7839 and 9.5100 Å; the lattice constants a, b and c of 15% are 3.7852, 3.7852 and 9.5139 Å and 25%
are 6.2782, 6.8131 and 4.4097 Å. The average crystallite sizes of TiO
2
, photocatalyst with the doping
ratio of 15, 25% are 17.72, 15.51 and 20.67 nm, respectively. The diffraction peak positions of the
materials coincide well with those of the TiO
2
standard (JCPDS No. 89-4921).
Figure 1. XRD pattern of CaF
2
(Tm
3 +
)/TiO
2
photocatalyst with different doping ratios.
The typical SEM images are shown in Figure 2 (magnification 100 k times). The doping ratios of
a, b are 0 and15% respectively. It can be seen from the figure that the TiO
2
particles display a regular
globular structure. Compared with pure TiO
2
, larger particle appear in (b). It can be deduced that the
particle size of CaF
2
(Tm
3 +
) is larger than that of TiO
2
. Besides, Compared with Figure 2a, Figure 2b
shows a better crystallinity.
(a) (b)
Figure 2. SEM images of CaF
2
(Tm
3 +
) / TiO
2
photocatalysts with different doping ratios.
In order to further determine the presence and relative content of Tm in CaF
2
(Tm
3+
)/TiO
2
, the
sample was characterized by EDS. The EDS spectrum of the sample is given in Figure 3. From the
Photocatalytic Degradation of NH3-N in Aquaculture Wastewater by Using CaF2(Tm3+)/TiO2 under UV Light
333
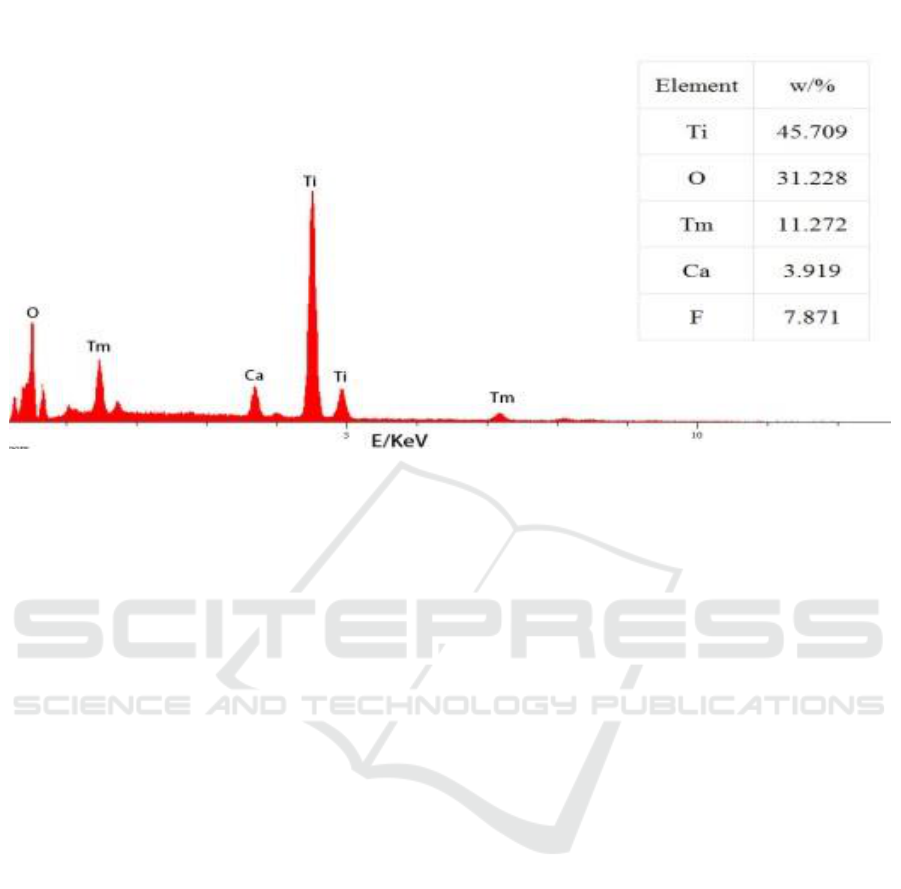
figure, the sample contains Ti, O, and Tm,Ca, F, their contents are listed in the illustration. This
proves that CaF
2
(Tm
3+
) has been well doped in TiO
2
.
Figure 3. EDS images of CaF
2
(Tm
3 +
) / TiO
2.
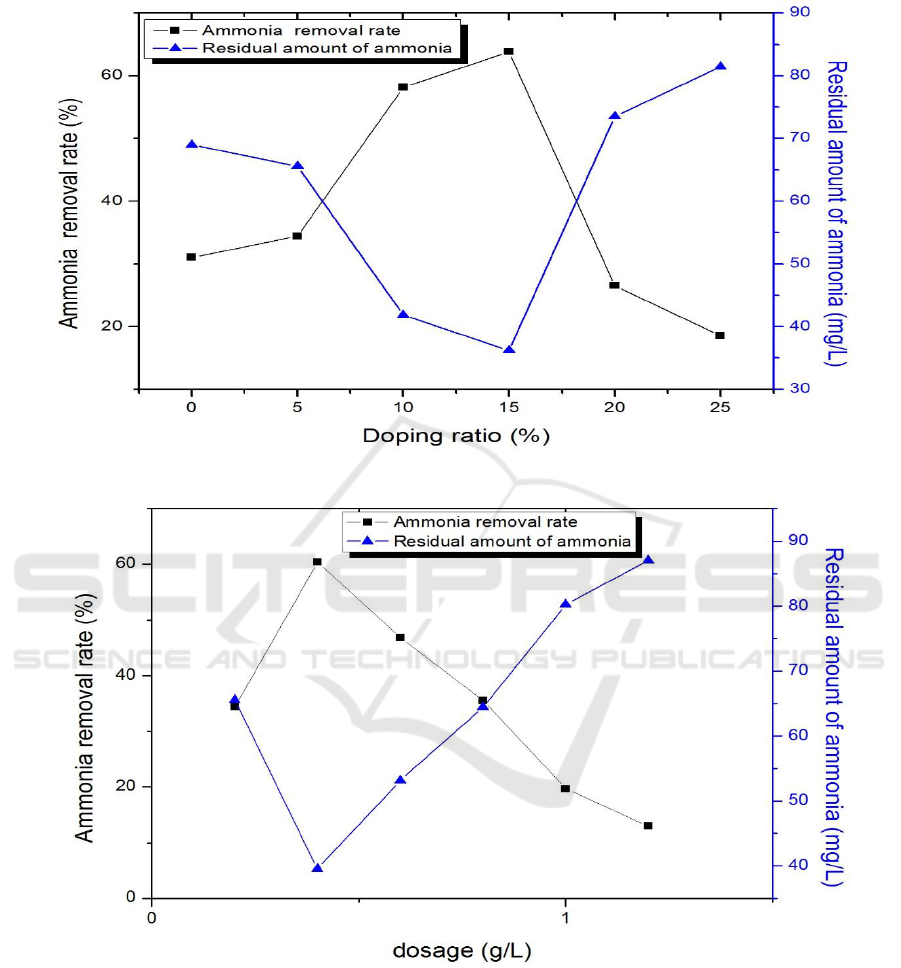
3.2. The effect of doping ratio on photocatalytic reaction
The concentration of NH
3
-N was controlled at 100 mg/L; the pH value of aquaculture wastewater
was 8.0; the dosage of photocatalyst was 0.6g/L; the concentration of H
2
O
2
was 0.3g/L; the
illumination time was 2.0 h and the doping ratio of CaF
2
(Tm
3+
)/TiO
2
was 0, 5, 10, 15, 20, 25 % . The
rate of degradation could be calculated after the reaction.
The results shown in Figure 4 (a), the removal rate increased with the increase of doping
ratio, reached the maximum at 15%, and then the removal rate began to decrease. The
possible reason is that when the doping ratio is more than 15%, TiO
2
is covered with excess
upconversion material, which makes the photocatalytic activity of TiO
2
decrease, so the
removal rate decreases gradually.
3.3. The effect of dosage on photocatalytic reaction
The other conditions were the same as those described in 3.2, just to determine the doping ratio of
15% and the dosage were 0.2, 0.4, 0.6, 0.8, 1.0, 1.2 g/L.
As shown in Figure 4(b), as the dosage increases, the removal increases first and then decreases.
The maximum is 60.43% at 0.4 g/L. At the beginning, the removal rate is gradually increased due to
the more catalyst involved in the reaction, so that the reaction is carried out more completely. When
the dosage is more than 0.6 g/L, the removal rate decreases with the increase of catalyst dosage,
which is mainly due to the scattering of light[8].
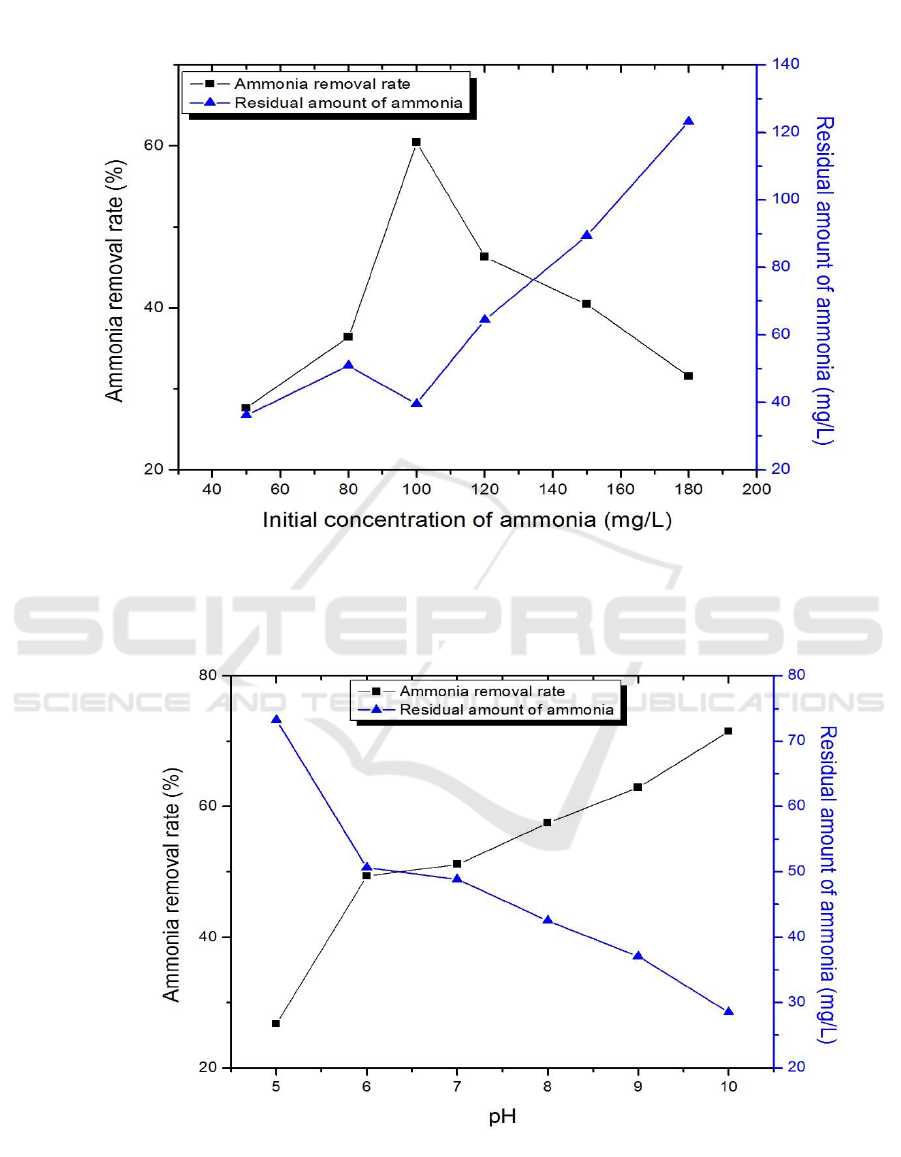
3.4. The effect of initial concentration of NH
3
-N on photocatalytic reaction
The other conditions were the same as those described in 3.2, just to determine the doping ratio of
15%, the concentration of NH
3
-N were 50, 80, 100, 120, 150 and 180 mg/L.
IWEMSE 2018 - International Workshop on Environmental Management, Science and Engineering
334
(a)
(b)
Photocatalytic Degradation of NH3-N in Aquaculture Wastewater by Using CaF2(Tm3+)/TiO2 under UV Light
335
(c)
(d)
IWEMSE 2018 - International Workshop on Environmental Management, Science and Engineering
336
(e)
(f)
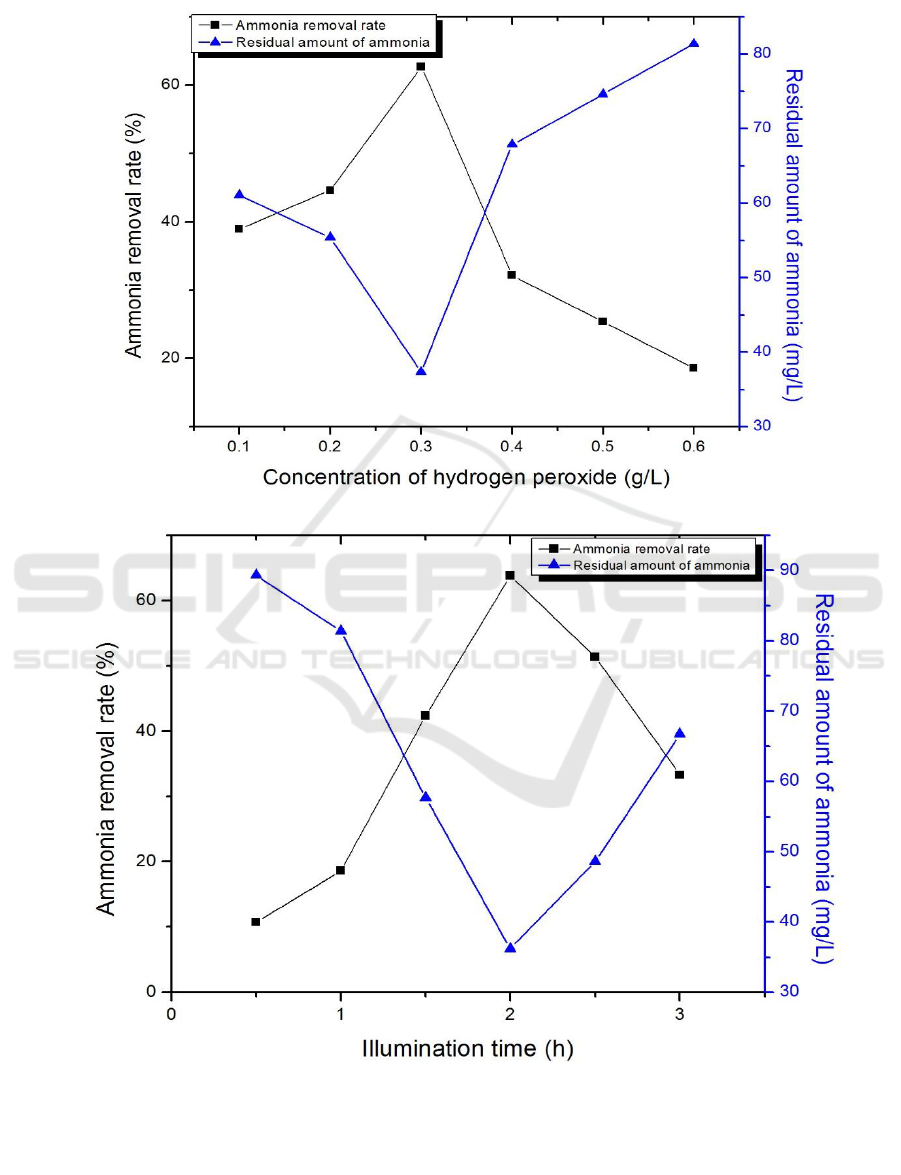
Figure 4. Effect of doping ratios of CaF
2
(Tm
3+
)/TiO
2
(a), dosage (b), initial concentration of NH
3
-N
(c), pH (d), concentration of hydrogen peroxide(e), illumination time (f) on ammonia nitrogen
removal rate.
Photocatalytic Degradation of NH3-N in Aquaculture Wastewater by Using CaF2(Tm3+)/TiO2 under UV Light
337

The results show in Figure 4(c), it is clear that when the initial concentration of NH
3
-N is 100
mg/L, the removal rate can reach 60.43%. The low initial concentration of NH
3
-N has influence on
the reaction of photocatalytic process due to the generation of photo-generated electron-hole pairs is
suppressed, which leads to the effects on removal of NH
3
-N directly. However, the initial
concentration of NH
3
-N reaches a certain value, a large number of pollutants will be attached to the
catalyst surface and the catalyst can not be completely contacted with contaminants. Thus, moderate
concentration of NH
3
-N will increase the removal rate.
3.5. The effect of pH value of aquaculture wastewater on photocatalytic reaction
The other conditions were the same as those described in 3.2, just to determine the doping ratio of
15%, pH value of aquaculture wastewater were 5, 6, 7, 8, 9 and 10.
It can be seen from Figure 4(d) that the removal rate gradually increases with the increase of pH
and reach 71.51% at pH of 10. The NH
3
-N in the wastewater essentially exists in equilibrium in the
form of NH
4 +
and NH
3
. With the increase of pH, the number of ·OH will increase so the removal rate
of NH
3
-N will increase. Meanwhile, with the increase of pH, a part of the NH
3
molecules will be
blown out of the air in the mixing process[9]. Therefore, the higher the pH, the better the removal of
NH
3
-N.
3.6. The effect of concentration of H
2
O
2
on photocatalytic reaction
The other conditions were the same as those described in 3.2, just to determine the doping ratio of
15%, concentration of H
2
O
2
were 0.1, 0.2, 0.3, 0.4, 0.5 and 0.6 g/L.
It can be seen from Figure 4(e) that the maximum removal rate is obtained when the concentration
of H
2
O
2
is 0.3 g/L. Related studies[10] have shown that H
2
O
2
can promote photocatalytic degradation.
As a strong oxidant, H
2
O
2
will produce a photo-generated electrons capture and result in photo-
generated electrons and hole separation[11]. However, H
2
O
2
is also used as a scavenger for the
formation of ·OH and ·O
2-
. Thus, both a small and excess amount of H
2
O
2
will inhibit the reaction.
3.7. The effect of illumination time on photocatalytic reaction
The other conditions were the same as those described in 3.2, just to determine the doping ratio of
15%, illumination time were 0.5, 1.0, 1.5, 2.0, 2.5 and 3.0 h.
The resuts are shown in Figure 4(f). With the increase of time, the removal rate increases first and
then decreases and the best removal rate can reach 63.82% at 2.0 h. The presence of oxygen
molecules in the water can continuously capture the photo-generated electrons, which results in an
increase in ·OH and ·O
2-
, which can improve the efficiency of photocatalytic degradation of NH
3
-
N[12].
3.8. The optimization of photocatalytic conditions of CaF
2
(Tm
3+
)/TiO
2
The photocatalytic degradation of CaF
2
(Tm
3+
)/TiO
2
was analysed by different experimental
parameters namely doping ratio, dosage, initial concentration of NH
3
-N, pH value,concentration of
H
2
O
2
and illumination time. Here, six factors and five levels table was designed and the results of the
orthogonal test are shown in Table 1.
IWEMSE 2018 - International Workshop on Environmental Management, Science and Engineering
338

Table 1. The results of the orthogonal test.
Experiment
Time/(
h)
Initial concentration of
NH
3
-N/(mg·L
-1
)
Doping
ratio/(%)
Dosage/
(g·L
-1
)
Concentration of H
2
O
2
/
(g·L
-1
)
pH
value
Ammonia nitrogen
removal rate/
(%)
1
1
50
5
0.2
0.1
6
19.50
2
1
80
10
0.4
0.2
7
7.30
3
1
100
15
0.6
0.3
8
4.13
4
1
120
20
0.8
0.4
9
8.05
5
1
150
25
1.0
0.5
10
39.10
6
1.5
50
10
0.6
0.4
10
33.07
7
1.5
80
5
1.0
0.3
9
8.42
8
1.5
100
20
0.4
0.1
7
23.12
9
1.5
120
25
0.2
0.5
6
34.80
10
1.5
150
15
0.8
0.2
8
43.02
11
2
50
15
0.4
0.5
8
28.55
12
2
80
25
0.6
0.4
6
26.51
13
2
100
5
0.8
0.2
9
29.91
14
2
120
10
1.0
0.1
10
10.69
15
2
150
20
0.2
0.3
7
23.42
16
2.5
50
20
0.8
0.1
7
24.93
17
2.5
80
15
0.2
0.3
10
68.34
18
2.5
100
25
1.0
0.5
6
6.84
19
2.5
120
5
0.6
0.2
8
16.34
20
2.5
150
10
0.4
0.4
9
23.73
21
3
50
25
1.0
0.2
9
26.23
22
3
80
20
0.8
0.5
8
32.17
23
3
100
10
0.2
0.4
10
38.95
24
3
120
15
0.4
0.3
7
5.41
25
3
150
5
0.6
0.1
6
15.89
K1
78.53
132.28
90.06
185.01
85.13
103.54
K2
142.4
3
142.74
113.74
88.11
122.80
84.18
K3
119.0
8
102.95
149.45
95.94
109.72
124.21
K4
140.1
8
75.29
111.69
138.08
130.31
96.34
K5
118.6
5
145.16
133.48
91.28
141.46
190.15
R
63.9
69.87
59.39
96.9
56.33
105.97
When the doping ratio is 15%, the dosage is 0.2 g/L, the initial concentration of NH
3
-N is 80 mg/L,
the pH is 10, the concentration of H
2
O
2
is 0.3 g/L and the illumination time is 2.5h, the removal rate
of NH
3
-N is up to 68.34%, which is the optimal removal rate. The order of the effect of single factor
on NH
3
-N removal is as follows: pH> dosage> initial concentration of NH
3
-N> illumination time>
doping ratio> concentration of H
2
O
2
.
4. Conclusions
CaF
2
(Tm
3+
)/TiO
2
photocatalyst was synthesized using sol-gel method and characterized by SEM and
XRD analysis. The crystal form of the catalyst is anatase and the particle size is in the range of 15-25
nm. CaF
2
(Tm
3+
)/TiO
2
photocatalyst can effectively degrade NH
3
-N in aquaculture wastewater. When
Photocatalytic Degradation of NH3-N in Aquaculture Wastewater by Using CaF2(Tm3+)/TiO2 under UV Light
339

the catalyst doping ratio was 15%, the dosage was 0.2 g/L, the initial concentration of NH
3
-N was 80
mg/L, the concentration of hydrogen peroxide was 0.3 g/L , the pH was 10 and the UV light
illumination time was 3.0 h, the degradation rate of NH
3
-N by CaF
2
(Tm
3 +
)/TiO
2
photocatalyst can
reach 68.34%.
Acknowledgments
This work has been supported by liaoning province large equipment and equipment sharing service
platform capacity building funds, department of science and technology of liaoning
(2016LD0105),and science foundation of department of ocean and fisheries of liaoning province
(201733),liaoning science and technology public welfare fund(20170002).
References
[1] Cui Y, Chen B J and Chen J F 2005 Assessment of self-pollution of mariculture in Huang-
Bohai Sea Chinese Journal of Applied Ecology 16 (1): 180-185
[2] Zhang Y, Shi Z, Chen M X, Dong X Y and Zhou J T 2015 Evaluation of simultaneous
nitrification and denitrification under controlled conditions by an aerobic denitrifier culture
Bioresource Technology (175):602-605
[3] Zhang W, Tang W Y, He S Y, Yang L Z and Xiu R R 2017 Synthesis of ZnO-PMMA
composites for photocatalytic removal of ammonia nitrogen at low concentration Acta
Scientiae Circumstantiae 37( 2) : 664-670
[4] Gill S H, Young H S, Young U J and Hyun S J 2015 Reduced grapheme oxide/mesoporous
TiO
2
nanocomposite based perovskite solar cells Applied Materials & Interfaces 7:23521-
26
[5] Li C Q, Sun Z M, Xue Y L, Yao G Y and Zheng S L 2016 A facile synthesis of g-C
3
N
4
/ TiO
2
hybrid photocatalysts by sol-gel method and its enhanced photodegradation towards
methyl-ene blue under visible light Advanced Powder Technology 27( 2) : 330-337
[6] Chen X H, Liu L F and Yang F L 2007 Removing ammonia nitrogen from water using
CdS/TiO
2
photocatalyst Photographic Science and Photochemistry 25( 2) : 89-101
[7] Wei H F, Liu C F and Zhang J X 2013 Improvement of NH
4
+
-N Petermination in Water by
Indophenol Research and Exploration in Laboratory (7):17-19
[8] K Nagaveni , G Sivalingam, M.S Hegde and G Madras 2004 Solar potocatalytic degradation of
dyes:high activity of combustion synthesiszed nano TiO
2
Applide Catalysis B:
Environmental 48(2):83-93
[9] Zhang W, Tang W Y, He S Y, Yang L Z and Xiu R R 2017 Synthesis of ZnO-PMMA
composites for photocatalytic removal of ammonia nitrogen at low concentration Journal of
Environmental Science2 (37), 664-670
[10] Xu Q Q, J Li, M Sun and Yu H 2011 Treatment Effects on Ammonia Nitrogeon and Chemical
Oxidization Demand using Ultrasonic-TiO
2
Photocatalytic Processes in Landfill Leachate
Environment and Ecology in the three Gorges 33(2), 27
[11] Zhang Y, Huang R N, X M Wang, Wang Q and Cong Y Q 2012 Mechanism and Kinetics of
Phenol Degradation by TiO
2
Photocatalytic Combined Technologies Environmental
Science 34(2): 596-603
[12] Ji Q Y, X C Yu, J Zhang, Liu Y Q, X L Shang and Qi X Y 2017 Photocatalytic degradation of
diesel pollutants in seawater by using ZrO
2
(Er
3+
)/TiO
2
under visible light Journal of
Environmental Chemical Engineering 5(2): 1423-1428
IWEMSE 2018 - International Workshop on Environmental Management, Science and Engineering
340
