
Evaluation Method of Water Resource Contribution Rate
in Terms of Emergy
C M Lv, M H Ling
*
, X Guo, D Y Di and H S Zhou
School of Water Conservancy and Environment, Zhengzhou University, Zhengzhou,
Henan, 450001, P.R China
Corresponding author and e-mail: M H Ling, 366357398@qq.com
Abstract. As an important resource, water resource has an important contribution to the
development of the social economy system. Now the majority of study concentrated on the
qualitative analysis and the quantitative analysis is not enough. Based on emergy theory,
according to the flow and transformation of water resources in the social economic system,
water resources emergy contribution rate (WECR) is put forward in this paper, to reflect the
contribution of water resources. And the quantization method of WECR to agriculture,
industry, and social life is presented in terms of emergy, which provide a new method for the
research of water resources contribution for economic and social development. Taking
Zhengzhou as an example, the WECR to agriculture, industry, and social life was calculated
from 2005 to 2015, and the average annual contribution rate was 8.55%, 3.68%, 4.71%,
respectively. The results showed that water resources have the greatest contribution to
agriculture and the lowest contribution to industry. In terms of the trend, from 2005 to 2015,
the contribution rate of water resources to agriculture and industry in Zhengzhou city has
increased significantly, and the contribution rate to social life has remained within a certain
range of values, with slight fluctuations in different years.
1. Introduction
Water resource, as one of the irreplaceable natural resources in economic production and social life,
has undoubtedly contributed to the social economy. How to scientifically analyze and measure the
contribution of water resources to the social and economic forms is a hot issue in academic research
[1]. In view of this problem, domestic and foreign scholars carry out a lot of research [2]. In terms of
conceptual research on the contribution of water resources to socio-economic systems, different
scholars have different opinions. Some scholars believe that the marginal benefit of water resources
is the contribution of water resources to economic production. Some scholars believe that the
elasticity coefficient of water resources is the contribution rate of water resources to the social
economy [3]. In terms of quantitative evaluation methods, according to the literature review, the
current research methods are mainly economic methods, such as the Cobb-Douglas production
function method [4], CES production function method [5] and slow production function method [6].
These methods are based on the monetary theory of economics [7], trying to value water resources
and human activities, and measuring everything in terms of money. But in fact, money is only a tool
to measure the role and contribution of economic activity, and the circulation of money does not pass
34
Lv, C., Ling, M., Guo, X., Di, D. and Zhou, H.
Evaluation Method of Water Resource Contribution Rate in Terms of Emergy.
In Proceedings of the International Workshop on Environmental Management, Science and Engineering (IWEMSE 2018), pages 34-41
ISBN: 978-989-758-344-5
Copyright © 2018 by SCITEPRESS – Science and Technology Publications, Lda. All rights reserved

through the natural ecosystem [8], and it is not easy to accurately measure the contribution of water
resources.
Based on the theory of emergy, the concept of water resources emergy contribution rate (WECR)
and its quantification method are put forward, which can provide new ideas for the research of water
resources contribution to regional economic production and contribute to the diversified development
of water resources contribution rate calculation method. Taking Zhengzhou city as an example, the
WECR to agricultural, industry and social life from 2005 to 2015 was calculated and the variation
regularity of contribution rate was analyzed.
2. Water resources emergy contribution rate and its quantification method
2.1. Emergy theory and analytical methods
The theory and methods of environmental emergy accounting were developed by the well-known
American ecologist and systems emergy analysis pioneer H. T. Odum. This approach provided a new
way to analyze ecological economic systems and is widely used in quantitative research into the
relationship between humans and nature, environmental resources, and social economics [9]. The
emergy calculation, simply, put the energy and material into emergy through the solar transformity.
The formula used is as follows:
BM
(1)
Where
M
represents the emergy value (sej),
represents the solar transformity (sej/J or sej/g),
and
B
represents the quantity of energy or substance (J or g).
2.2. Water resources emergy contribution rate
The contribution of water resources to the society and economy can be described as: In a certain system,
the beneficial effect of water resources on society and economy. It is realized through the continuous
transfer and transformation of the energy of water resources in the social and economic system, and it is
finally embodied in various high-energy products or services. Therefore, we define the Water Resources
Emergy Contribution Rate (WECR) as the ratio of the net contribution emergy of water resources to
the net output emergy of the system. WECR is a relative index to measure the contribution of water
resources to social and economic. In a certain area, within a certain period of time, the total emergy of
the system is certain. The greater the emergy of the water resources is, the greater the WECR can be.
2.3. The quantization method of WECR
Studying the contribution of water resources to society and economy needs to find a common measure
that can measure the relationship between water resources and human social and economic systems. For
a long time, the economic system used the currency to measure the level of economic development and
the role and contribution of human beings. However, the currency circulation did not pass through the
natural ecosystem and could not measure the contribution and role of water resources and other natural
resources. Emergy theory and method, based on solar emergy, provide a common measurement
standard for measuring the relationship between nature and economy, and provide quantitative
criteria for studying the contribution of water resources to social and economic development [10].
First the energy network diagram is constructed to clarify the input and output of energy in the
system. The energy flow, material flow and currency flow of the system are converted into emergy
flow through the solar transformity, and WECR can be quantified by the ratio of the net contribution
emergy of water resources to the net output emergy of the system. In the process of calculation,
according to the water user classification standard of China's water resources comprehensive
planning, WECR can be calculated separately from three sectors of agriculture, industry and life. The
specific steps are as follows:
Evaluation Method of Water Resource Contribution Rate in Terms of Emergy
35

(1) Energy network diagram.
The process of production and life is accompanied by constant energy conversion. So, the water
system can be regarded as an energy system. With the circulation, flow and storage of water in the
system, the energy network is formed. By constructing the energy network diagram of water system, the
structure of the system can be clearly defined, and the transmission and transformation process of the
energy in and out of the system is understood.
(2) Calculation of the total emergy of the system (M
U
)
The production and living process is abstracted into the input-output process of water resources
and other material, information, labor, etc. And the emergy analysis table is compiled,as shown in
Table 1. According to Equation 1, the input and output of the system can be calculated. The total
input emergy of the system is M
U
, the feedback input emergy of the system is M
F
, the total output
emergy of the system is M
Y
, the water input emergy of the system is M
W
, and the feedback input
emergy of water is M
WF
.
The total input emergy of the system can be calculated by the following formula.
1U R N R S
M M M M M
(2)
Where M
R
is the emergy input of renewable environmental resource (sej), M
N
is the emergy input of
nonrenewable environmental resources (sej), M
R1
is the emergy input of renewable organic energy of
human economic and social feedback (sej), M
S
is the emergy input of nonrenewable industrial
auxiliary energy (sej).
The water input emergy of the system (M
W
) can be calculated by multiplying the utilization of water
resources in the process of production and living by the water solar transformity. Several types of water
resources should be considered in agricultural water use, such as effective precipitation, surface water
and groundwater. Industrial water is mainly surface water and groundwater, but it is necessary to pay
attention to the problem of reuse of industrial water. Domestic water mainly considers tap water, mineral
water and pure water.
(3) Calculation of WECR
The WECR is the proportion of net contribution emergy of water resources to the net output
emergy of the system (NM
Y
). The net contribution emergy of water resources (NM
W
) is equal to the
contribution of water resources to the system minus the feedback emergy input of the system to the
water resources. The formula is as follows.
W
W Y WF
U
M
NM M M
M
(3)
The system net output emergy (NM
Y
) is equal to the total output emergy (M
Y
) minus the feedback
input emergy (M
F
). The formula is as follows.
Y Y F
NM M M
(4)
Therefore, the quantitative formula for WECR is as follows:
100%
W
Y WF
WU
Y Y F
M
MM
NM M
WECR
NM M M
(5)
3. Water resources emergy contribution rate in Zhengzhou
According to the method of WECR, collect the data of socio-economic, natural environment and water
resources in Zhengzhou and understand the basic structure of socio-economic system in Zhengzhou. The
relevant data of water resources were obtained from Zhengzhou water resources bulletin (2005~2015).
IWEMSE 2018 - International Workshop on Environmental Management, Science and Engineering
36

The social and economic data were obtained from Zhengzhou Statistical Yearbook (2006~2016) and
Henan Statistical Yearbook (2006~2016). The data of solar transformity of different water bodies and
the ratio of emergy to money in Zhengzhou were derived from the previous research results [10]. The
solar transformity of other materials and energy refer to the research results of S F Lan et al [9].
3.1. The WECR to agriculture of Zhengzhou
According to the relationship between the main energy flow, material flow and currency flow in the
agricultural sector of Zhengzhou, the energy system network diagram of agriculture is constructed, as
shown in Figure 1 (see ref. [9] for illustration).Taking the year of 2005 as an example, the calculation of
WECR to agriculture in Zhengzhou city is shown in Table 1. The summary results of WECR to
agriculture from 2005 to 2015 are shown in Table 2.
Table 1. The emergy analysis table of WECR to agriculture of Zhengzhou in 2005.
Item of agriculture
Data
unit
solar transformity
(sej/unit)
Emergy
(10
20
sej)
1 Input
1.1 Renewable resources
1.1.1 sunlight
3.70×10
19
J
1.00
0.37
1.1.2 wind
6.29×10
16
J
6.23×10
2
0.39
1.1.3 water resources
6.82×10
8
m
3
1.80×10
12
12.26
1.2 Nonrenewable resources
Topsoil loss
5.60×10
15
J
6.25×10
4
3.50
1.3 Nonrenewable industrial energy
1.3.1 electricity
1.20×10
16
J
1.59×10
5
19.04
1.3.2 diesel
2.01×10
15
J
6.60×10
4
1.33
1.3.3 fertilizer
21.54×10
4
t
6.45×10
15
13.9
1.3.4 others
1.26×10
14
J
6.82×10
7
85.88
1.4 Renewable organic energy
1.4.1 labour
2.58×10
15
J
3.80×10
5
9.81
1.4.2 draught power
5.11×10
14
J
1.46×10
5
0.75
1.4.3 organic fertilizer
1.60×10
16
J
2.70×10
4
4.27
1.4.4 seeds
4.55×10
14
J
2.00×10
5
0.91
1.5feedback input
1.5.1M
F
2.38×10
9
¥
7.44×10
11
17.71
1.5.2M
WF
1.06×10
8
¥
7.44×10
11
0.79
2 Output
2.1 Agriculture products
2.1.1 grain
2.40×10
14
J
9.38×10
6
22.48
2.1.2 vegetables
4.44×10
16
J
2.70×10
4
11.98
2.1.3 fruit
7.03×10
15
J
5.30×10
4
3.72
2.1.4 others
6.06×10
15
J
6.92×10
5
41.94
2.2 Livestock products
2.2.1 meat
8.68×10
15
J
1.94×10
6
168.20
2.2.2 eggs
4.04×10
15
J
2.00×10
6
80.80
2.2.3 others
6.10×10
15
J
2.00×10
6
121.97
Evaluation Method of Water Resource Contribution Rate in Terms of Emergy
37
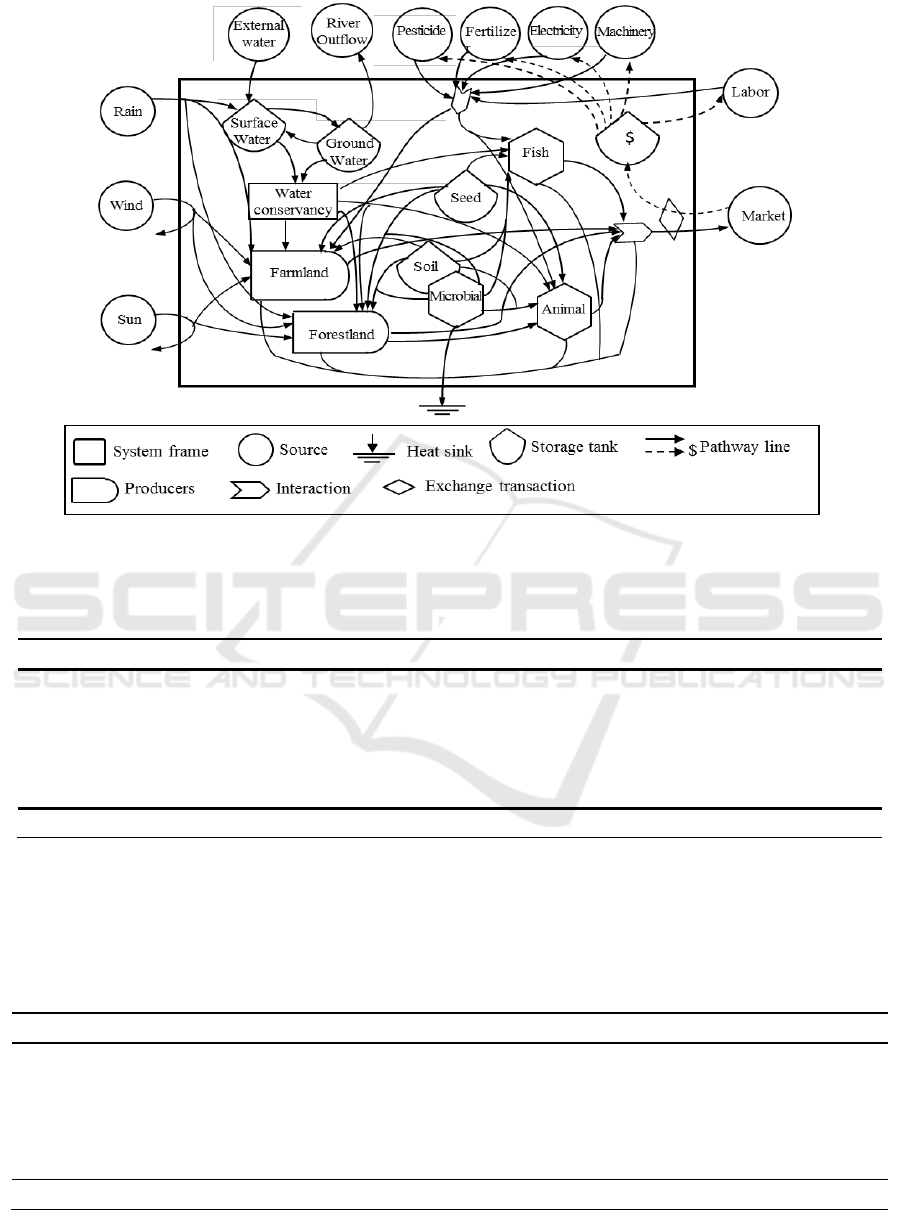
Figure 1. The energy network diagram of agricultural system of Zhengzhou.
Table 2. The summary results of WECR to agriculture from 2005 to 2015. (10
20
sej)
Item
2005
2006
2007
2008
2009
2010
2011
2012
2013
2014
2015
M
UA
152.40
158.26
161.75
169.32
175.45
180.72
183.94
190.29
197.22
206.73
215.03
M
WA
12.25
12.58
13.47
14.19
14.11
14.49
14.92
16.18
16.84
17.30
18.07
M
YA
451.09
417.77
448.26
473.21
495.15
512.37
539.06
501.65
537.89
575.52
521.37
M
FA
17.71
20.34
21.57
25.03
29.48
30.21
33.27
35.02
38.49
39.05
42.14
M
WFA
0.79
0.82
0.75
0.87
0.91
0.97
1.01
1.17
1.23
1.35
1.42
WECR
A
(%)
8.18
8.15
8.57
8.65
8.36
8.32
8.45
8.89
8.95
8.73
8.85
3.2. The WECR to industry of Zhengzhou
The calculation process of WECR to industry in Zhengzhou city is similar to that of the agricultural
calculation table. The summary results of WECR to industry from 2005 to 2015 are shown in Table 3.
Table 3. The summary results of WECR to industry of Zhengzhou from 2005 to 2015. (10
20
sej)
Item
2005
2006
2007
2008
2009
2010
2011
2012
2013
2014
2015
M
UI
596.97
635.48
711.71
812.38
919.54
1065.89
1143.55
1225.19
1316.58
1409.76
1502.91
M
WI
18.66
21.18
23.66
29.21
31.74
38.85
43.63
47.74
51.25
54.83
58.35
M
YI
1857.56
2055.88
2394.62
2527.62
2815.01
3127.74
3356.12
3425.15
3597.21
3619.35
3821.87
M
FI
222.68
249.16
263.27
294.15
317.45
321.09
329.52
315.23
359.45
379.71
393.85
M
WFI
10.27
10.82
11.15
10.31
9.52
8.02
7.15
8.21
7.47
7.75
8.54
WECR
I
(%)
2.92
3.19
3.21
3.61
3.51
3.78
3.99
4.03
4.09
4.11
4.08
IWEMSE 2018 - International Workshop on Environmental Management, Science and Engineering
38
3.3. The WECR to social life of Zhengzhou
The calculation process of WECR to social life in Zhengzhou city is similar to that of the agricultural
calculation table. The summary results of WECR to industry from 2005 to 2015 are shown in Table 4.
Table 4. The summary results of WECR to social life of Zhengzhou from 2005 to 2015. (10
20
sej)
Item
2005
2006
2007
2008
2009
2010
2011
2012
2013
2014
2015
M
UL
218.42
237.75
251.29
247.23
263.37
271.52
285.19
289.33
292.48
298.35
305.74
M
WL
7.21
7.35
7.27
7.39
7.75
8.61
8.74
9.13
10.07
10.35
10.94
M
YL
257.45
263.89
267.72
271.27
280.32
289.54
295.03
303.85
309.27
314.92
320.24
M
FL
109.33
129.72
133.94
135.85
130.74
127.83
132.42
131.37
128.35
119.83
115.83
M
WFL
1.54
1.73
1.67
1.59
1.63
1.53
1.49
1.60
1.72
1.75
1.43
WECR
L
(%)
4.70
4.79
4.54
4.81
4.42
4.73
4.64
4.63
4.93
4.70
4.91
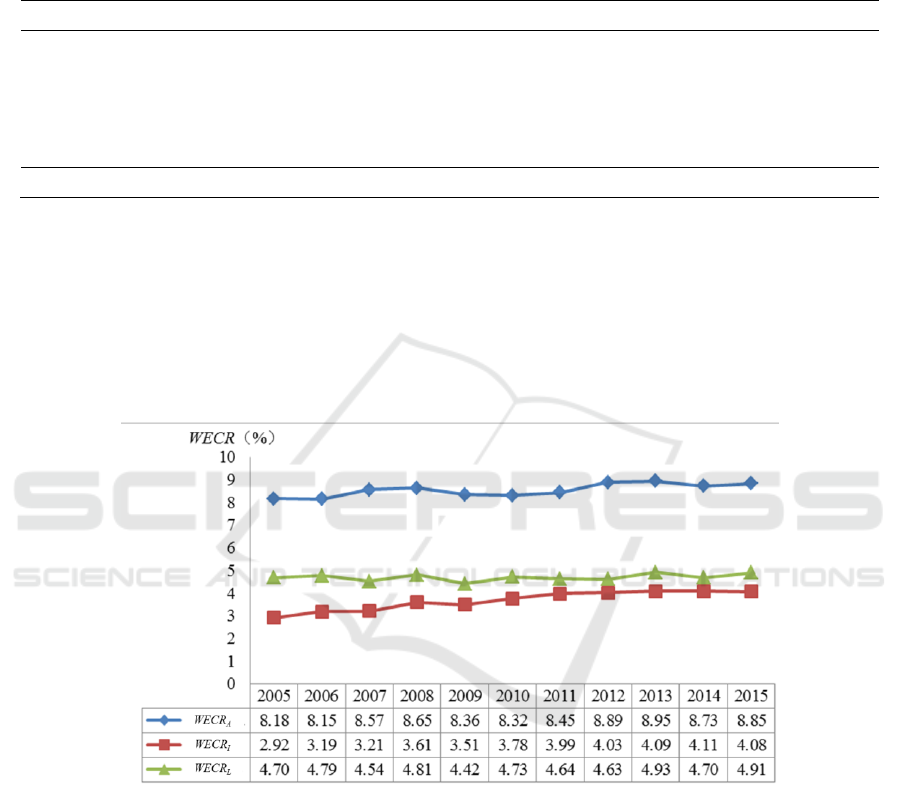
3.4. Result analysis
The results of WECR to agriculture, industry and social life of Zhengzhou from 2005 to 2015 are shown
in Figure 2. From 2005 to 2015, the calculation result of WECR to agricultural in Zhengzhou shows an
upward trend of fluctuation and the average is 8.55% in many years. Fluctuation is mainly influenced by
the randomness of rainfall. In addition, due to the low solar transformity of rainfall, although the
agricultural water consumption in Zhengzhou is the largest, the water resource emergy is not the highest.
Figure 2. The trend chart of WECR of social economic system of Zhengzhou from 2000 to 2010.
From 2005 to 2015, the WECR to industry in Zhengzhou from 2005 to 2015 shows an increasing
trend overall, especially since 2010, and the average is3.68%. The increasing trend is related to the
implementation of new urban development policies after 2010 in Zhengzhou, such as adjusting the
industrial structure, improving production processes, and improving water efficiency.
The WECR to social life in Zhengzhou is 4.71% in the year average. Because the contribution rate of
water resources to social life is affected by many uncertain factors, such as material supply level, price
level and residents' consumption capacity, there is no obvious rule to follow. However, the WECR to
social life is relatively stable, which is basically maintained within a certain range of values and slightly
fluctuated in different years.
Comparing and analyzing the law of WECR among different departments in Zhengzhou is:
Agriculture >Social life > Industry. For agriculture, water resources are the basic material and the
Evaluation Method of Water Resource Contribution Rate in Terms of Emergy
39

restrictive factors of agricultural output. Therefore, the WECR to agriculture is the largest. For life, water
is the source of life and the basic guarantee for human survival. However, the total output emergy of
social living system is less, resulting in low net contribution emergy of water resources; therefore the
contribution rate of water resources in social life is low. Due to the high input of auxiliary energy and
technology in the industrial system, the total emergy input is high and the emergy input of water
resources is relatively low, which makes the WECR to industry are the lowest among the three sectors.
DING Xiangyi [11] used the production function formula of traditional economics to calculate the
contribution rate of water resources (WCR) to GDP in zhengzhou in 2010. The results are shown in
Table 5. Comparing the results of WECR and WCR (as shown in Table. 5), it is found that the result
of WECR is more reasonable. Taking agriculture as an example, the WCR calculated by economic
method is 0, which is not consistent with the facts. However, the WECR to agriculture in 2010 is 8.32,
which considers the effect of effective rainfall and irrigation on agricultural output comprehensively,
and the result is more reasonable. In addition, the WCR to industrial calculated by economic method
is over 100%, which is obviously too large. In comparison, it is more reasonable to calculate the
contribution rate of water resources in terms of emergy.
Table 5. Comparative analysis of contribution rate of water resources in Zhengzhou in 2010 by
different calculation methods.
Item
agriculture
industry
social life
WCR (economic method) (%)
0
103.9
16.1
WECR (emergy method) (%)
8.32
3.78
4.73
4. Conclusions
Emergy method overcomes the defects that the currency of economic analysis methods cannot
measure the contribution of nature to human economic and social development. The contribution rate
of water resources calculated by emergy method is beneficial to evaluate the real benefits and
contributions of water resources. Since the calculation of WECR involves some aspects of the
socio-economic system, the transfer and transformation processes of the energy flow in the system is
very complex. This paper focuses on water resources and only the energy flow that interacts with water
resources is analyzed. Other ecological flows are simplified. In future research, it is necessary to conduct
a systematic analysis of the energy conversion processes and interactions relationship between the
energy flow, material flow and currency flow in the socio-economic system of water resources.
Acknowledgements
This research was funded by the National Natural Science Foundation of China (No.
NSCF-51609216)
References
[1] Kontoleon A 2003 Essays on non-market valuation of environmental resources: policy and
technical explorations (London: University of London) p 57
[2] Ekin Birol 2010 Assessing the economic viability of alternative water resources in
water-scarce regions (Ecological Economics vol 69) ed R.B. Howarth (Amsterdam:
Elsevier) chapter 4 pp 839-847
[3] Natalia A Kosolapova 2017 Modeling resource basis for social and economic development
strategies: Water resource case (Journal of Hydrology vol 553) ed E.N. Anagnostou
(Amsterdam: Elsevier) pp 438-446
[4] Jan Friesen 2017 Environmental and socio-economic methodologies and solutions towards
integrated water resources management (Science of The Total Environment vol 581) ed X
B Feng (Amsterdam: Elsevier) chapter 1 pp 906-908
IWEMSE 2018 - International Workshop on Environmental Management, Science and Engineering
40

[5] Fan Y L and Nie H 2014 Analysis of degree of water contribution to industry and benefits of
ecological water in Shanxi Province (Science of Soil and Water Conservation vol 2) ed
Neil Adger (Beijing: beijing forestry university) pp 99-104
[6] Wei J and Wei Y P 2017 Evolution of the societal value of water resources for economic
development versus environmental sustainability in Australia from 1843 to 2011 (Global
Environmental Change vol 42) ed Neil Adger (Amsterdam: Elsevier) pp 82-92
[7] Hollingworth D Mullins 1995 Economic analysis of water resource development proposals in
the Sable River basin (Water Science and Technology vol 32) ed A Luonsi
(Amsterdam: Elsevier) chapter 5 pp 71-72
[8] Odum H T 1996 Environmental accounting: emergy and environmental decision making
(NewYork: John Wiley&Sons)
[9] Lan S F, Qin P and Lu H F 2002 Emergy analysis of ecological economic system (Beijing:
Chemical Industry Press)
[10] Lv C M and Wu Z N 2010 Emergy analysis for sustainable development assessment of
regional water ecological economics system (Systems Engineering-Theory & Practice vol
30) ed L Lin (Beijing: National defense university press.) chapter 7 pp 1293-1298
[11] Ding X Y 2007 Method of calculating contribution rate of water resources to regional GDP
and its application (Journal of Economics of Water Resources vol 25 ) ed Y T Fang
(Nanjing: Hohai University) chapter 3 pp 1-4
Evaluation Method of Water Resource Contribution Rate in Terms of Emergy
41
