
Application of Unmanned Aerial Vehicle and Random
Forests Model in Alpine Grassland Cover Estimation: A Case
Study in the Xiahe County, China
B P Meng
1, 2
, T G Liang
1, 2,*
, Q S Feng
1, 2
, J L Gao
1, 2
, J Ge
1, 2
and J Liu
1, 2
1
State Key Laboratory of Grassland Agro-ecosystems, College of Pastoral
Agriculture Science and Technology, Lanzhou University, Lanzhou 730020, China
2
Key Laboratory of Grassland Livestock Industry Innovation, Ministry of
Agriculture, China
Corresponding author and e-mail: T G Liang, tgliang@lzu.edu.cn,
mengbp09@lzu.edu.cn, feng2002226@163.com, gaojl16@lzu.edu.cn,
gej12@lzu.edu.cn, liuj14@lzu.edu.cn,
Abstract. Estimate grassland cover accurately is crucial in understanding of existing and
changing processes on regional ecology in a pasturing area. In this study, the unmanned aerial
vehicle (UAV) is used to measure grassland cover (in Xiahe County, from 2014 to 2016), for
developing and validating various inversion models of Alpine grassland cover, based on
MODIS vegetation indices and meteorological data. Results show that: (1) the logarithm
model of enhanced vegetation index (EVI) performs the best among the single variate
models, with an R
2
and RMSE of 0.48 and 16.95%, respectively and (2) the random forest
model is the optimum grassland cover inversion model among all models examined, with R
2
and RMSE of 0.73 and 12.11%, respectively.
1. Introduction
Grasssland cover is an important ecosystem parameter in regulating climate, hydrologic processes and
geochemical cycles [1-3]. In addition, the changes of grassland cover over time have been directly
used as an indicator for grassland degradation, soil e
rosion [4], desertification [5], over-grazing and change of land use [6]. Therefore, accurate estimation
of grassland cover has a significant impact on the understanding of existing and changing processes
on regional ecology, to support the local government policy for decision-making.
Recently, the unmanned aerial vehicle technology (UAV) has been evaluated as a valuable tool to
replace the traditional methods [7-9], for its convenient operation, fast and accurate acquisition of the
grassland cover [10]. Meanwhile, numerous studies have shown that grassland cover is close
correlated with meteorological parameters and remote sensing indices [2, 11], served as the
foundation for a random forests model (RF) to estimate grassland cover [1-3]. However, few studies
have used RF to estimate grassland cover, particularly on alpine meadow grassland in Tibetan
Plateau.
Meng, B., Liang, T., Feng, Q., Gao, J., Ge, J. and Liu, J.
Application of Unmanned Aerial Vehicle and Random Forests Model in Alpine Grassland Cover Estimation: A Case Study in the Xiahe County, China.
In Proceedings of the International Workshop on Environmental Management, Science and Engineering (IWEMSE 2018), pages 13-19
ISBN: 978-989-758-344-5
Copyright © 2018 by SCITEPRESS – Science and Technology Publications, Lda. All rights reserved
13
The objectives of this study are (1) to examine the inversion uncertainties by comparing the RF
model and traditional models to estimate grassland cover and (2) to recommend the optimum
grassland cover model on alpine meadow grassland in Tibetan Plateau for policy makers.
2. Data and methods
2.1. Study area
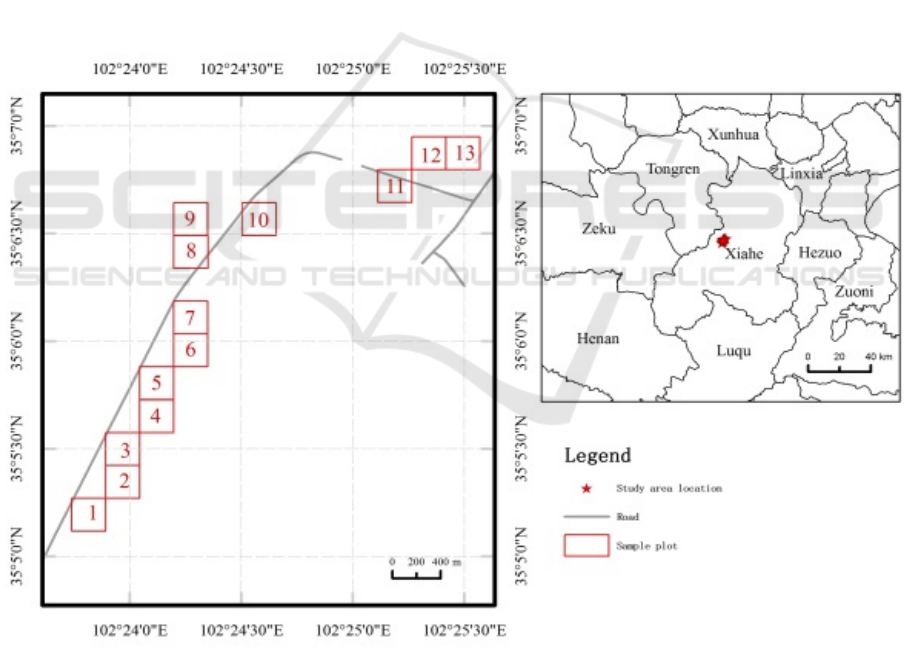
The study area (102°23'-102°26'E, 35°5'-35°7' N) is located in the Yangji Community of Sangke
Town in Xiahe County, Gansu Province (Figure 1), with the size of approximately 3.86 km (N-S) ×
2.77 km (E-W) and a mean elevation of 3,050 m. The natural grassland type in the study area is the
alpine meadow. The study area belongs to the continental monsoon climate of the temperate plateau,
the annual average temperature is 2.1 °C, and rainfall is 580 mm.
2.2. Sampling strategy and data collection
A total of 13 permanent sample plots (250 m×250 m) were set up inside study area (Figure 1). The
locations of the plots were selected based on the following factors: (1) the growth status of the
grassland was relatively uniform and spatially representative; and (2) each sample plot was
corresponded to one MODIS pixel of 250 m. Observations by UAV were conducted approximately
once per 10 days during the grassland growing seasons from 2014-2016.
Figure 1. Distributions of the 13 sample plots (red square of 250 m x 250 m, a MODIS pixel) in
Xiahe County, Gansu Province.
The UAV used is the Phantom 3 professional Quad-Rotor Intelligent, manufactured by DJI
industries (http://www.dji.com). The dimension of a UAV image is set as 4000×3000. The UAV can
flight according to predesigned routes with a Naza-M autopilot system automatically, and hold
command with a positon accuracy ± 1.5 m horizontally and ± 0.5 m vertically. The UAV image is in
IWEMSE 2018 - International Workshop on Environmental Management, Science and Engineering
14
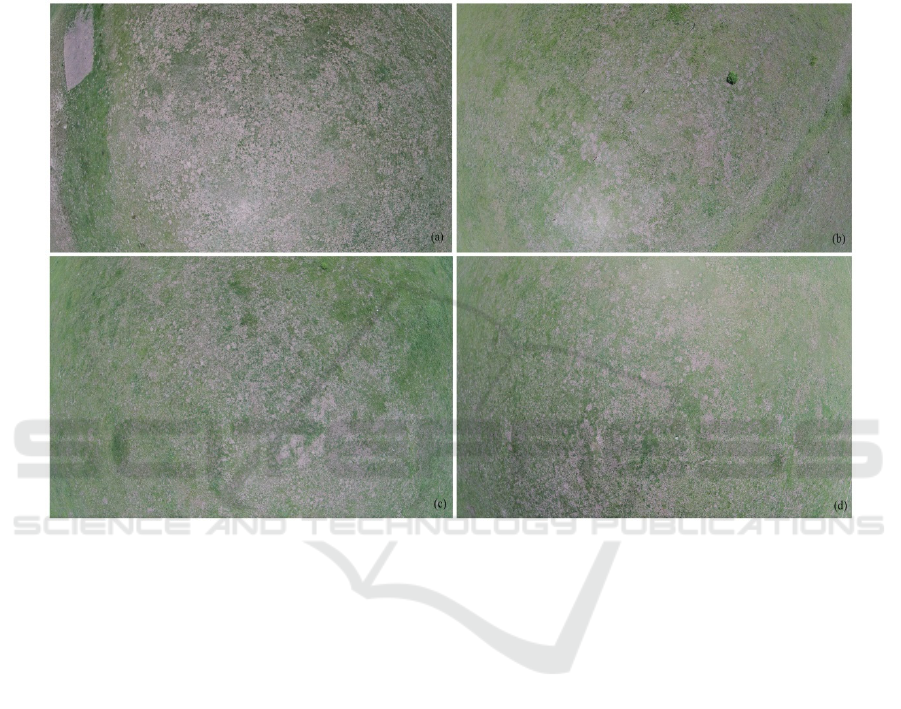
the visible bands (red, green, and blue), stored as a digital number (0 to 255) in JEPG format, with
location information in its properties file. The airway of UAV was designed by FragMap [13] to take
images five times for each quadrat (nadir view) at a height of ~30 m above the surface, with real
pixel size less than 2 cm. The grassland cover of each sample plot was calculated from each collected
image by the Digital Photos Processing System (DPPS) [12]. The average of the five images over the
same plot is set as the mean grassland cover of each sample plot.
Figure 2. An example of the UAV images (a, b, c and d for four difference plots) in Jul of 2015.
2.3. MODIS and meteorological data
The MODIS vegetation indices data were selected from the 16d maximum composite NDVI and EVI
vegetation indices product (MOD13Q1) of the United States National Aeronautics and Space
Administration. In total, 69 images with a spatial resolution of 250 m and orbit number h26v05 were
downloaded during the grassland growing season (May to October) from 2014 to 2016. The MODIS
Reprojection Tool (MRT) was employed to transform and register MOD13Q1 indices to Albers map
projection (Geo-Tiff format).
The monthly meteorological data was calculated based on dataset of daily surface observation
values in China (V3.0) (http://cdc.cma.gov.cn/). Totally, 38 official meteorological stations (in the
Xiahe County and surrounding areas) were selected to calculate average temperature (T) and
cumulative precipitation (P) for each month in growing season from 2014 to 2016, and the
meteorological data from outside stations was acquired through thin-plate smoothing splines
(ANUSPLIN) interpolating [14].
For further analysis, the Alberts map projection is used for all data. The ArcGIS software was
used to extract the value of each factors corresponding to the ground samples, and MATALB
software was used for modelling and inversion.
Application of Unmanned Aerial Vehicle and Random Forests Model in Alpine Grassland Cover Estimation: A Case Study in the Xiahe
County, China
15

2.4. Grassland cover inversion model construction and accuracy evaluation
The four parameters, T, P, and MODDIS EVI and NDVI, were used to construct the univariate
(including linear, exponential, logarithm and power model) and RF models. RF consists of a set of
decision tree algorithms [15]. “RF_MexStandalone-v0.02” package in MATLAB is used to establish
and validate model.
The performance of the aforementioned grassland cover estimation models was evaluated by 10
fold cross validation. All data source was divided into approximately 10 equal numbers of samples
for cross validation. Each time, 10% (i.e., 1/10 of total samples) was used as test set, and the
remaining parts were used as the training set. R
2
and RMSE values were calculated for each dataset
[16]. The process was repeated 10 times until each part was used as both a test set and part of training
set. Performance of models is represented by mean of R
2
and RMSE values from the 10 runs. The
stabilities of models were represented by standard deviation (SD) for R
2
and RMSE of test set
(denoted by SD
R
2
and SD
RMSE
). The higher the R
2
, the smaller the RMSE, the closer SD to 0, the
higher the precision, accuracy and stability of the model. The equations for RMSE and SD are:
=
∑
(1)
SD=
∑
−
⁄
(2)
where cover
represent i-th observed grassland cover, f
i
represent i-th grassland cover
estimated by model, and n is the plots of test set; x
is repeated R
2
and RMSE of the test set, x is
the average value for x
, and N is the number of modelling and validation repetitions.
3. Result and analysis
3.1. Accuracy evaluation for univariate and RF models
Results of the accuracy evaluated by 10-fold cross validation for the univariate and RF models based
on indices and meteorological data are listed in table 1. The logarithm model performs best in each
index among four types of grassland cover estimation models. The optimum of univariate inversion
models is logarithm model based on EVI with R
2
and RMSE of 0.48 and 16.95%, respectively,
followed by P (0.44 of R
2
and 17.78% of RMSE). However, the use of univariate model could only
account 26% ~ 46% the variation of grassland cover during the growing season in the study area
(table 2). The accuracy of RF model is significant higher than others, with R
2
of 0.73 and RMSE of
12.11%. The best fitted univariate models are listed in table 2, and all models pass the F test at a
significant level of 0.001.
Table 1. Validation results by 10-fold cross validation for
the grassland cover models based on single factor.
Indices Model
Training set Test set
R
2
RMSE R
2
RMSE
EVI
Linea
r
0.47 17.41 0.46 17.50
Ex
p
onential 0.43 18.06 0.42 18.16
Logarith
m
0.50 16.90 0.48 16.95
Powe
r
0.47 17.44 0.45 17.53
NDVI
Linea
r
0.40 18.47 0.39 18.46
Ex
p
onential 0.39 18.73 0.38 18.73
Lo
g
arith
m
0.41 18.36 0.40 18.33
Powe
r
0.40 18.55 0.39 18.53
P
Linea
r
0.41 18.43 0.41 18.51
Exponential 0.37 18.99 0.38 19.11
Logarith
m
0.44 17.83 0.44 17.78
Powe
r
0.42 18.27 0.42 18.31
IWEMSE 2018 - International Workshop on Environmental Management, Science and Engineering
16

T
Linea
r
0.25 20.70 0.28 20.86
Ex
p
onential 0.23 21.03 0.26 21.18
Lo
g
arith
m
0.27 20.44 0.30 20.56
Powe
r
0.25 20.72 0.28 20.85
EVI, P, NDVI, T RF 0.94 6.06 0.73 12.11
Table 2. The best fit models constructed based on univariate (
**
represents p < 0.001).
Variable Formula R2
EVI y=0.135ln(x)-0.127 0.46
**
NDVI y=0.131ln(x)+0.116 0.40
**
P y=574.244ln(x)-832.968 0.43
**
T y=19.355ln(x)+32.966 0.26
**
3.2. Comparison of stability between inversion models
The stability of univariate and RF models list in table 3. For the stability of R
2
, RF performs best
with SD
R
2
of 0.15, followed by models based on T, EVI, P and NDVI, with SD
R
2
of 0.15, 0.16, 0.20
and 0.21, respectively. For the stability of RMSE, NDVI model performs best with SD
RMSE
of 0.48%,
RF model performs second with SD
RMSE
of 1.20%, followed by EVI, T and P with SD
RMSE
of 1.91%,
2.24% and 2.72%, respectively.
Comprehensive consideration of the accuracy and stability, RF is the most suitable inversion
model for grassland cover estimation in the study area.
Table 3. Stabilities in prediction of grassland cover with different models.
Indices Model
Test set
SD
R
2
SD
RMSE
EVI Logarithm 0.16 1.91
NDVI Logarithm 0.21 0.48
P Logarithm 0.20 2.72
T Logarithm 0.15 2.24
EVI, NDVI, P, T RF 0.15 1.20
4. Discussion
Although RF performs highest accuracy and stability than univariate models, and higher than
previous models in this study area (with R
2
of 0.70) constructed by Meng et al. [17], due to the
limitations of factors, there still exists some error and uncertainty for this model. First, because the
limitation of equipment, topography, and traffic conditions, there are always representativeness
problems when matching the sample plots to corresponding pixels [18]. In this study, the UAV is
used to expand the area sample plot, and reduce influences derived from the heterogeneity of the land
surface (using 5-12 photograph represent the 250m ×250m area), however, the heterogeneity cannot
be eliminated completely. The spatial representativeness of ground sampling sites can be enhanced
by increasing the quadrat number and area, improving the range observed from the ground sampling
quadrat, and reducing the error from corresponding spatial matching problem. Further sample
settings are restricted by the hovering time, control distance, and photograph resolution of UAV [7].
With the development of UAV science and technology, the sampling strategy still needs much
improvement. Second, the temporal disparities between the 16d maximum value of the MODIS
vegetation indices and the field-measured biophysical parameters during the period of grass growing
season are unavoidable [19], even with the best efforts. In this study, the rule of data matching
between the field-measured and remote sensing VIs is time closest. Further study should scheme the
Application of Unmanned Aerial Vehicle and Random Forests Model in Alpine Grassland Cover Estimation: A Case Study in the Xiahe
County, China
17

times of field investigations to reduce time differences with satellite image acquisitions [18]. Last,
RF performs the highest accuracy and robustness in this study, but it has obviously limitations, for
RF is based on a large sample decision tree for high-dimensional data training, and has a strong
tolerance for data faults [15], hence it is difficult to effectively train RF models with a small sample
size [20].
5. Conclusions
The following primary conclusions have been reached in this study: (1) grassland cover inversion
models based on single variable have poor accuracy and stability. EVI’s correlation is closest to
grassland cover with R
2
of 0.46. The single variable models can only account for 26% - 46% the
variation in cover during growing season; (2) an important method for improving the accuracy of
cover inversions is machine learning methods. RF model performed better than other univariate
models in our study with R
2
, RMSE of 0.73, 12.11% and SD
R
2
, SD
RMSE
of 0.15, 1.20%, respectively,
in test set. The model can account for 94% of cover variation in study area.
Acknowledgments
This study was supported by the Program for Changjiang Scholars and Innovative Research Team in
University (IRT_17R50), the National Natural Science Foundation of China (31672484, 31702175).
References
[1] Lehnert L W, Meyer H, Wang Y, Miehe G, Thies B, Reudenbach C and Bendix J 2015
Retrieval of grassland plant coverage on the Tibetan Plateau based on a multi-scale,
multi-sensor and multi-method approach. Remote Sensing of Environment 164 197-207
[2] Liang T, Yang S, Feng Q, Liu B, Zhang R, Huang X and Xie H 2016 Multi-factor modeling of
above-ground biomass in alpine grassland: A case study in the Three-River Headwaters
Region, China Remote Sensing of Environment 186 164-172
[3] Feng Y, Cui N, Gong D, Zhang Q and Zhao L 2017 b. Evaluation of random forests and
generalized regression neural networks for daily reference evapotranspiration modelling.
Agricultural Water Management 193 163-173
[4] Dong Y, Lei T, Li S, Yuan C, Zhou S and Yang X 2015 Effects of rye grass coverage on soil
loss from loess slopes. International Soil and Water Conservation Research, 3, 170-182
[5] Gao J and Liu Y S 2010 Determination of land degradation causes in tongyu county, northeast
china via land cover change detection International Journal of Applied Earth Observation
& Geoinformation 12(1) 9-16
[6] Wang P, Deng X and Jiang S 2017 Diffused impact of grassland degradation over space: A
case study in Qinghai province Physics and Chemistry of the Earth, Parts A/B/C 101
166-171
[7] Chen J, Yi S, Qin Y and Wang X 2016 Improving estimates of fractional vegetation cover
based on UAV in alpine grassland on the Qinghai–Tibetan Plateau. International Journal of
Remote Sensing 37 1922-1936
[8] Maresma Á, Ariza M, Martínez E, Lloveras J and Martínez-Casasnovas J 2016 Analysis of
Vegetation Indices to Determine Nitrogen Application and Yield Prediction in Maize (Zea
mays L.) from a Standard UAV Service. Remote Sensing 8 973
[9] Yi S, Chen J, Qin Y and Xu G 2016 The burying and grazing effects of plateau pika on alpine
grassland are small: a pilot study in a semiarid basin on the Qinghai-Tibet Plateau
Biogeosciences 13 6273-6284
[10] Yi S, Zhou Z, Ren S, Xu M, Qin Y, Chen S and Ye B 2011 Effects of permafrost degradation
on alpine grassland in a semi-arid basin on the Qinghai–Tibetan Plateau Environmental
Research Letters 6 045403
IWEMSE 2018 - International Workshop on Environmental Management, Science and Engineering
18

[11] Diouf A A, Hiernaux P, Brandt M, Faye G, Djaby B, Diop M B, Ndione J A and Tvchon B
2016 Do Agrometeorological Data Improve Optical Satellite-Based Estimations of the
Herbaceous Yield in Sahelian Semi-Arid Ecosystems? Remote Sensing 8 668
[12] Ren S L, Shu-Hua Y I Chen J J, Qin Y and Wang X Y 2014 Comparisons of alpine grassland
fractional vegetation cover estimation using different digital cameras and different image
analysis methods. Pratacultural Science 31(6) 1007-1013
[13] Yi S 2016 FragMAP: a tool for long-term and cooperative monitoring and analysis of
small-scale habitat fragmentation using an unmanned aerial vehicle International Journal
of Remote Sensing 1-12
[14] McKenney D W, Pedlar J H, Papadopol P and Hutchinson M F 2006 The development of
1901–2000 historical monthly climate models for Canada and the United States.
Agricultural and Forest Meteorology 138 69-81
[15] Breiman L 2001 Random forests Machine Learning, 45(1) 5-32
[16] Huang J C and Gao J F 2017 An ensemble simulation approach for artificial neural network:
an example from chlorophyll a simulation in Lake Poyang, China. Eco. Inform. 37, 52–58
[17] Meng B P, Cui X, Yang S X, Gao J L, Hu Y N, Chen S Y and Liang T G 2016 Scaling-up
methodology for alpine grassland coverage monitoring based on Landsat 8 OLI and
MODIS remote sensing data: A case study in Xiahe Sangke grassland Acta Prataculturae
Sinica 25(7): 1-12
[18] Meng B P, Ge J, Liang T, Yang S, Gao J, Feng Q, Cui X, Huang X and Xie H 2017 Evaluation
of Remote Sensing Inversion Error for the Above-Ground Biomass of Alpine Meadow
Grassland Based on Multi-Source Satellite Data. Remote Sensing 9, 372
[19] Eisfelder C, Kuenzer C and Dech S 2012 Derivation of biomass information for semi-arid
areas using remote-sensing data Int. J. Remote Sens. 33 (9) 2937–2984
[20] Deng H, Runger G and Tuv E 2011 Bias of importance measures for multi-valued attributes
and solutions, In Proceedings of the International Conference on Artificial Neural
Networks,Espoo Finland 14–17 June 2011;293–300
Application of Unmanned Aerial Vehicle and Random Forests Model in Alpine Grassland Cover Estimation: A Case Study in the Xiahe
County, China
19
