
The Differences of the Result of Copper Test Using UV-Vis
Spectrophotometry with Neocuproine Complexing Agent and AAS
Indah Sari
1
, Rima Merdaliani
1
, Pra Dian Mariadi
2
and Rosnita Sebayang
2
1
Forensic Science Depertement, University of Airlangga, Airlangga Street, Surabaya, Indonesia
2
Lecture, University of Catholic Musi Charitas, Palembang, Indonesia
Keywords: Copper, UV-Vis Spectrophotometry, Atomic Absorption Spectrophotometry
Abstract: Copper is a hazardous heavy metal and often pollutes the environment that may degrade the water quality.
This study is a comparative study, conducted in Baristand Industry Laboratory of Palembang. The samples
are SRM (Standard Reference Material) based on the standard working ranges that are made from pure
copper products from NIST (National Institute of Standards and Technology). The samples are assigned into
three points 0.5 ppm; 1 ppm; and 2 ppm from the standard working range. Data of the study differences of
copper examination results using UV-Vis Spectrophotometry with neocuproine complexing agent and
Atomic Absorption Spectrophotometry were analyzed by independent t-test. Levels of the three samples of
UV-Vis Spectrophotometry method were 0.5021 ppm; 1.0298 ppm; and 2.0109 ppm, respectively while
level of the three samples of Atomic Absorption Spectrophotometry method were 0.4803 ppm; 0.9957 ppm;
and 2.0024 ppm, respectively. Result of independent t-test exhibited the sig (2-tailed) value of p = 0.974
with the average difference of 0.0214667. Obtained p value was p > 0.05. Based on this study, it can be
concluded that there are no difference of copper examination results using UV-Vis Spectrophotometry with
neocuproine complexing agent and Atomic Absorption Spectrophotometry.
1. INTRODUCTION
Health laboratory is a health facility that performs
measurement, determination and testing of human-
derived materials or non-human derived materials
for the determination of diseases, health conditions
or factors that may affect the health individual and
society according to KEPMENKES RI No: 364/
MENKES/SK/III/2003.
Laboratory services in Indonesia are currently
being held in various types and levels of services,
such as in Puskesmas (Government Primary Health
Care Service) Laboratories, Regency/Municipal
Health Laboratories, Regency/Municipal Hospitals,
Public and Private Hospitals, Private Clinical
Laboratories, Central Laboratory of Health (BBLK)
and Health Laboratory Center (BLK) according to
KEPMENKES RI No: 1792/MENKES/SK/XII/
2010.
The types of health laboratories based on
services consists of clinical and public health
laboratories. Public health laboratory is a laboratory
which conducts examination services in the field of
microbiology, physics, chemistry and or other fields
related to public health interest and environmental
health, especially to support prevention of disease
and improvement of public health in accordance to
KEPMENKES RI No: 364/MENKES/SK/III/2003.
The chemical field consists of Aluminium (Al),
Iron (Fe), Hardness, Chloride (Cl), Manganese
(Mn), pH, Zinc (Zn), Sulphate (SO4), Ammonia
(NH3) and Copper (Cu) level assessment. Cu plays
an important role in the formation of red blood cells,
release of iron from the tissues, formation of bone
and central nervous system and other connective
tissues. Cu is also a component of certain enzymes.
United States of America assigned a safe ingested
level of Copper as 1.5 - 3.0 mg a day (Almatsier,
2009). Excess amount of copper will cause gastric
irritation, capillary blood vessel damage, damage of
liver, kidney and nerve tissues resulting in
depression (Windri, 2011).
Techniques used for metal examinations include
Atomic Absorption Spectrophotometry (AAS) and
UV-Vis Spectrophotometry. AAS is an expensive
sophisticated tool and not all laboratories possess it
while UV-Vis Spectrophotometry is the most
convenient technique due to its availability of
Sari, I., Merdaliani, R., Mariadi, P. and Sebayang, R.
The Differences of the Result of Copper Test Using UV-Vis Spectrophotometry with Neocuproine Complexing Agent and AAS.
DOI: 10.5220/0007542703510355
In Proceedings of the 2nd International Conference Postgraduate School (ICPS 2018), pages 351-355
ISBN: 978-989-758-348-3
Copyright
c
2018 by SCITEPRESS – Science and Technology Publications, Lda. All rights reserved
351
instrumentation, simplicity, speed, precision,
accuracy, and low cost (Tehrani et al., 2014).
Copper determination can be conducted by
atomic absorption spectrophotometry (AAS).
Several studies had determined Cu levels in samples
such as Windri (2011), Listiowati et al., (2011) and
Sa'adah and Winata (2010) that examinied Cu levels
in samples using AAS.
Another method in addition to AAS is UV-Vis
Spectrophotometry which use a variety of
complexing agents. Applicable complexing agents
are 6- (2-Methoxynaphthyl) -2,3-dihydro-1,2,4-
triazine-3-thione that was carried out by Tehrani et
al. (2014), Ligan (2- [6-Nitro -2-benzothiazolylazo]
-4-hydroxy benzoic acid) that was carried out by
Jreo (2015) and neocuproine that was carried out by
Itnawita and Bali (2012).
Copper (Cu) examination using UV-Vis
Spectrophotometry with neocuproine complexing
agent (American Public Health Association) and
Atomic Absorption Spectrophotometry (SNI 06-
6989.6-2004) are well established and standardized
methods. Validation is usually performed for newly
manufactured and developed analytical methods,
whereas for available and standardized methods (e.g.
from AOAC, ASTM, and others) in exception for
the first time use in certain laboratories, validation is
usually unnecessary, only verification is required.
Verification of analysis method is a method
validation measure, an assessment of certain
parameters aimed to prove that the parameters meet
the requirements for its application. Parameter
verification methods include: linearity, detection and
quantitative limit, accuracy, and precision
(Anggraini, 2016). Based on description above, the
authors aim to find the difference of copper (Cu)
examination results using UV-Vis
Spectrophotometry with neocuproine complexing
agents and Atomic Absorption Spectrophotometry
(AAS) in which method verification will be
performed.
2. SUBJECT AND METHODS
This study was conducted in Balai Riset and
Standarisasi Industri (BARISTAND) from April 09
to May 03, 2017. The samples in this study were
made using SRM based on the standard working
range that were made from pure Copper (Cu)
products from NIST (National Institute of Standards
and Technology). The standard working range of
UV-Vis Spectrophotometry were 0.0; 0.4; 1,2; 2.0;
2.8; and 3.6 ppm (Standard Method, 2005) while
Atomic Absorption Spectrophotometry were 0.0
ppm; 0.2 ppm; 0.5 ppm; 1 ppm; 2 ppm; 3 ppm and 4
ppm (SNI 06-6989.6-2004). Water samples were
taken at three points 0.5 ppm; 1.0 ppm; and 2.0 ppm.
This study is a comparative study. The
examination methods used in this study is UV-Vis
Spectrophotometry with neocuproine complexing
agent and Atomic Absorption Spectrophotometry
(AAS).
3. RESULTS AND DISCUSSION
3.1 Verification of UV-Vis
Spectrophotometry and AAS
Methods
Method verification is a reconfirmation measure by
testing a method by completing objective evidences,
whether the methods meet the established
requirements and fit the objectives.
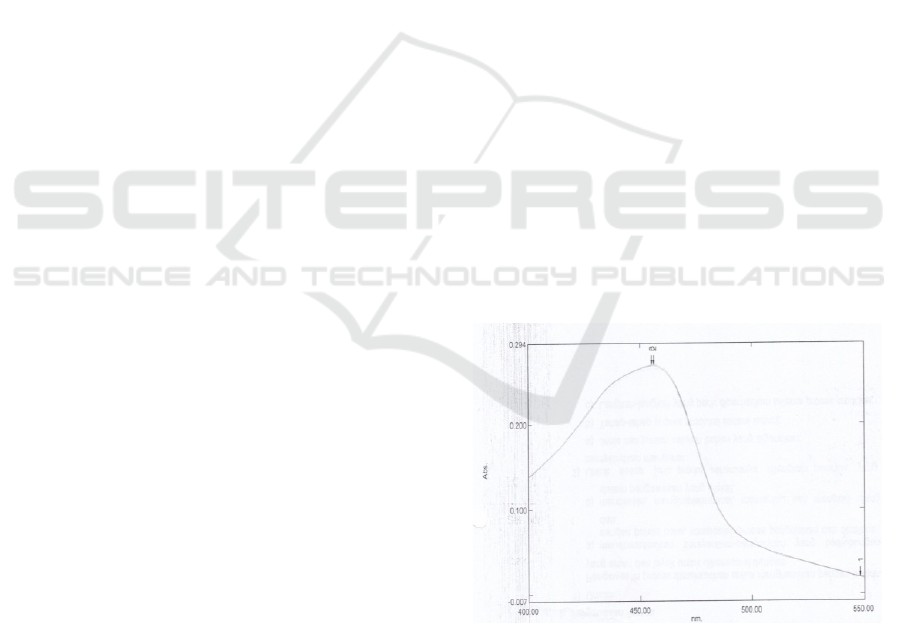
3.1.1 Determination of Wavelength on UV-
Vis Spectrophotometry
Determination of wavelength was conducted by
measuring the absorbance of copper standard
solution of 2 ppm concentration in the wavelength
range of 400 – 550 nm. The results of maximum
wavelength measurements were presented in Figure
1.
Figure 1: UV-Vis Spectrophotometry Wavelength Curve
Based on above figure of wavelength spectrum, a
wavelength of 456 nm was obtained. Wavelength
range for copper examination using UV-Vis
spectrophotometry with a neocuproine complexing
agent is 450 – 460 nm (American Public Health
Association).
ICPS 2018 - 2nd International Conference Postgraduate School
352
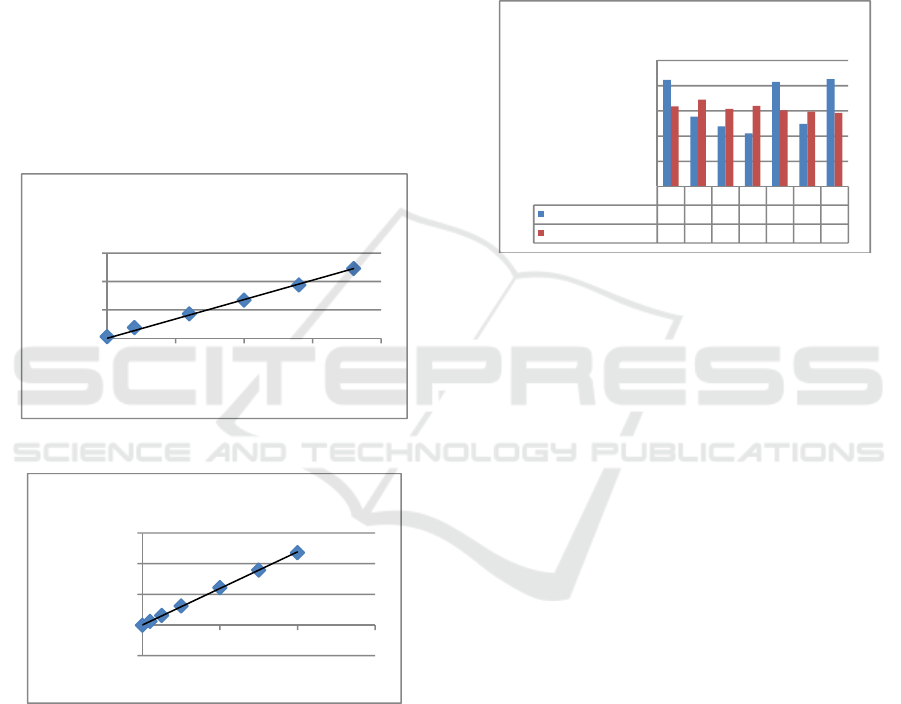
3.1.2 Linearity
Method linearity is used to determine the standard
capability, so it can prove a linear relationship
between the analytical concentration and the
detector response (Wardani, 2012).
Linearity test is obtained by making standard
curve of copper examination conducted by making a
series of copper standard solution with various
concentrations of UV-Vis Spectrophotometry at 0;
0.4; 1,2; 2; 2.8; and 3.6 ppm whereas of AAS at 0;
0.2; 0.5; 1; 2; 3; and 4 ppm, made from a 1000 ppm
solution. Solutions were diluted to 20 ppm for UV-
Vis Spectrophotometry and 10 ppm for AAS then
each standard solution was read on UV-Vis
Spectrophotometer and AAS devices. The results of
the copper linearity curve using UV-Vis
Spectrophotometry can be seen in Figure 2 below.
Figure 2: Standard Curve of UV-Vis Spectrophotometry
Figure 3: Standard Curve of AAS
The absorbance value seen on the standard curve
of copper examination using UV-Vis
Spectrophotometry was y= 0,136x with linear
regression of r= 0.995. The absorbance value seen
on the standard curve of copper examination using
AAS was y= 0.119x with linear regression of r=
0.999. Both linear regression values (r) have met the
established requirements of r > 0.995 (Wardani,
2012).
3.1.3 Accuracy
Meticulousness is expressed as a percent return of
added analytics and the value of precision can be
expressed by percent recovery (Wardani, 2012). The
accuracy test was conducted by adding 1 ppm
concentration of copper standard solution into 1 ppm
copper sample, subsequently read using UV-Vis
Spectrophotometer and AAS % recovery then
calculated.
Figure 4: Copper Accuracy Examination
The average % recovery with 7 times
measurements is 95.98% in UV-Vis
Spectrophotometry and 95.57% in AAS. The result
of this retrieval test has met the precision of the
predetermined requirements. The recovery results
for the analytic in1 ppm matrix (%) sample, the
accepted recovery (%) was in the range of 80 -
110% (Wardani, 2012). Thus, the results of this
retrieval tests on both methods have met the
prescribed conditions based on the acceptable
recovery range.
3.1.4 Precision
Precision is a measure indicating the degree of
conformity among individual test results, measured
by distribution of individual results from the mean if
the procedure is applied repeatedly to the samples
taken from a homogeneous mixture. Precision is
measured based on standard deviation or relative
standard deviation (Riyanto, 2014). Precision test
was conducted by measuring standard copper
solution of 2 ppm concentration 7 times. The
precision test was obtained by calculating the value
of % relative standard deviation (% RSD).
y = 0.136x
R² = 0.995
0
0,2
0,4
0,6
01234
Abs.
Conc. (ppm)
Standard Curve of UV-Vis
Spectrophotometry
y = 0,1192x
R² = 0,9995
-0,2000
0,0000
0,2000
0,4000
0,6000
0246
Abs.
Conc. (ppm)
Standard Curve of AAS
1234567
UV-Vis Spectrophotometry
101,1393,84%91,93%90,55%100,7492,39%101,28
AAS
95,87%97,23%95,37%95,96%95,11%94,86%94,60%
80,00%
85,00%
90,00%
95,00%
100,00%
105,00%
% Recovery
Accuracy
The Differences of the Result of Copper Test Using UV-Vis Spectrophotometry with Neocuproine Complexing Agent and AAS
353
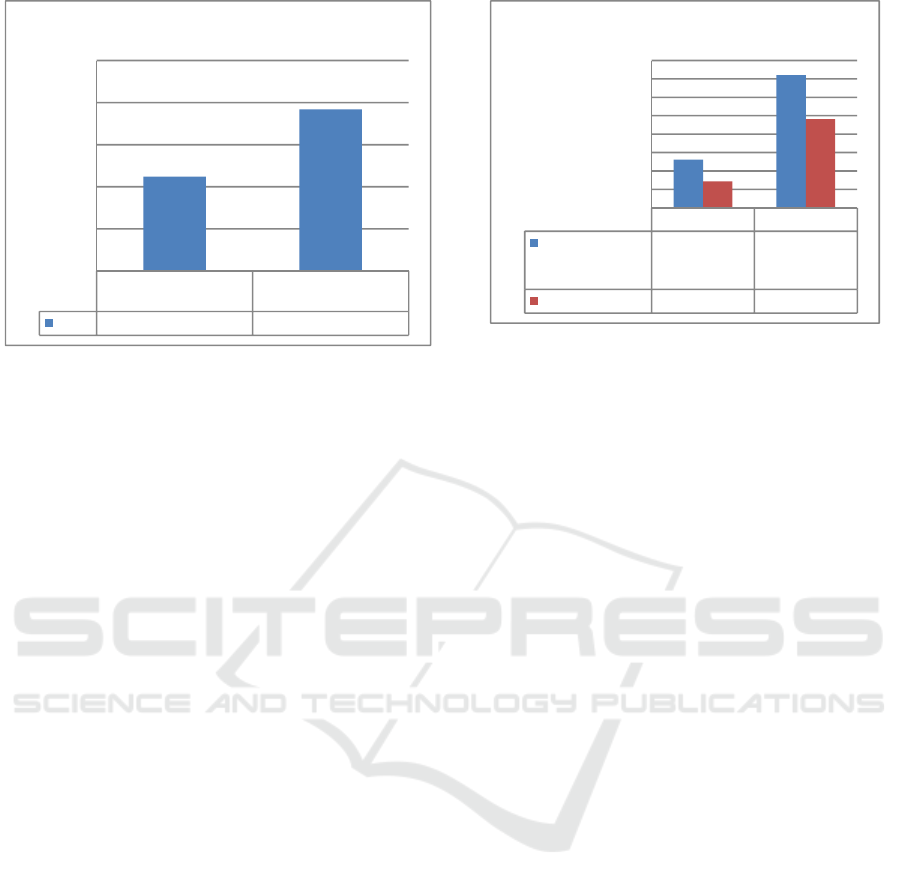
Figure 5: Precision of copper examination
Obtained %RSD was 1.12% in UV-Vis
Spectrophotometry and 1.92% in AAS. The result of
this precision tests indicated that both methods have
met the precision criteria. Precision criteria are given
if the method provide a relative standard deviation
(RSD) or a coefficient of variation (CV) of 2% or
less (Riyanto, 2014). The results of the second
precision test of this method showed that the
obtained accuracy is precise i.e. 1% < RSD ≤2%
(Wardani, 2012).
3.1.5 LOD and LOQ
LOD is the smallest amount of detectable analytic in
the sample and still provide a significant response
compared to the blank, while LOQ is the smallest
amount of analytic in the samples that still meet the
accuracy and precision criteria and quantifiable with
good accuracy and precision (Wardani, 2012).
LOD and LOQ tests were performed by
measuring the absorbances of the smallest copper
solution of 0.4 ppm for UV-Vis Spectrophotometry
and 0.2 for AAS. LOD and LOQ values were
calculated from regression equation of the obtained
copper standard calibration curve.
Figure 6: LOD and LOQ of copper examination
Obtained LOD and LOQ values in UV-Vis
Spectrophotometry were 0.0216 and 0.0720,
respectively while in AAS were 0.0144 and 0.0481.
Level below 0.0216 was no longer detectable by
UV-Vis Spectrophotometry and level below 0.0144
was no longer detectable by AAS, it is known that
AAS has smaller LOD than UV-Vis
Spectrophotometry so that AAS remains capable of
detecting very small samples. The LOD and LOQ
values met the specified requirements as no sample
levels were below the LOD and LOQ values.
3.2 Copper Examination on Samples
Examination of copper in this study was conducted
using two methods: UV-Vis Spectrophotometry with
neocuproine complexing agent and AAS using
aquadest solvent. Copper examination was
conducted simultaneously on the same day and time
for each sample, using a double beem UV-Vis
Spectrophotometry and AAS, as well as glass
apparatus including a separating funnel used for
extraction in UV-Vis Spectrophotometry.
Samples made from SRM were heated by adding
concentrated nitric acid performed in a fume hood.
After heating in the Spectrophotometry UV-Vis
method, neocuproine was added then extracted using
chloroform and the extract was subsequently diluted
using methanol, whereas in the AAS method, the
sample filtered using filter paper and diluted using
aquadest. Sample examination results of UV-Vis
Spectrophotometry and AAS were shown in figure 7
UV-Vis
Spectrophotometry
AAS
% RSD
1,12% 1,92%
0,00%
0,50%
1,00%
1,50%
2,00%
2,50%
Precision
LOD LOQ
UV-Vis
Spectrophotometr
y
0,0261 0,0720
AAS
0,0144 0,0481
0
0,01
0,02
0,03
0,04
0,05
0,06
0,07
0,08
LOD and LOQ
ICPS 2018 - 2nd International Conference Postgraduate School
354
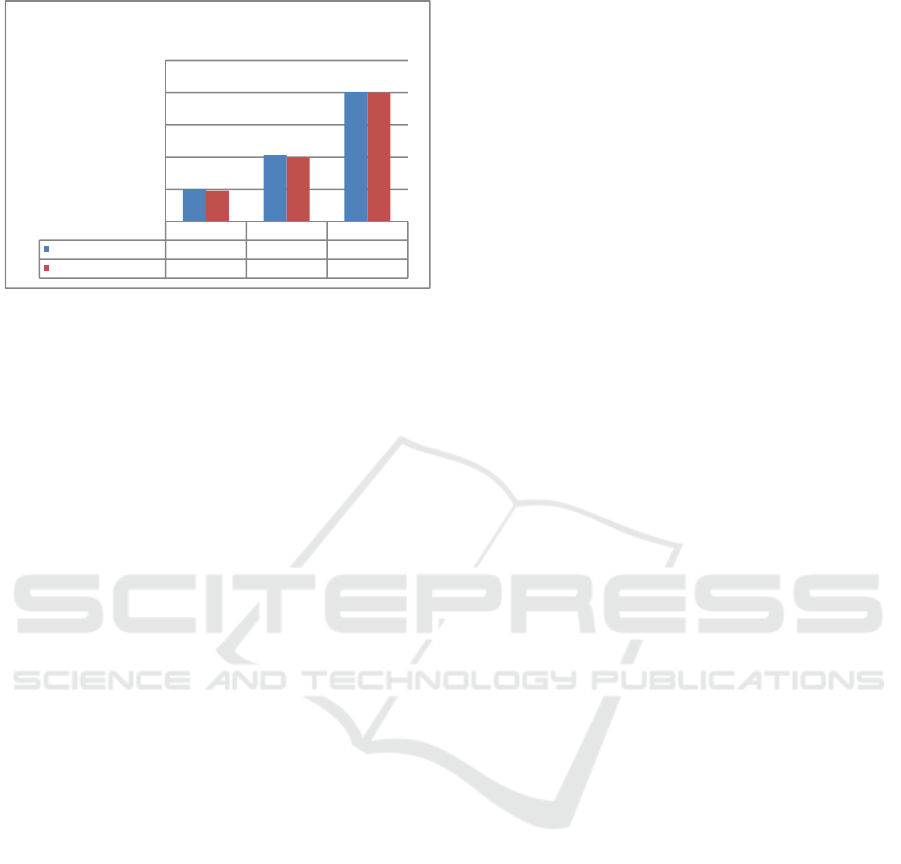
Figure 7: Copper examination result of samples
Above figure showed that the results of copper
examination on the three samples using UV-Vis
Spectrophotometry and AAS methods exhibited
relatively no different results.
4. CONCLUSIONS
There are no difference in copper (Cu) examination
results using UV-Vis Spectrophotometry with
neocuproine complexing agent and AAS.
5. SUGGESTION
A one-time extraction and two-time extraction
differences are required in copper examination using
UV-Vis Spectrophotometry with neocuproine
complexing agent. Copper examinations using
samples taken from nature, for example: river water,
well water and wastewater are necessary.
REFERENCES
Almatsier, S., 2009. Prinsip dasar ilmu gizi. Jakarta: PT
Gramedia Pustaka Utama.
Anggraini, D., 2016. Kajian kandungan logam berat
Kadmium (Cd) dan Kromium (Cr) pada kerang bulu
(Anadara antiquata), kerang darah (anadara
granosa), dan kerang hijau (perna viridis) di pesisir
teluk lampung secara spektrofotometri serapan atom.
Universitas Bandar Lampung.
American Public Health Association., 1992. Standard
methods for the examination of water and wastewater
D, Riyanto Ph., 2014. Validasi dan verifikasi metode uji.
Yogyakarta: Penerbit Deepublish.
Eaton AD, Clesceri LS, Rice EW, Greenberg AE., 2005.
Standard method for the examination water and waste
water 14 th edition. Centennial Edition.
Itnawita., dan Bali, S., 2012. Analisis tembaga, seng dan
pH dalam air minum PDAM cabang Bengkalis:
Health care 2 (1): 34 – 3 8.
Jreo, AM., 2015. Preparation and analytical studying of
ligand (NO
2
BTAHB) with (Cu) – ion: Research J.
science and tech 7 (1): 01 – 08.
Keputusan Menteri Kesehatan Republik Indonesia Nomor
1792/MENKES/SK/XII/2010 tentang Pedoman
Pemeriksaan Kimia Klinik.
Keputusan Menteri Kesehatan Republik Indonesia Nomor
364/MENKES/SK/ III/2003 tentang Laboratorium
Kesehatan.
Listiowati., Rahayu, WS., Utami, PI., 2011. Analisis
cemaran tembaga dalam air sumur industri pelapisan
emas di kota Tegal dengan metode spektrofotometri
serapan atom: Pharmacy 8 (3).
Sa’adah, E., Winata, AS., 2010. Validasi metode
pengujian logam tembaga pada produk air minum
dalam kemasan secara Spektrofotometri serapan Atom
Nyala: Biopropal industri 01 (02): 31 – 37.
SNI 06-6989.6-2004 Cara uji tembaga (Cu) dengan
Spektrofotometri Serapan Atom (SSA)-nyala.
Tehrani, MB., Ghanbari, H., Souri, E., Shamsa, F., Amini,
M., 2014. Synthesis of 6-(2-Methoxynaphthyl)-2,3-
dihydro-1,2,4-triazine-3-thione as a new reagent for
spectrophotometric determination of copper:
International journal of analytical chemistry.
Wardani, LA., 2012. Validasi metode analisis dan
penentuan kadar vitamin C pada minuman buah
kemasan dengan spektrofotometri UV-Vis. Universitas
Indonesia.
Windri, RE., 2011. Analisa kandungan Cu (II) dengan
SSA dan ion sulfat dengan spektrofotometer sinar
tampak pada air baku dan air minum isi ulang di kota
Pekanbaru. Universitas Islam Negeri Sultan Syarif
Kasim Riau.
Sample 1 Sample 2 Sample 3
UV-Vis Spectrophotometry
0,5021 1,0298 2,0109
AAS
0,4803 0,9957 2,0024
0
0,5
1
1,5
2
2,5
Abs.
Cooper Examination Result of Samples
The Differences of the Result of Copper Test Using UV-Vis Spectrophotometry with Neocuproine Complexing Agent and AAS
355
