
Mandibular Image Segmentation on the CT-Scan of the head
using the Active Contour Method
Amillia Kartika Sari
1
, Riries Rulaningtyas
2
and Khusnul Ain
2
1
Postgraduate School, Airlangga University, Surabaya, Indonesia
2
Science and Technology Faculty, Airlangga University, Surabaya, Indonesia
Keywords : Image Segmentation, Active Contour Method, Mandibular, CT-Scan
Abstract : Image segmentation is one of the image processing methods with the goal of sharing the image based on
uniformity, one of which is the active contour method. This method is to detect objects on a particular
image by using curve evolution techniques, and can also overcome the deficiencies in the boundary method.
In this study image segmentation was carried out using the active contour method to evaluate the mandible
on the head CT scan. It started with a CT-Scan of the head as input data, and saved with BMP (Bitmap)
format. Then initial contour mandible, and after that the next step is image segmentation with active
contour chan-vese method. From the analysis and evaluation of 108 images of the mandible with *BMP
(Bitmap) format we get to the average accuracy values which were 99.809%, and sensitivity value of
99,806%. The conclusion of this study is that the active contour method gives accurate results of mandibular
bone segmentation on the CT scan of the head.
1 INTRODUCTION
The mandible is the bone that forms the face of a
p
erson, especially the lower third. Like other organs,
the mandible may develop abnormalities such as
tumors, fractures,
or dislocations. Tumor
abnormalities in the mandible may result in bone
defects. Bone defect is a state of partial or complete
loss of bone, which can cause changes in bone
function and anatomy that negatively impact by
psychological weakness and reduced confidence in
social relations
1,2
.
Therefore, mandibular reconstruction surgery is
recommended
immediately. O
ne thing that can be
done to optimize surgical operations is to use a 3D
prototype of the dissected organ. It aims to assess
the severity of bone defects, improve the accuracy of
marginal resection, as an implant pre-contour plate,
and can reduce surgical time
3,4
.
3D prototypes are the result of the printing
technology of 3-dimensional objects from
combining several materials such as plastics,
polymers, ceramics, liquids and living cells. Stages
to obtain 3D prototypes are image acquisition, image
processing, and prototype printing. For image
acquisition, data input is a digital image obtained
from radiology as a CT-scan image. In this study a
CT scan of the head is used.
After obtaining digital image data, image
processing is carried out, namely the segmentation
process. The image segmentation is the process of
dividing an image into a number of parts
5
. Many
methods are used in the image segmentation
processes, one of which is Active Contour. This
method uses evolutionary curve techniques to detect
objects in images
6
. The nature of this method is
finding the boundary or edge of the object becomes
segmented from the influence of internal energy and
external energy. Internal energy regulates continuity
while external energy functions to draw a curve to
the edge of the target
7
.
The Active Contour Method is divided into two
groups: parametric and geometric. Parametric
methods commonly known as deformable can
segment objects with a clear boundary, one of which
is the Snake Active Contour Model. While
geometric method is the method that has the ability
to segment objects with unclear boundaries, one of
which is the Active Contour Level set model. In this
study we used an active contour geometric with
Chan-Vese model.
Kartika Sari, A., Rulaningtyas, R. and Ain, K.
Mandibular Image Segmentation on the CT-Scan of the head using the Active Contour Method.
DOI: 10.5220/0007541703010305
In Proceedings of the 2nd International Conference Postgraduate School (ICPS 2018), pages 301-305
ISBN: 978-989-758-348-3
Copyright
c
2018 by SCITEPRESS – Science and Technology Publications, Lda. All rights reserved
301

1.1 Active Contour Chan-Vese Model
One of the geometric active contours is the Chan-
Vese Method, in this method the process to
minimize energy is based on Region Base models
8
.
Introduced by T. Chan and L. Vese in 2001, this
model is an improvement from the edge based
model because edge detection in an image based on
curve evolution technique, Mumford-shah function
for segmentation and level set
9
. This is because
detection using an image gradient is less effective,
because discrete gradient is limited and the stop
function is not null at an edge and allows the curve
to cross the existing boundary.
In Chan-Vese (C-V) models, contour initiation
can be done anywhere in the image and the C-V
model will automatically detect the entire contour,
regardless of the location of contour initials
10
.
Chan-Vese active contour method assumes images
are formed from two parts. Assumed f (x, y) as a
gray-level image with the domain W. Domain W
can be divided into several parts W
i
along the
boundary C. If it is assumed that there are only
two parts, those in C are called W
1
and those
outside C are called W
2
. So the energy model
equation is shown in the equation 1
11
,
12
22
12
() () |(,) | |(,) |
ss
ww
F
C F C Ixy I dxdy Ixy I dxdy+= − + −
∫∫
(1)
In the equation above what is needed is the right
C value, so that the Pas Energy value becomes
minimal (equation 2)
11
as in Figure 1,
12
inf{() ()} 0FC FC+=
(2)
Figure 1: the C curve is outside the object if F1 (C)> 0 and
F2 (C) = 0.
If the C curve is inside the object it means F1 (C)
= 0 and F2 (C)> 0, whereas if Curve C is inside and
outside the object means F1 (C)> 0 and F2 (C)> 0.
Until finally the energy fitting will be minimized if C
= 0
12
For the practicality of the Fitting Energy model,
equation (2) is minimized by a regular equation such
as the length (length) of the C curve and the area in
the C curve to become equation (3)
11
1
2
11
2
2
2
(,) . () . ( ) |(,) |
|(,) |
s s
w
s
w
F
I C Length C Area W I x y I dxdy
I x y I dxdy
μυλ
λ
=++−+
−
∫
∫
(3)
With μ≥0, ʋ≥0, and λ1, λ2> 0 is a fixed
parameter. In the first term, functional energy F
controls the length of the contour that describes the
target object. The weight of μ in this equation helps
form a smooth boundary. Same with weight ʋ forces
the total area of the foreground part of W
1
to be
found in the segmentation process. Whereas the
third and fourth are proportions for the gray level
difference in the foreground and the background to
be detected.
The solution of the Is value can be approximated
by the Mumford-Shah segmentation function shown
in equation (4)
11
,
1
2
average( )of
average( )of W
{
IW
s
I
I =
(4)
In the Chan-Vese active contour model, level-set
functions are introduced to reduce functional energy
F (c1, c2, C). The level-set function Φ is defined as
the zero level-set in the Lipschitz function (equation
5-7)
11
,
1
(){(,) :(,)0},Inside W x y W x y=∈Φ<
(5)
2
( ) {(,) : (,) 0},Inside W x y W x y=∈Φ>
(6)
{(,) : (,) 0}CxyWxy=∈Φ=
(7)
According to Crandall (2009), the completion of
the Fitting Energy function is changed to a level-set
function Φ using the Euler-Langgrange equation so
that the iteration calculation can be done by solving
equation (8)
13
,
2
11
2
22
() ( )[ ( ,( , ) )
||
(,(, ) )
td di Ixyc
dt
Ixy c
φφ
φδφμυυλ
φ
λ
⎛⎞
∇
== −− −+
⎜⎟
∇
⎝⎠
−
(8)
To solve the equation (2.8) it must be discredited
first, e.g.
,
n
ij
φ
denoted as the value of the level-set
function Φ in the pixel (i, j) in the iteration n
(equation (9))
13
,
ICPS 2018 - 2nd International Conference Postgraduate School
302
,1,, ,,1,
,,1, ,,,1
,
,
xn n n xn n n
ij i j ij ij ij i j
yn n n yn n n
ij ij ij ij ij ij
φφ φ φφφ
φφ φ φφφ
++ − −
++− −
Δ= −Δ=−
Δ= −Δ=−
(9)
2 MATERIALS AND METHOD
A computer with AMD Turion (tm II) Dual Core
2.30 Gz / 2.0 GB RAM and the Matlab application
(R2017a, MathWorks Inc., USA) was used in this
study for simulation and analysis data. The image
used is the image of the CT scan head with a
512x512 matrix size from the Brilliance CT 64
Channel (Philips medical system, Netherlands). The
parameters used on the CT scan head are slice
thickness of 2 mm, DFOV 360 mm, a voltage of 120
kVp and a tube current of 297 mA.
This study stage begins by collecting CT Scan
images, then converts them to files with BMP
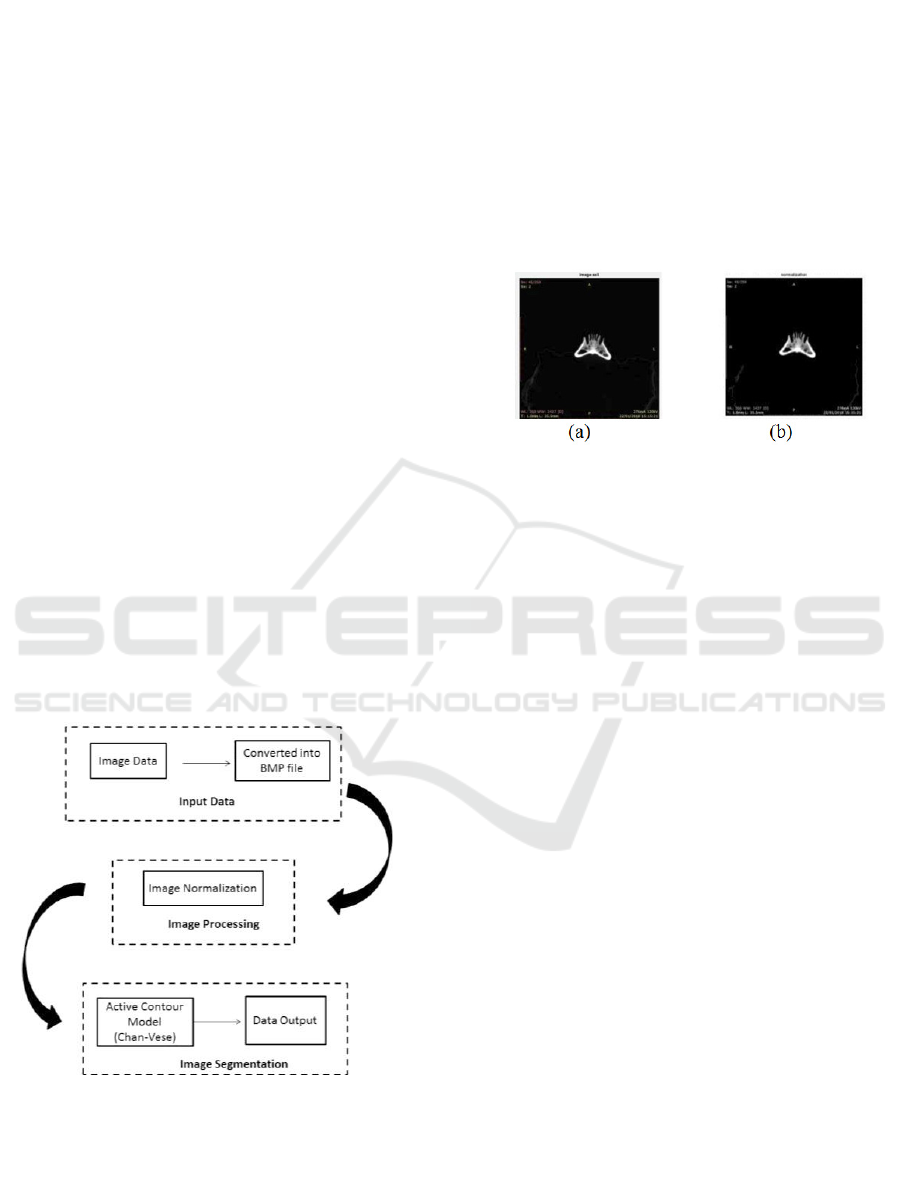
extension (Bitmap), the data is called input data. The
next stage is image processing where normalization
will be carried out by converting input data into gray
scale images, with the aim of achieving uniformity
of pixel intensity. And the last stage is the process
of segmentation with the chan-vese model active
contour. Image results from the segmentation
process will be tested with images that are manually
segmented by experts (doctors). A flowchart of this
study can be seen in Figure 2.
Figure 2: Flowchart of the study.
.In this study the work system is divided into
several stages, namely input system, image
processing and segmentation process.
2.1 Input Data
In the input system, CT scan data is obtained from
scanning the head with the upper boundary of the
vertex and lower limit of the base of the cranial
using the MDCT 64 Slice modality (Figure 3). Data
formats from CT scan have extensions *DICOM and
are then converted into a file with *BMP format
with a matrix size of 512 x 512. The process of
converting *DICOM format to *BMP is done
through the Radiant Dicom application program.
Figure 3: (a) Input data of Mandible CT, (b) Image data after
normalization.
2.2 Image Processing
After obtaining an image with BMP file format, the
next process is image normalization. This process
aims to change the pixel intensity of values. The
initial pixel intensity value ranges from 22-255 to 0-
255 (Figure 3).
The result of normalization is an image that has a
gray level with an intensity range of 0-255. Image
segmentation is the next step.
2.3 Segmentation Process
The segmentation system stages using Chan-Vese
active contours are as follows:
1. Determine the control parameter initialization,
weights or constants of both internal energy and
external energy.
2. Determine the edge image as external energy by
determining the image gradient.
3. The next step is to determine the initial contour,
adjust the initial contour according to the original
image (Figure 4a-4b).
4. And determine total energy value.
5. If the total energy has reached the minimum, the
iteration will stop and will form a contour
according to the input data (Figure 4c).
6. Segmentation results are output data.
Mandibular Image Segmentation on the CT-Scan of the head using the Active Contour Method
303
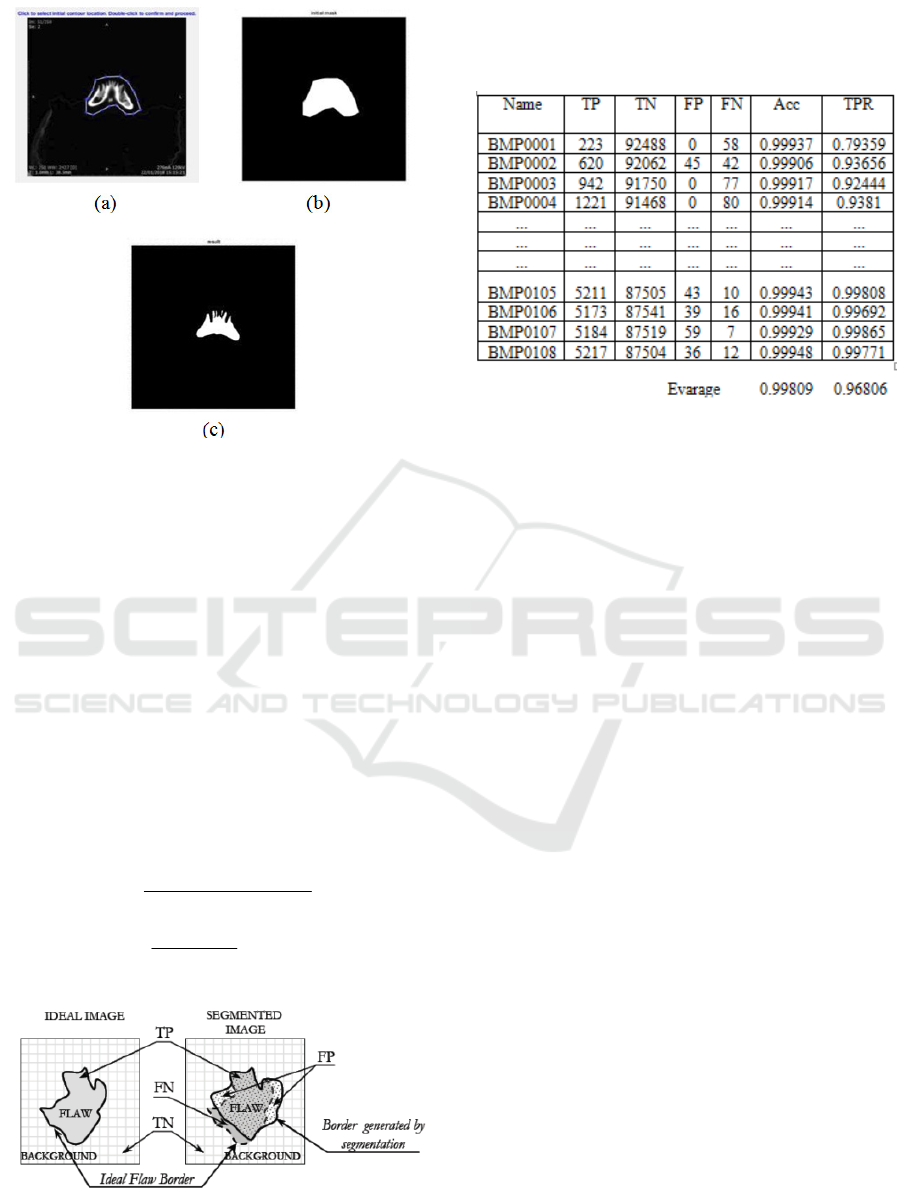
Figure 4: (a) select initial contour, (b) result initial
contour, (c) result post segmentation process.
3 RESULT
The image data used in this segmentation process is
108 images. The analysis used in this study is by
comparing program segmentation results with results
of expert segmentation (doctor). From this
comparison value will be obtained, TP: True
Positive, FN: False Negative, TN: True Negative,
and FP: Wrong Positive, which is calculated based
on the number of pixels (Figure 5). Based on this
analysis we can measure the value of sensitivity and
accuracy with the equation (9-10) (Table 1).
Accuracy=
()
()
100%
TP TN
Acc x
TP TN FP FN
+
=
+++
(9)
Sensitivity:
()
100%
TP
TPR x
TP FN
=
+
(10)
Figure 5. Analysis method of segmentation results data
Table 1: Result of accuracy and sensitivity data
From the above calculations it can be seen that
with image segmentation using the Chan-Vese
active contour method, the average accuracy value is
99.809% and the sensitivity value is 96.806%.
4 DISCUSSION
Image segmentation method is proposed using the
method of active contour, as active contours always
provide sustainable sub-region boundaries, so as to
increase the final results of the image analysis.
Mathematical implementation of the proposed active
contour models is achieved using the level set
method. The proposed image segmentation of this
method allows us to increase the detection of
mandibular bone in the image of the CT scan of the
head.
In this study the segmentation program has not
been able to distinguish solid and hollow bone tissue
considering the bone structure is not all solid. And
as this study is still using only one patient, it is
expected that further research can use more data.
5 CONCLUSION
Referring to the level of accuracy segmentation
results, the results of this study are quite accurate
and can be used as an alternative method of
mandibular bone segmentation on CT scan images to
be used as data input in the subsequent process of
making a 3-dimensional mandibular prototype for
mandibular reconstructive surgery.
ICPS 2018 - 2nd International Conference Postgraduate School
304

REFERENCES
Szplaski C, Wetterau M, Barr J, Saadeh P, Warren S.
Cranial bone defect: Current and Future Strategies.
Neurosurg Focus. 2010;29:1-11.
doi:10.3171/2010.9.FOCUS10201
Aydin S, Kucukyuruk B, Sanuz G. Cranioplasty: Review
of Material and Techniques. Neurosci Rural Pr.
2011;2:162-167. doi:10.4103/0976-3147.83586
Oliveira GDE, Silva DN, Meurer E, Ine M. Dimensional
error in selective laser sintering and 3D-printing of
models for craniomaxillary anatomy reconstruction *.
2008:443-449. doi:10.1016/j.jcms.2008.04.003
Yang L, Shang X, Fan J, et al. Application of 3D Printing
in the Surgical Planning of Trimalleolar Fracture and
Doctor-Patient Communication. 2016;2016.
Gonzalez R., Woods R. Digital Image Processing Using
MATLAB. (Prentice-Hall P, ed.). New Jersey,USA:
Pearson Education, Inc.; 2004.
Airouche M, Bentabet L, Zelmat M. Image Segmentation
Using Active Contour Model and Level Set Method
Applied to Detect Oil Spills. Proc World Congr Eng.
2009;1(1):1–3.
Bakos. Active Contour and Their Utilization at Image
Segmentation Technical. Slovakian-Hungarian Jt
Symp Appl Mach Intell ang Inform. 2007:313-317.
Apriliani D, Murinto. Analisis Perbandingan Teknik
Segmentasi Citra Digital Menggunakan Metode Level
Set. 2013;7(2):802-810.
Cohen R. The Chan-Vese Algorithm. 2010:1-18.
Li S, Z. Markov Random Field Modelling in Image
Analysis. Springer. 2009.
Sohn K. Segmentation of Lung Fields Using Chan-Vese
Active Contour Model in Chest Radiographs. In: SPIE
7963.
Chan TF, Vese LA. Active Contours Without Edges.
2001;10(2):266-277.
Crandall R. Image Segmentaion Using the Chan-Vese
Algorithm. In: ; 2009.
Mandibular Image Segmentation on the CT-Scan of the head using the Active Contour Method
305
