
Crystal Plastic Finite Element Simulation and Texture
Analysis of Aluminum
J S Qi, Z M Yue
*
, K Cao, Y S Li and J Gao
School of Mechanical, Electrical and Information Engineering, Shandong University
at Weihai, China
Corresponding author and e-mail: Z M Yue, yuezhenming@sdu.edu.cn
Abstract. The application of crystal plasticity in finite element codes is widely regarded as a
valid way to represent the elasto-plastic behaviour of metal. Based on the rate-dependent
crystal plastic constitutive model, the forming behaviour of the pure aluminium is studied in
this paper. The stress distribution during the stretching, compres sing, and shearing
deformation is simulated, and it is concluded that the heterogeneity of the material
deformation can be well reflected through the simulation with the crystal plasticity theory. At
the same time, the pole figure and orientation distribution function (ODF) are obtained based
on the numerical data, and the evolution of polycrystalline texture are analysed and predicted
based on the simulation results obtained with the proposed crystal plasticity model.
1. Introduction
Accurate description of the anisotropic behavior of metal materials in the plastic forming process is
always an attractive research issue in the calculation of plastic mechanics research and engineering
applications. Therefore, a variety of plastic theories about metal materials have emerged. The crystal
plasticity (CP) theory starts from the crystal structure of the material and explores the macroscopic
deformation mechanism, so as to better understand the macroscopic plastic deformation of the
material, reveal the law of material deformation, and optimize the forming behavior of the material
[1].
In this paper, together with the crystal plastic finite element method (CPFEM), the
single-crystalline and polycrystalline simulations of pure aluminum have been conducted with user
material subroutine UMAT/ABAQUS. And through analyzing the pole figures and ODFs, the
micro-texture of the material in the compressing, shearing deformation is compared. Therefore, it is
of great significance to material forming, material strengthening, and plastic processing of materials.
2. Crystal plasticity theory
The CP theory has been widely used in the literature [2]. In this study, the single crystal constitutive
equation is chosen.
364
Qi, J., Yue, Z., Cao, K., Li, Y. and Gao, J.
Crystal Plastic Finite Element Simulation and Texture Analysis of Aluminum.
In Proceedings of the International Workshop on Materials, Chemistry and Engineering (IWMCE 2018), pages 364-370
ISBN: 978-989-758-346-9
Copyright © 2018 by SCITEPRESS – Science and Technology Publications, Lda. All rights reserved

Unlike the rate-independent crystal plasticity model, the value of slip shear rate is fixed. This
paper uses the exponential function based rate-independent model proposed by Asaro and Rice et al
[3].
Where
denotes the strain hardening state of the crystal, and the strain hardening state of the
actual crystal is very complicated. For this reason, it is considered only that it relates to the total
amount of slip deformation , that is:
In the cubic system, the hardening law of a single crystal slip system can be expressed as:
In the formula,
is a function of, called the hardening modulus matrix, which contains the
effects of self-hardening and latent hardening.
The self-hardening function can generally be represented by a hyperbolic function:
Among them,
is the initial hardening rate,
is the yield shear stress, and
is the flow
stress saturation value. In addition, there are other hardening models that are not described here.
3. Simulation with single CP model
The above constitutive model is implemented with the user material subroutine UMAT in FE
software ABAQUS. All the simulation of the metal forming processes will be conducted with the
given CP model [4].
3.1. Discussion of RVE model
Usually, in order to verify the accuracy of the established model, a representative volume unit of
material may be first established, abbreviated as RVE. The RVE is small in size, but it contains
enough information about the microstructure. Therefore, the mechanical responses with RVE with
defined loading can be used to verify the accuracy of the established crystal plasticity model.
Crystal Plastic Finite Element Simulation and Texture Analysis of Aluminum
365
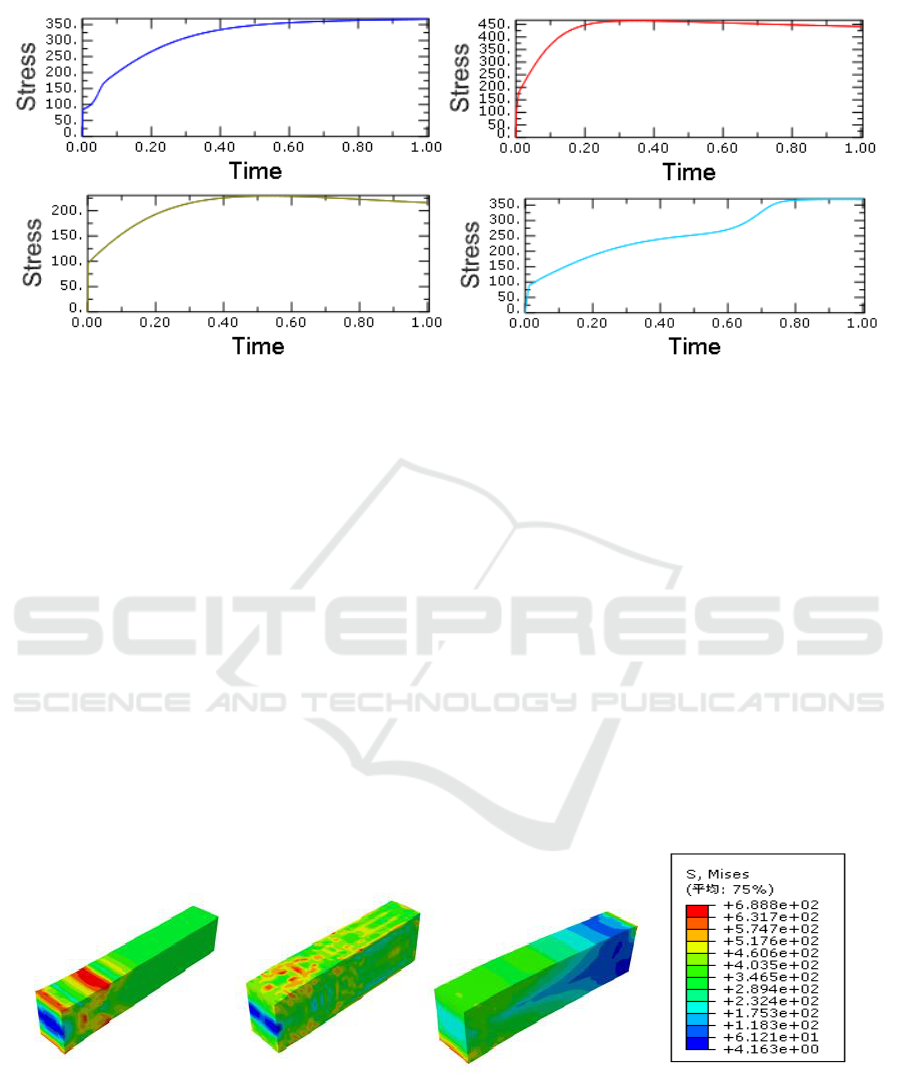
Figure 1. Stress - time curves of RVE model.
As can be seen from Figure 1, with the different loading directions, the yield points obtained with
different defined RVE model are different from each other. This shows that the material constitutive
model established in this paper can well represent the anisotropic behaviour. Moreover, the
numerical value of the yield point is close to the actual yield point of pure aluminum, so the crystal
plasticity model adopted this time has certain feasibility. In addition, the actual yield stress range for
pure aluminum is from 90 to 120 MPa.
3.2. Simulation of the stretching, compression and bending of the cantilever beam
After completing the analysis of the stress response of the RVE model, a cantilever beam geometry
model was established to simulate the stretching, compressing, and bending deformation of the
cantilever beam.
Figure 2 shows the stress distribution of the material after stretching, compression and shearing
deformation, respectively. In each process, obvious stress concentration appears on the side of the
material, and only the middle part of the fixed end has a small stress value. In addition, during the
bending deformation of the simulated cantilever beam, the stress concentration of the cantilever beam
is present.
Figure 2. Simulation of different processes with CP model.
It can be seen that the simulation results with the single CP material model clearly show the
phenomenon of the non-uniform stress, and which is difficult to obtain the same result through the
macroscopic material model. It also reflects the validity of crystal plasticity theory from the
perspective of dislocations. To describe the plastic deformation behavior of the material, it is a good
IWMCE 2018 - International Workshop on Materials, Chemistry and Engineering
366
reflection of the non-uniformity of the stress change in the plastic deformation of the crystal material,
so as to more truly reflect the deformation of the material.
4. Polycrystalline simulation and texture analysis
Based on Taylor's homogenized model, a polycrystalline model is built and applied to simulation. At
the same time, by plotting pole figures and ODFs, the density distributions of orientation are
analyzed, and the corresponding textures and evolution rules can be studied.
4.1. Simulate based on the Taylor model
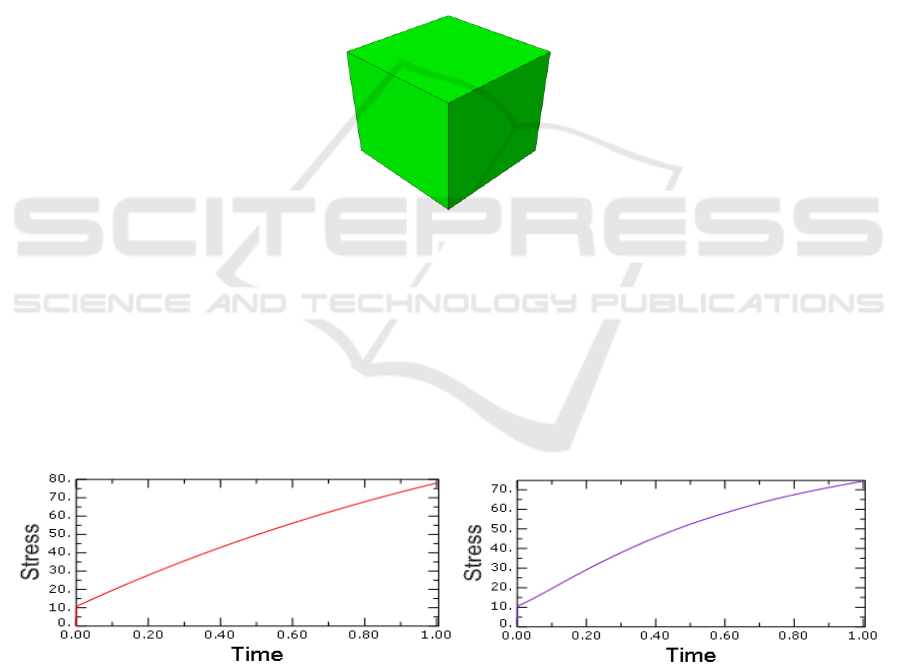
With reference to the work by Marin [5], a polycrystalline model is established to simulate the
compressing and shearing deformation in this paper. The model is shown in Figure 3. It contains a
sufficient number of single crystal grains with different orientations, but its deformation is uniform.
So that it fits well with the requirements of Taylor's homogenization theory.
Figure 3. Polycrystalline model with 500 grains’ orientations.
Figure 4 shows the stress curves of polycrystalline model during compressing and shearing
deformation, respectively. It can be seen from Figure 4 that the stress curves of polycrystalline model
in different deformation processes are approximately the same. This is because, the grains have
different orientations and they are randomly distributed at the mesoscale scale. However, when turn
to the macroscopic scale, the mechanical behavior of the materials will show a feature of isotropic
based on the statistical principle.
Figure 4. Stress - time curves of polycrystalline model.
4.2. Simulation of texture evolution
The pole figure describes the three-dimensional spatial distribution of the crystal with
two-dimensional images. If no texture appears, the density distribut ion of the pole figure should be
uniform, as shown in the Figure 5.
Crystal Plastic Finite Element Simulation and Texture Analysis of Aluminum
367
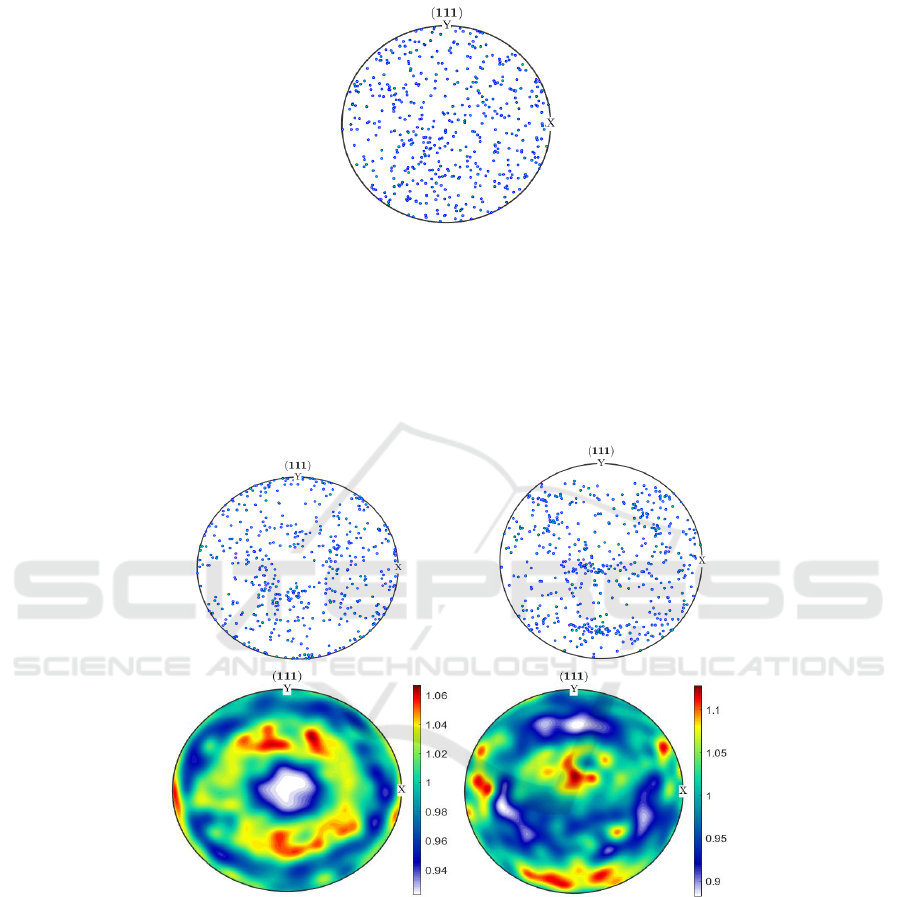
Figure 5. Pole figure without texture.
As shown in Figure 6, the pole figure after compressing and shearing deformation are obtained.
Due to the different ways of deformation, there are differences in the evolution of the pole figure. For
the pole figure of compressing deformation, the density of the poles in the middle is low, and then the
orientation tends to concentrate in a local range. The pole figure of shearing deformation differs
greatly from the compressing. Its distribution of orientation is concentrated in the center, but new
textures are also generated at the edge of the pole figure.
Figure 6. Pole figures in different process.
However, the pole figure shows a two-dimensional space that has certain limitations of describing
the three-dimensional spatial distribution of the crystalline orientation. Therefore, with three spatial
Euler angles as the variables, the orientation distribution function (ODF) is established to express the
spatial distribution of the crystalline orientation, and the resulting figure is called an ODF figure. It
can show the density and distribution of the texture in the form of iso-density lines.
Figure 7 shows the ODFs of compression deformation. By using the increment step as a variable,
it is possible to show the evolution of texture during the deformation. It can be seen that the
distribution of orientation on the same crystalline surface has a certain rule, and new texture will
emerge during deformation.
IWMCE 2018 - International Workshop on Materials, Chemistry and Engineering
368
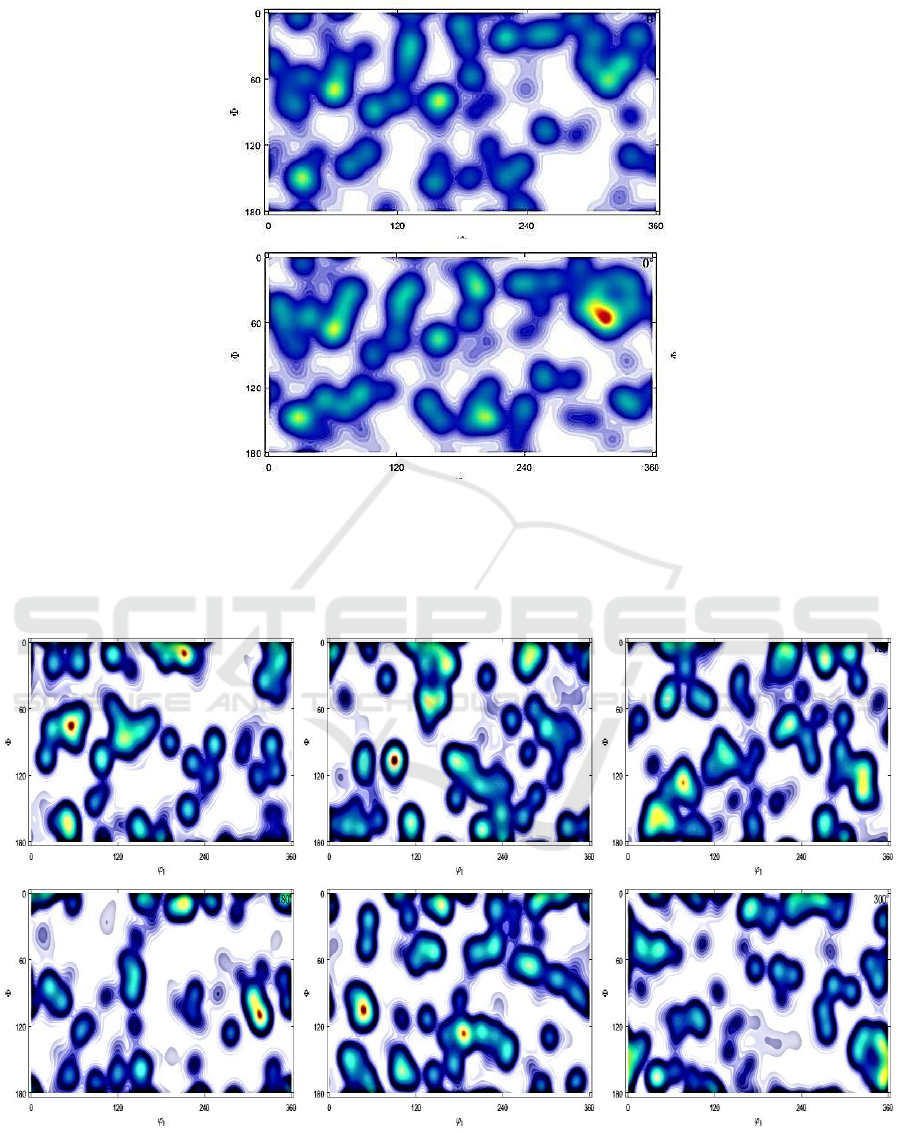
Figure 7. ODFs at different increments.
Figure 8 shows the ODFs of shearing deformation at different Euler angles. As it can be seen
from the figure, there is large difference in density distribution on different crystalline faces. This is
mainly determined by the initial orientation and the loading path of grains.
Figure 8. ODFs at different Euler angles.
Crystal Plastic Finite Element Simulation and Texture Analysis of Aluminum
369

5. Conclusions
Based on the theory of crystal plasticity, the model of pure aluminium single crystal and polycrystal
is completed in combination with the user material subroutine, and the plastic deformation behaviors
are simulated. In the single crystal simulation process, a RVE model which contains enough
information about the microstructure is established. The anisotropy of the established crystal
plasticity model is verified by comparing the different yield points in each stretching direction.
By simulating the stretching, compressing and bending deformation of the cantilever beam, there
are obvious non-uniform stress distributions in the model. It is also reflected that the crystal plasticity
theory which considers the plastic deformation behavior is closer to the true deformation of the
material. Based on Taylor homogenized model, the polycrystalline model is established and its
mechanical response is predicted. At the same time, pole figures and ODFs are plotted, which can
predict the evolution of textures well.
Acknowledgement
The authors would like to acknowledge the financial support from National Natural Science
Foundation of China (NO.51605257).
References
[1] Taylor G I 1934 The mechanism of plastic deformation of crystals J . Proc. Roy. Soc.London
Sec. A 145(1934) 362-387
[2] Hill R 1965 Continuum micro-mechanics of elastoplastic polycrytals J. Mesh. Phys. Solids. 13
89-101
[3] Peirce D, Asaro R J and Needleman A 1982 An analysis of nonuniform and localized
deformation in ductile single crystals J . Acta. Metal 30 1087-1119
[4] Huang Y G 1991 A user-material subroutine incorporating single crystal plasticity in the
ABAQUS finite eIement program Mech report 178 Division of Engineering and Applied
Seiences Harvard University Cambridge Massa-chusetts 2-9
[5] Marin E B 2006 On the formulation of a crystal plasticity model Sandia National Laboratories
CA SAND 2006-4170
IWMCE 2018 - International Workshop on Materials, Chemistry and Engineering
370
