
Distribution of Soil N, P and K of Farmland and Natural Grassland
in Southwest Tibet
Lihua Cao
1
, Shenglan Fu
2
, Heman Liu
1,2*
and Xiaojun Liu Allen
3
1
Department of Resources and Environmental Sciences, Tibet Agricultural and Animal Husbandry College, Tibet Linzhi
860000, China
2
College of Agriculture Science, Xinyang Agriculture and Forestry University, Henan Xinyang 464000,
China
3
Center for Ecosystem Science and Society and Department of Biological Sciences, Northern Arizona
University, Flagstaff, AZ 86011, USA
Email:hmliu@cau.edu.cn
Keywords: Tibet, farmland, grassland, soil N, soil P, soil K
Abstract: The amount and the cycling of soil Nitrogen (N), phosphorus (P), and potassium (K) are significantly
affected by land use types. However, few studies determined the differences in the N, P, and K distributions
in different soil layers from farmland and grassland in alpine areas. The main agricultural area of Tibet was
selected to analyze the changes in total nitrogen (TN), total phosphorus (TP), total potassium (TK),
available N (AN), available P (AP), and available K (AK) in farmland and adjacent natural grassland at
different depths. The TN, TP, AN, AP, and AK concentrations and the N:P, N:K, and P:K ratios in farmland
and grassland in the 0–50 cm layer decreased with increasing soil depth, whereas the content of TK
increased. The effect on TN in soil is greater in grassland than in farmland and mainly occurs in the surface
layer (0–10 cm). No obvious differences in TP were noted between the two land use types.TK in all soil
layers was higher in grassland than in farmland; agricultural production was responsible for a net
consumption of soil K. Soil TN is more sensitive to land use than soil TP and TK. The effect of soil surface
aggregation effect on TN (0–20 cm) is greater in farmland than grassland, and no significant aggregation
effect was found for TP and TK. The results can provide useful information for the estimation of soil N, P
and K content in different land use types and land management in Tibet plateau.
1 INTRODUCTION
N, P, and K are the most important nutrients for crop
production in agriculture. However, inappropriate
agricultural management and land use practicescan
turn these nutrients into agricultural pollution
sources, hampering the development of sustainable
crop production systems and adversely affecting the
environment.Specifically, rapid population growth
and an increasing demand for the transformation of
natural ecosystems into farmlandhave caused urgent
ecological and soil degradation problems(Foley et
al., 2005).
Land use affects different aspects of soil nutrient
cycling,such asmineralization, leaching, absorption,
and fixation.For example, the conversion of
grassland to farmlandhas been reported to increase
the number of soil pores (Lipiec et al., 2006)and to
change the soil water content and concentrations of
soil nutrients(McLauchlan, 2006).This conversion
also promoted mineralization of soil nutrients(Yang
et al., 2008)and nutrient loss via leaching.Soil N, P,
and other nutrients significantly decreased when
grassland was reclaimed to farmland(Menget al.,
2008). In contrast, the content of soil nutrients
increased in abandoned farmland(Deng et al., 2013).
Land use affects the contents of soil nutrients
mainly in the surface layer (0–20 cm). For example,
the soil N(Schilling et al., 2009)and P
(Lemanowiczand Krzyżaniak, 2015)
contentsdecreased with increasing soil depth,
whereas soil K increased with increasing soil
depth(Saini and Grewal, 2014).Chaiet al. (Chai et
al., 2015) found that theN and Pcontents in soil
significantly decreased with increasing soil
depth.Schilling et al.(Schilling et al., 2009)reported
that the content of N in riverside soil in Iowa
significantly decreased with increasing soil depth,
butPdid not show a regular change.The proportional
relationship among carbon, N, P, K, and other
Cao, L., Fu, S., Liu, H. and Liu, X.
Distribution of Soil N, P and K of Farmland and Natural Grassland in Southwest Tibet.
In Proceedings of the International Workshop on Environment and Geoscience (IWEG 2018), pages 331-339
ISBN: 978-989-758-342-1
Copyright © 2018 by SCITEPRESS – Science and Technology Publications, Lda. All rights reserved
331

elements in soil influences and determinesthe
growth of soil microorganisms(Cleveland and
Liptzin, 2007; Griffiths et al., 2012) andplants, as
well as the transformation of soil nutrients(Xuet al.,
2015).
Tibetis characterized byhighly vulnerable
ecological conditionsand is highly sensitive to global
climate change.Grassland and farmland account for
66.80% and 0.42% of the total area of Tibetand
represent the most important land usetypes in this
region.The rapid increase of the population in
Tibethas significantly changed the land use types,
which raises the question: how does land use affect
soil nutrient cycling in the Tibetan alpine region? In
this work, our objectives were 1) to quantitatively
assess how affect of land use types on N, P, K, and
available N, P, K in difference depth soil; 2) to
clarify soil N:P:K ratio with land use types, thus
providing some useful information for land use in
Tibet Plateau.
2 MATERIALS AND METHODS
2.1 Study Site
The study area was located in the southwest of the
Tibetan Plateaunorth of the Himalayas and the south
bank of YarlungZangbo Riverand had an average
altitude of 4000 m above sea level. Annual
precipitation in this region is approximately 290-430
mm with potential evaporation of approximately
2249.6 mm.
The main crops in this region are spring barley
and maize, harvested once per year with a growing
season spanning April to October. After the harvest,
most of the straw is used as feedstock for
livestock.The average fertilization amount has been
increasing;Tibetan statistical data indicate that the
fertilization amount was 108 kg/ha in 2000 and 163
kg/ha in 2012 for Shigatseregion. An imbalanced
fertilizer supply in Tibet agricultural management
for N:P
2
O
5
:K
2
Owas approximately 7:4:1 for 2012
and 129:73:1 for 2000. The average yields were
approximately 4t.ha
-1
for spring barley and 4.5 t/ha
for winter wheat(Paltridgeet al., 200). The soil is
characterized by a high sand/clay ratio and is rich in
gravel, a low organic matter contents (SOC of 3.19–
14.4g.kg
-1
), and pH of 8.1–9.0(Zhonget al., 2005).In
April 2014, we selected a field in a contiguous area
greater than 2 hm
2
with a centralized farmland and
reclamation period of more than 50 years. We
selected 8 sampling areas were established from
Bailang, Gyangze, Xietongmen, Shigatse, Namling,
Qushui in southwest Tibet (Table 1). We selected
two sampling areas from Bailang and Gyangze
respectively, and one sampling area was selected in
others different area. Three sampling points were
then randomly selected from each sampling area and
as replicates for each study area. The research layers
included topsoil (0-30cm) and the plow pan (~50
cm), and we hypothesized that land use affected the
soil properties mainly in the topsoil. Soil samples
were collected from the 0-5, 5-10, 10-20, 20-30, 30-
40, and 40-50 cm layers. The natural grassland
adjacent to each farmland was also selected for
comparison for each sampling area.After removing
roots, stones, and other non-soil constituents, a fresh
soil sample was obtained using the method of
quartering for the determinations of the AN
(included ammonium and nitrate nitrogen) . Another
portion of the soil was air dried and sieving through
a 0.25mm mesh sieve for soil TN, TP, TK, AP and
AK measurements.The semi-micro Kjeldahl method
was used to determine TN(Bao,1999).Soil nitrate N
and ammonium N were extracted using 2 mol.L
-
1
KCl and determined with a continuous flow
analyzer (AA3HR, German SEAL). Fresh soil (10 g)
was weighed and shaken in a 2mol.L
-1
KCl solution
(50 mL)for1 h and then filtered. The TP and AP
contentsweredetermined witha colorimetric method,
and the TK content was determined by dissolvingin
HNO
3
, HCLO
4
and HF, and the AK content was
extracted with 1 M NH
4
OAC. TKand AK were
measured with a flame photometer.
Table 1:Description of sampling areas.
Sample region latitude Longitude Elevation/m Soil type soil texture
Gyangze 28°55′N 89°39′E 4088 Subalpine steppe soil Sandy loam
Bailang 29°09′N 89°13′E 3886 Subalpine steppe soil Sandy loam
Xietongmen 29°19′N 88°22′E 3893 Subalpine steppe soil Loam sand
Shigatse 29°21′N 88°50′E 3842 Subalpine steppe soil Sandy loam
Namling 29°61′N 89°06′E 3835 Subalpine steppe soil Sandy loam
Qushui 29°22′N 90°51′E 3594 Yellow brown soil Sandy clay
IWEG 2018 - International Workshop on Environment and Geoscience
332
2.2 Statistics
The differences in soil nutrients (TN, TP, TK and
AN, AP, AK) in the different soil layers of grassland
and farmland were analyzed by one-way analysis of
variance (ANOVA) and the LSD method usingSPSS
20.0 (IBM, USA) statistical analysis software ,
andtreatments were considered significantly
different at α<0.05. The figures were constructed
using Origin 9.0 (OriginlabCorporation, USA).Data
variability was evaluated using the coefficient of
variation (CV), as shown in equation 1 below:
CV=Standard deviation (SD)/mean ×100%
(1)
3 RESULTS AND ANALYSIS
3.1 Distribution Characteristics of Soil
N
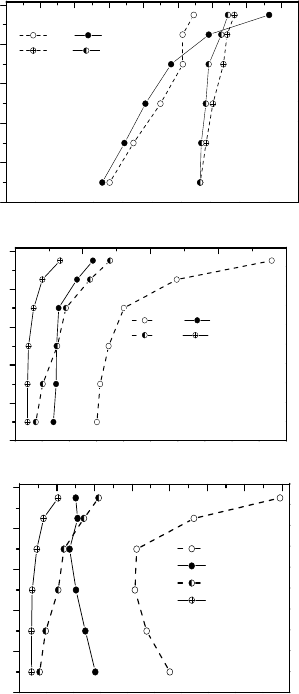
3.1.1 Soil TN Concentration
The soil TN and ANconcentrations in farmland and
grassland decreased with increasing soil depth
(Figure 1a).The soil TN concentration in farmland
decreasedby 45.45% from 0.55 g·kg
−1
in the 0–5
cmsurface layer to 0.30 g·kg
−1
in the 40–50 cm
layer.In the 0–50 cm layer, the vertical spatial CV of
the soil TN concentrationwas 21.30%.Vertical
variability was mainly reflected in the 0-20 cm
layer.The soil TN decreased by 41.18% from 0.51
g·kg
−1
in the 10–20 cm layer to 0.30 g·kg
−1
in the
40–50 cm layer, with a CV of 22.65%.This result
indicates that farmland soil TN is mainly
concentrated inthe 0–20 cm surface layerand rapidly
decreases with increasing soil depth.
The soil TN concentration in grassland decreased
by 63.16% from 0.76 g·kg
−1
in the 0–5 cm layer to
0.28 g·kg
−1
in the 40–50 cm layer.The vertical
coefficient of spatial variation was 37.15%, and
vertical variability was mainly reflected in the 0–20
cm layer.The soil TN concentration in the 0–10 cm
layer was higher in grassland than in farmland.The
difference between the two land use types in the 0–5
cm layer was highly significant (P < 0.01), that is,
the soil TN showed a significant surface aggregation
effect under the effect of plant roots in grassland.The
soil TN concentration was higher in grassland than
in farmland below the 10 cm layer, but was not
significant.In the 40–50 cm layer, the soil TN
concentration in grassland was 7.71% higher than in
farmland.In all of the layers below 10 cm, the
difference in the soil TN concentration between
grassland and farmlanddecreased with increasing
soil depth.
3.1.2 Soil ANConcentration
Figure 1b shows that the soil AN concentrations in
farmland and grassland significantly decreased with
increasing soil depth.The declining trend in farmland
was more highly significant than in grassland.The
CV of farmland was 51.85% andwasrelatively
smalleringrassland,where the CVwas 31.12%.
The farmland soil AN decreased by 68.13% from
37.87mg.kg
−1
in the 0–5 cm layer to 12.07mg.kg
−1
in
the 40–50 cm layer.The decrease from 0–5 cm to 5–
10 cm was the most highly significant, and the
difference between the two layers was
significant.This resultindicates that soil N
mineralizationis mainly concentrated in the 0–5 cm
surface layer.The soil N mineralization conditions
gradually worsened with increasing soil depth,
leading to a significant decrease inthe mineral N
content.Meanwhile, the tillage disturbance was
mainly present in the 0–20 cm surface layer.The soil
aeration and temperature werelowerin the layers
below 20 cm.Consequently, the soil
ANconcentration was also lower in deeper layers.
The grassland soil ANconcentration was 11.47
mg.kg
−1
in the 0–5 cm layer and 5.66 mg.kg
−1
in 40–
50 cm layer.The vertical spatial variability was
smaller in grassland than in farmland.The soil AN
concentration in the 0–5 cm layer was significantly
different from that in the other
layers(P<0.05).However, the soil AN concentration
in the layers below 20 cm showed no significant
differences from theother layers, that is, the N
mineralization conditions in the layers below 20 cm
wererelatively consistent.
The soil AN concentrationwas higher in
farmland than in grassland in all soil layers,
especially in the 0–10 cm layer.This result may be
becauseinorganic fertilizer applicationand farmland
cultivation promoting soil N mineralization.The
differences in the soil ANconcentration between
farmland and grassland were significant forthe 0–5
and 5–10 cmlayers.The difference in the soil AN
concentration between farmland and grassland
gradually decreased with increasing soil depth.In the
0–5 cm layer, the soil AN concentration in farmland
was 26.40mg.kg
−1
higher than in grassland, and in
the 40–50 cm layer, that was only 6.41 mg.kg
−1
.
Distribution of Soil N, P and K of Farmland and Natural Grassland in Southwest Tibet
333
0.0 0.1 0.2 0.3 0.4 0.5 0.6 0.7 0.8
50
40
30
20
10
0
Soil depth/cm
Concentration/g.kg
-1
TN F TN G
TP F TP G
a
0 10203040
50
40
30
20
10
0
Soil depth/cm
Concentration/mg.kg
-1
AN F AN G
AP F AP G
b
01234567
50
40
30
20
10
0
Soil depth/cm
Ratio/%
AN:TN F
AN:TN G
AP:TP F
AP:TP G
c
Figure 1: Variation soil TN, TP and AN, AP
concentrations of farmland and grassland with soil depth.
Note: F and G means farmland and grassland
respectively.
3.1.3 AN:TNRatio
The AN:TN ratio is shown inFigure 1c.The soil
AN:TN ratio in all farmland layers was significantly
higher than in grassland.TheAN to TN ratioranged
from 1.34 to 2.02 % in grassland and from 3.07% to
6.94% in farmland.
In the 0–20 cm layer, the AN to TN ratio in
farmland and grassland decreased with increasing
soil depth.In the layers below 20 cm, the ratio
increased with increasing soil depth, but the increase
was not significant.In the 0–20 cm layer in farmland,
the AN to TN ratiodecreased from 6.94% (0–5 cm)
to 3.12% (10–20 cm).In the layers below20 cm, the
AN to TN ratio gradually increased.The AN to TN
ratiowas 4.01% in the 40–50 cm layer.In the 0–20
cm layer in grassland, the AN to TN ratio decreased
from 1.50% (0–5 cm) to 1.34% (10–20 cm).In the
layers below 20 cm, the AN to TN ratiowas 2.02%
in the 40–50 cm layer with increasing soil depth.
3.2 Characteristics of the Distribution
of Soil P
3.2.1 Soil TPConcentration
The soil TP concentration in farmland and grassland
decreased with increasing soil depth (Figure 1a).The
soil TP concentration in farmland was 0.66 g.kg
−1
in
the 0–5 cm layer.In the 40–50 cm layer, the soil TP
concentration decreased by 12.12% to 0.58
g.kg
−1
.The soil profile TP concentration variability
was less, with a CV of 6.23%.The soil TP
concentration in grassland was 0.65 g.kg
−1
in the 0–5
cm layer. In the 40–50 cm layer, the soil TP
concentration decreased by 13.85% to0.56
g.kg
−1
.The variability of the TP concentration in the
soil profile was less, with a CV of 5.50%.The soil
TP concentrationwas higher in farmland than in
grassland in all soil layers.The differences between
the two land use types decreased with increasing soil
depth. In the 40–50 cm layer, the soil TP
concentration in farmland and grassland was nearly
equal.In other words, the soil TP concentration in
farmland was mainly affected by fertilizer
application, which increased the soil P concentration
in the surface layer.
3.2.2 Soil AP Concentration
The soil AP concentration decreased with increasing
soil depth(Figure 1b).The declining trend in
farmland was more significant than grassland,
i.e.,from 14.01 mg.kg
−1
in the 0–5 cm layer to 3.04
mg.kg
−1
in the 40–50 cm layer, the CV was
54.89%.The decrease in the soil AP concentration
was most highly significant in the 0–20 cm layer.In
the grassland soil profile, the CV of the AP
concentration was 59.54%.Vertical variability was
mainly observed in the 0–20 cm layer.In the layers
below 20 cm, the variation in the soil AP
concentration was less, with a CV of 4.59%.
3.2.3 Soil AP:TP Ratio
The soil AP to TP ratio in farmland and grassland
decreased with increasing soil depth (Figure 1c).The
soil AP to TP ratio in farmland was significantly
higher than in grassland.The 95% confidence
IWEG 2018 - International Workshop on Environment and Geoscience
334
intervals were (1.04–2.02)% and (0.44–0.62)%,
mainly because the application of chemical P
fertilizer in farmland increased the AP concentration
and farmland cultivation promoted P
mineralization.The soil AP to TP ratio in the 0–5 cm
surface layer in grassland was 1.03% and decreased
to 0.32% in the 40–50 cm layer.In farmland, the soil
AP to TP ratio in the 0–5 cm surface layerwas
2.11% and decreased to 0.54% in the 40–50 cm
layer.
3.3 Distribution Characteristics of Soil
K Concentration
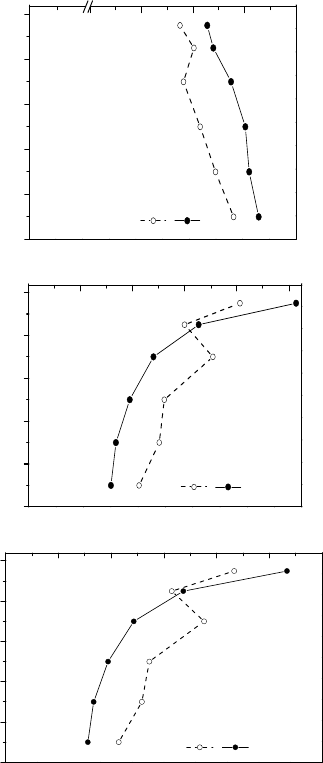
3.3.1 Soil TK Concentration
0 1718192021
50
40
30
20
10
0
Soil depth/ cm
F G
TK/ g.kg
-1
a
0 20406080100
50
40
30
20
10
0
Soil depth/ cm
F G
AK/ mg.kg
-1
b
0.0 0.1 0.2 0.3 0.4 0.5 0.6
50
40
30
20
10
0
Soil depth/cm
AK:TK/%
F G
c
Figure 2: Variation of soil TK and AK concentrations of
farmland and grassland with soil depth.
The soil TK concentration in farmland and grassland
slightly increased with increasing soil
depth(Figure2a).The CV of the soil profilein
farmland and grassland was 2.07% and 2.02%,
respectively.The soil TK concentration was higher in
grassland than in farmlandin all soil layers.In the 0–
50 cm layer, the soil TK concentration range was
17.95–20.36 g.kg
−1
in farmland and 18.70–20.90
g.kg
−1
in grassland.In farmland, the soil TK
concentration was 18.75 g kg
−1
in the 0–5 cm
layerand 19.79 g.kg
−1
in the 40–50 cm layer, an
increase of 5.55%.The soil TK concentration in
grassland was 19.28 g.kg
−1
in the 0–5 cm layer and
20.26 g.kg
−1
in the 40–50 cm layer, an increase of
5.08%.
3.3.2 Soil AK Concentration
The soil AK concentration decreased with increasing
soil depth (Figure 2b).The soil AK
concentrationdecreasedby 69.30%from 102.77
mg.kg
−1
(0–5 cm) to 31.55 mg. kg
−1
(40–50 cm) in
grassland.The CV of the verticalprofile was
51.01%.The soil AK concentration in
farmlanddecreased by 47.78% from 81.17 mg.kg
−1
(0–5 cm) to 42.39 mg.kg
−1
(40–50 cm), and the
CVwas 24.18%.
The 95% confidence interval for the soil AK
concentration was 49.10–69.69 mg.kg
−1
in farmland
and44.12–65.98 mg.kg
−1
in grassland.In the0–5 and
5–10 cm soil layers, the soil AK concentrationwas
higher in grassland than in farmland.In the layers
below 10 cm, the soil AK concentration was higher
in farmland than in grassland.In other words, the net
consumption of the soil AK is reflected in the 0–10
cm surface layer in farmland.
3.3.3 Soil AK:TK Ratio
The AK:TK ratio was higher in farmland than
grassland (Figure 2c).The 95% confidence interval
for the soil AK:TKwas (0.26–0.45)% in farmland
and (0.21–0.38)% in grassland.The farmland soil
AK:TK ratio decreased with increasing soil
depth.The ratio was 0.43% in the 0–5 cm layer and
0.21% in the 40–50 cm layer. The soil AK:TK
vertical spatial variability was less in farmland than
in grassland, with a CV of 26.02% in farmland and
53.13% in grassland. The soil AK:TK ratio was
0.53% in the 0–5 cm layer and 0.16% in the 40–50
cm layer in grassland.
Distribution of Soil N, P and K of Farmland and Natural Grassland in Southwest Tibet
335
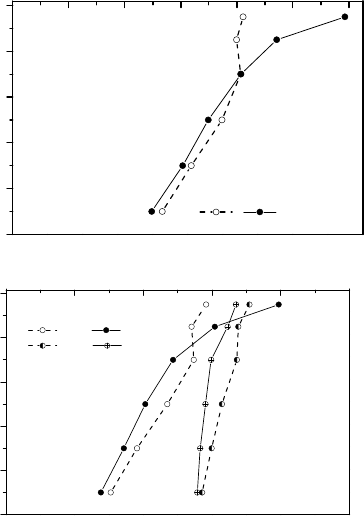
3.4 Proportion Characteristics of Soil
N, P, and K
A proportion analysis of soil N, P, and Kshowed that
the N:P, N:K, and P:K ratios decreased with
increasing soil depth (Figure3).Of these ratios,
P:Kshowed the lowest change amplitude.In other
words, soil P and K maintaineda similar change rate
in the profile.The declining rate of soil N was higher
than that of P and K, indicating that soil Nresponds
most sensitively to changesinthe land use type.
0.00.20.40.60.81.01.2
50
40
30
20
10
0
Soil depth/cm
N:P
F G
0.00 0.01 0.02 0.03 0.04 0.05
50
40
30
20
10
0
Soil depth/cm
N:K and P:K
N:K F N:K G
P:K F P:K G
Figure3: Variation of the ratio of soil N:P,N:K and P:K
with soil depth.
The soil N:P ratio decreased from 1.19 to 0.50 in
grassland and from 0.82 to 0.53 in farmland.The
spatialvariability of the N:P ratio in the soil profile
in grassland was significantly higher than in
farmland.The CV of soil N:P in grassland and
farmland was 31.45% and 16.01%, respectively.
The soil N:K ratio in grassland decreased by
75.0% from 0.04 in the 0–5 cm layer to 0.01 in the
40–50 cm layer,and the CVwas 39.2%.The vertical
spatial variation of the soil N:K ratio in farmland
was less than in grassland, with a CV is 23.0%.The
soil N:K ratio in farmland decreased by 50% from
0.03 in the 0–5 cm layer to 0.015 in the 40–50 cm
layer.
Thesoil P:K ratio vertical variation was lower in
the 0–50 cm layer, with a CVof8.13% and 7.54% in
grassland and farmland, respectively.The soil P:K
ratio in farmland decreased by 20%from 0.035 in the
0–5 cm layer to 0.028 in the 40–50 cm layer,
whereas that in grassland decreased by 15.15% from
0.033 in the 0–5 cm layer to 0.028 in the 40–50 cm
layer.
4 DISCUSSION
4.1 Significant Surface Aggregation of
Soil N and P
The soil N and P concentrations decreased with
increasing soil depth (Schilling et al., 2009; Xionget
al., 2014).However, the increase insoil K with
increasing soil depth(Saini and Grewal, 2014;
Natarajan and Renukadevi, 2003)may be related to
K absorptionby surface plants.
On aglobal scale, the soil TN concentration is in
the range of 0.29–18.20 g.kg
−1
(Cleveland and
Liptzin, 2007).In the present study, the soil TN
concentrations in farmland and grassland were
lower.Moreover, the soil TN wasconcentrated in the
0–10 cm surface layer.The soil TN concentration in
farmland and grassland in the 0–10 cm layer
was1.22 and 1.55 times that in the 0–50 cm
layer.The soil TN concentrationin farmland and
grassland in the 0–20 cm layerwas1.21 and 1.32
timesthat in the 0–50 cm layer, respectively.This
result isconsistent with the findings of Yang et
al.(Yang et al., 2010)for the Qinghai–Tibet
Plateau.In the present study, the soil N was mainly
concentrated in the 0–20 cm layer.The soil P
concentration in farmland and grassland in the 0–10
cm layerwas1.07 and 1.08 times that in the 0–50 cm
layer, respectively,indicating that soil N experiences
a stronger surface aggregation effect than soil P in
the study area.This finding contradicts the result of
JobbÁgy and Jackson(JobbÁgy and Jackson, 2001),
who showed that the soil TP (0–20 cm/100
cm=48.9%) exerteda stronger surface aggregation
effect than the soil TN (38.21%).This discrepancy
may be related to the selective absorption of the
elements by different vegetation types. Highland
barley, rape, and grassland vegetation have a higher
demand for soil N than P; thus, N is concentrated in
plant roots. Meanwhile, the massive application of N
fertilizer increases the soil N concentration inthe
surface layer.
The soil TN concentration in the 0–20 cm
surface layer was higher in farmland than in
IWEG 2018 - International Workshop on Environment and Geoscience
336
grassland(Wang et al., 2009).In the 0–10 cm layer,
the soil TN concentration in grassland is higher than
in farmland.In the layers below 10 cm, the soil TN
concentrationwashigherin farmland than in
grasslandbecause the soil in the study area was
sandy, with a poor adsorption capacity for soil N
fertilizer in the surface layer.The addition of N
fertilizer in agricultural production can increase the
soil TN concentration, but the leaching of N causes
the soil TN in the 0–10 cm surface layer not to be
significantly higher than in grassland. Land
cultivation and management promote the maturation
of soil and the mineralization decomposition of soil
N, inducing the loss of N, causing the soil N
concentration in the surface layer in farmland to be
lower than in grassland.
The soil AN contents and AN to TN ratio
determine the intensity of the supply of soil
N(Penget al., 2013) and its loss potential.In this
study, the soil AN contents and the AN to TN ratio
in the 0–50 cm layerwerehigher in farmland than in
grassland, particularly in the 0–20 cm layer.This
result is related to the increase in soil AN after the
application of chemical N fertilizer and the
promotion of soil N mineralization after farmland
cultivation.Soil AN accounts for the highest
proportion in the 0–5 cm layer in farmland and
grasslandbecause the soil in the surface layer
hasbetter aeration as well aswater and heat
conditions (Malhi and O’sullivan, 199), which
promote soil N mineralization(Sun et al., 2013;
Schüttet al., 2014).In the layers below 20 cm, the
AN to TN ratio increases, possibly because the soil
AN in the upperlayer is easily leached due to
rainfall.Thus, the N in the 0–20 cm surface layer
migrates to the deeper layer and gradually
accumulates, increasing the proportionof the soil AN
in the deeper layer.The AN to TN ratio in farmland
was higher than that in grassland(Yang et al.,
2008).On the one hand, this is related to the
application of N fertilizer in agricultural
production.On the other hand, farmland soil had
ahigher N mineralization rate than grassland soil
(Chen et al., 2014).Plant root exudate influences soil
mineralization.The plant root system in farmland has
a higher biomass than in grassland.The exudates
produced during the growth of the root system
promoted the mineralization of soil N(Herman et al.,
2006; Landi L et al., 2006)and improvedthe soil
inorganic N concentration and the AN to TN ratio.
4.2 Net K Consumption in Farmland
Soil
K is anelemental nutrient that is easy to neglected,
including its reserve, distribution, effectiveness, and
influencing factors(Sardans and Peñuelas,
2015).However, K is an important limiting nutrient
for plant growth(Hoosbeeket al.,2002).This study
result about soil TK was consistent with Liu et al
(Liu et al.,2005), that the average contents of TK in
the surface layer of Tibet was 17.7–23.4 g.kg
−1
.The
TK concentration in all soil layers was higher in
grassland than in farmland.A farmland ecosystem
exerts anet consumption effect on soil K.In the study
area, the main agricultural crops are highland barley
and rape.These two crops must maintainhigh K
consumption to support theirgrowth and
development.For example, the consumption ratio of
N, P,and K for rape is usually 1:0.38:0.94(Sun et al.,
2002).Therefore, if K cannot be supplemented in a
timely manner, it is shownin the net
consumption.The study result suggests that K
fertilizer should be properly supplied to local
agricultural production to decrease K consumption
and prevent a reduction in soil productivity.
The soil K concentration decreased with
increasing soil depth because this element is more
easily leached to the deeper soil layer than N and
P(Nandwalet al., 1998).In addition, K in the surface
layer is likely to leach with water runoff (Barréet al.,
2009).Plant roots mainly occur in the 0–20 cm
layer.K absorption by plants promotes the reduction
of soil K at the surface, therebyleading to a higher K
concentration in the lower layers.The soil AK
concentration in the 0–10 cm layerwas higher in
grassland than farmland, whereas that in the layers
below 10 cm were higher infarmland than grassland,
possibly because of the migration of soil AK to the
deeper layers because of farmland cultivation.
4.3 The Vertical Variability of Soil N
IsHigher than that of Soil P and K
The vertical variability of soil N, P, and K in the 0–
50 cm layer of farmland and grassland follows the
order TN>TP>TK.The CV of the soil N, P, and K
concentrationwas 21.3%, 6.23%, and 2.07% in
farmland,and 37.15%, 5.5%, and 2.02% in
grassland, respectively.In other words, soil N has a
greater spatial variability in the vertical profile of
farmland and grassland, which is mainly reflected in
the 0–20 cm surface layer.The soil N has a strong
activity, and N fertilizeris usually applied in regional
farmland, causing the N concentration in the surface
Distribution of Soil N, P and K of Farmland and Natural Grassland in Southwest Tibet
337
layer to greatly increase,improving the spatial
variability in the vertical profile.Data from 2013
show thatthe amount of N, P, and K
fertilizerconsumed in Shigatsewas 8106, 4733, and
1084 t, respectively(Tibetan statistics bureau, 2013),
indicating that N and P fertilizers were preferably
applied over K fertilizer.
4.4 The Loss of Soil N is Greater than
that of Soil P and K
The proportioncharacteristics show changes in
theamount of the soil elementsat different depths and
the sensitivity of the response to land use
patterns.The proportionvalues of soil N:P, N:K, and
P:K decreased with increasing soil depth, consistent
with the findings of Luo et al.(Luoet al.,2012)for an
alpine meadow.The declining trends of N:K and N:P
were significant.In other words, the declining trend
of soil N with increasing soil depth was significantly
higher than that of soil P and K.
The results showed that the soil N:P values in
farmland and grassland were lower than the Chinese
nationalscale (5.2)(Tianet al., 2010)and the global
average value(13.1±0.8)(Cleveland and Liptzin,
2007), consistent with studies by Zhu et al. (Zhu et
al.,2013)in the forest and grass gully regions of the
Loess Plateau (0.86), by Zhong et al.(Zhonget al.,
2005) in theShigatse agriculture area of Tibet and by
Wei et al.(Wei et al., 2012)in a Lhasa farmland
(1.87).Thus, in alpine ecosystems, the soil N
concentration is low, the P concentration is
relatively high, and the soil N:P value is low.
The soil TP:TKratio was in the range of 0.025 to
0.035, which is close to the average level of 0.044in
the surface soil of Tibet obtained by Liu et al.(Liu et
al.,2005) and consistent with the results of Wei et al.
(Wei et al., 2012)for a Northern Tibet Grassland
(0.034) and Zhu et al.(Zhu et al.,2013) for the gully
region of the Loess Plateau (0.03), indicating that
the spatial variability of soil P:K in different regions
is relatively small.
ACKNOWLEDGEMENTS
The research financial was supported by the Natural
Science Foundations of China(Grant No., 41461055,
41561052, 41161052)
REFERENCES
Bao SD.1999.Soil and agricultural chemistry analysis.
Beijing, China: China agriculture press. (In Chinese)
Barré P, Berger G, Velde B. 2009. How element
translocation by plants may stabilize illitic clays in the
surface of temperate soils. Geoderma,151:22-30
Chai H, Yu G R, He N P, et al. 2015. Vertical distribution
of soil carbon, nitrogen, and phosphorus in typical
Chinese terrestrial ecosystems. Chinese Geographical
Science,25(5):549-560
Chen S X, Wang G B, Ruan H H, et al. 2014. Effect of
different land uses on soil nitrogen mineralization in a
coastal area of northern Jiangsu Province, China, in winter.
Journal of Nanjing Forestry University (Natural Sciences
Edition).38(1):41-46(In Chinese with English abstract)
Cleveland C C, Liptzin D. 2007. C: N: P stoichiometry in
soil: is there a “Redfield ratio” for the microbial
biomass? Biogeochemistry.85(3):235-252
Deng L, Shangguan Z P, Sweeney S. 2013. Changes in
soil carbon and nitrogen following land abandonment
of farmland on the Loess Plateau, China. PLOS
One.8(8):e71923
Foley J A, DeFries R, Asner G P, et al. 2005. Global
consequences of land use. Science.309(5734):570-574
Griffiths B S, Spilles A, Bonkowski M. 2012. C: N: P
stoichiometry and nutrient limitation of the soil
microbial biomass in a grazed grassland site under
experimental P limitation or excess. Ecological
Processes,1(1):1-11
Herman D J, Johnson K K, Jaeger Ⅲ C H, et al. 2006.
Root influence on nitrogen mineralization and
nitrification in rhizosphere soil. Soil Science Society of
America Journal.70(5): 1504-1511
Hoosbeek M R, Van Breemen N, Vasander H, et al.2002.
Potassium limits potential growth of bog vegetation
under elevated atmospheric CO
2
and N deposition.
Global Change Biology.8(11):1130-1138.
JobbÁgy E G, Jackson R B .2001. The distribution of soil
nutrients with depth: global patterns and the imprint of
plants. Biogeochemistry.53: 51-77
Landi L, Valori F, Ascher J, et al.2006. Root exudate
effects on the bacterial communities, CO2 evolution,
nitrogen transformations and ATP content of
rhizosphere and bulk soils. Soil Biology and
Biochemistry.38(3):509-516
Lemanowicz J, Krzyżaniak M. 2015. Vertical distribution
of phosphorus concentrations, phosphatase activity and
further soil chemical properties in salt-affected
MollicGleysols in Poland. Environmental Earth
Sciences.74:2719-2728
Lipiec J, Kuś J, Słowińska-Jurkiewicz A, et al. 2006. Soil
porosity and water infiltration as influenced by tillage
methods. Soil and Tillage Research. 89(2):210-220.
Liu S Q, Gao L L, Pu Y L, et al.2005. Status of soil P and
K nutrient and their influencing factors in Tibet.
Journal of Soil and Water Conservation.19(1):75-
78,88(In Chinese with English abstract)
Luo Y Y, Zhang Y, Zhang J H, et al.2012. Soil
stoichiometry characteristics of alpine meadow at its
IWEG 2018 - International Workshop on Environment and Geoscience
338
different degradation stages. Chinese Journal of
Ecology.31(2):254-260(In Chinese with English
abstract)
Malhi S S, O’sullivan P A. 1990. Soil temperature,
moisture and penetrometer resistance under zero and
conventional tillage in central Alberta. Soil and Tillage
Research.17(1-2):167-172.
McLauchlan K. 2006. The nature and longevity of
agricultural impacts on soil carbon and nutrients: a
review.Ecosystems.9(8):1364- 1382
Meng Q H, Fu B J, Tang X P, et al. 2008. Effects of land
use on phosphorus loss in the hilly area of the Loess
Plateau, China. Environmental Monitoring and
Assessment.139(1-3):195-204
Nandwal A S, Hooda A, Datta D .1998. Effect of substrate
moisture and potassium on water relations and C, N
and K distribution in Vigna radiate.
BiologiaPlantarum.41:149-153
Natarajan S, Renukadevi A. 2003. Vertical distribution of
forms of potassium in major soil series of Tamil
Nadu.Acta Agronomica Hungarica.51(3):339-346
Paltridge N, Tao J, Unkovich M, et al. 2009. Agriculture
in central Tibet: an assessment of climate, farming
systems, and strategies to boost production. Crop and
Pasture Science.60(7):627-639
Peng Y F, Yu P, Li X X, et al. 2013. Determination of the
critical soil mineral nitrogen concentration for
maximizing maize grain yield.Plant and Soil.372:41-
51
Saini J, Grewal K S. 2014. Vertical distribution of
different forms of potassium and their relationship with
different soil properties in some Haryana soil under
different crop rotation. Advances in Plants
&Agriculture Research.1:1-5
Sardans J, Peñuelas J. 2015. Potassium: a neglected
nutrient in global change.Global Ecology and
Biogeography.24(3):261-275
Schilling K E, Palmer J A, Bettis E A, et al. 2009. Vertical
distribution of total carbon, nitrogen and phosphorus in
riparian soils of Walnut Creek, southern Iowa.
Catena.77(3): 266-273
Schütt M, Borken W, Spott O, et al. 2014. Temperature
sensitivity of C and N mineralization in temperate
forest soils at low temperatures. Soil Biology and
Biochemistry.69: 320-327
Sun K G, Wang Y L, Lu Z J, et al.2002. Study on
nutritional character of rape and potassium fertilizer
application effect.Soil and Fertilizer Sciences.4:35-
37(In Chinese)
Sun S, Liu J, Chang S X. 2013. Temperature sensitivity of
soil carbon and nitrogen mineralization: impacts of
nitrogen species and land use type. Plant and
Soil.
372:597-608
Tian H Q, Chen G S, Zhang C, et al. 2010. Pattern and
variation of C:N:P ratios in China’s soils: a synthesis
of observational data. Biogeochemistry.98(1-3):139-
151
Tibetan statistics bureau. Tibet statistical yearbook, 2013.
Beijing, China: China Statistical press.(In Chinese)
Wang Y Q, Zhang X C, Huang C Q. 2009. Spatial
variability of soil total nitrogen and soil total
phosphorus under different land uses in a small
watershed on the Loess Plateau, China.
Geoderma.150(1):141-149
Wei Y L, Zhou Z H, Liu G C .2012. Physico-chemical
properties and enzyme activities of the arable soils in
Lhasa, Tibet, China.Journal of Mountain
Science.9:558-569
Xiong D P, Shi P L, Sun Y L, et al. 2014. Effects of
grazing exclusion on plant productivity and soil
carbon, nitrogen storage in alpine meadows in northern
Tibet, China.Chinese Geographical Science.24(4):488-
498
Xu Z X, Wang Y Y, Li H Z. 2015. Stoichiometric
Determination of Nitrate Fate in Agricultural
Ecosystems during Rainfall Events. PLOS
One.10(4) :e122484
Yang L L, Zhang F S, Mao R Z et al. 2008. Conversion of
natural ecosystems to cropland increases the soil net
nitrogen mineralization and nitrification in
Tibet.Pedosphere.18(6):699-706
Yang Y H, Fang J Y, Guo D L, et al. 2010. Vertical
patterns of soil carbon, nitrogen and carbon: nitrogen
Stoichiometry in Tibetan grasslands. Biogeosciences
Discussions.7:1-24
Zhong G H, Tian F, Wang M, et al. 2005. Soil fertility of
croplands in major agricultural areas in Tibet. Acta
Pedologica Sinica.42(6):1030-1034(In Chinese)
Zhu Q L, Xing X Y, Zhang H, et al.2013. Soil ecological
Stoichiometry under different vegetation area on loess
hilly-gully region. Acta Ecologica Sinica.33(15):4674-
4682. (In Chinese)
Distribution of Soil N, P and K of Farmland and Natural Grassland in Southwest Tibet
339
