
Towards a Technological Platform for Transparent and Flexible
Assessment of Smart Cities
Dessislava Petrova-Antonova, Sylvia Ilieva and Irena Pavlova
Department of Software Engineering, Sofia University, 125 Tsarigradsko shose Blvd., Sofia, Bulgaria
Keywords: Assessment Platform, Performance Indicators, Smart Cities.
Abstract: The concept of smart cities is widely accepted as a powerful tool to improve living standards in all city
dimensions. Smart cities aim to provide better quality services in the field of health, transport, energy and
education in order to increase the comfort of their citizens. Whether in the planning or implementation phase,
a key success factor for building smart cities is measuring the productivity of the decisions and obtaining an
assessment of the final results. Most cities perceive the smart city concept, many of them are working on
strategies for its implementation and more and more of them take concrete actions for deployment of “smart”
solutions. Two questions arise from this: “What are the challenges to become a smart city?” and “What the
city undertakes to become smart?”. Their answers required assessment of the of city’s “smart services” and
the social effect of deployment of “smart solutions” during the transformation from “smart” plan to “smart”
process. In such a context, this paper proposes an architecture of technological platforms for assessment of
city’s “smartness”. Its primary goal is to provide a transparent and flexible indicator framework that supports
quantitative progress evaluation of smart city strategy implementation, feedback on efficiency of current
policies, timely and informed decision making and increased understanding of future city challenges. The
main building components of the platform, namely repository, web APIs and web user interface, are described.
Additionally, a classification schema of indicators covering six main thematic areas is proposed.
1 INTRODUCTION
European cities are forerunners in the transition
towards a low carbon and resource efficient economy.
A fast-growing percentage (currently 72%) of the EU
population lives in urban areas, using 70% of energy.
Quality of city life and the attractiveness of cities as
environments for learning, innovation, doing
business and job creation are now key parameters for
success in the global competition for talent, growth
and investments. Key challenges for realizing the
vision of “Smart and Sustainable Cities” are to
provide solutions to significantly increase cities'
overall energy and resource efficiency through
actions addressing the building stock, energy
systems, mobility, climate change, water and air
quality. Such actions should bring profound
economic, social and environmental impacts,
resulting in a better quality of life (including health
and social cohesion), competitiveness, jobs and
growth.
EC defines Smart Cities as places where the
traditional networks and services are made more
efficient with the use of digital and
telecommunication technologies, for the benefit of
their inhabitants and businesses (EC, 2013). In Smart
Cities, digital technologies translate into better public
services for citizens, better use of resources and less
impact on the environment. Big Data has become
crucial for fulfilling the vision of smart cities - sharing
information is the key enabler in the transition of a
city becoming smart (Gulisano, 2004). The ability to
harness real-time, highly granular data across a wide
range of city operations and services is changing the
way citizens manage and experience the urban
environment. For this reason, the benefits offered by
Big Data are a key element of many smart city
strategies.
Availability of data and the access to data sources
in cities are paramount. There is a broad range of data
types and data sources: structured and unstructured
data, multi-lingual data sources, data generated from
machines and sensors, data-at-rest and data-in-
motion. Value is created by acquiring and combining
data from different sources and providing access to it
with low latency while ensuring data integrity and
preserving privacy. Pre-processing, validating,
augmenting data and ensuring data integrity and
374
Petrova-Antonova, D., Ilieva, S. and Pavlova, I.
Towards a Technological Platform for Transparent and Flexible Assessment of Smart Cities.
DOI: 10.5220/0007230203740381
In Proceedings of the 10th International Joint Conference on Knowledge Discovery, Knowledge Engineering and Knowledge Management (IC3K 2018) - Volume 1: KDIR, pages 374-381
ISBN: 978-989-758-330-8
Copyright © 2018 by SCITEPRESS – Science and Technology Publications, Lda. All rights reserved

accuracy also add value. At the same time, this
heterogeneity of sources and types creates a number
of challenges associated with Big Data use in a Smart
City such as volume, velocity, variety, veracity and
value.
Powerful data techniques are needed, to allow
collecting, storing, analyzing, processing, and
visualizing vast amounts of city related data.
Handling highly variable and real-time datasets
requires new tools and methods, such as powerful
processors, software and algorithms, that go beyond
traditional "data mining" tools designed to handle
mainly low-variety, small scale and static datasets,
often manually. Key aspects such as real-time
analytics, low latency and scalability in processing
data, new and rich user interfaces, interacting with
and linking data, information and content, all have to
be advanced to open up new opportunities and to
sustain or develop competitive advantages.
Interoperability of data sets and data-driven solutions,
as well as agreed approaches are essential for a wide
adoption within and across city authorities and
citizens.
A great tool for policy making, decision support
and performance assessment in fields such as
environment, economic, mobility, are indicators and
composite indexes. The indicators allow better
understanding of smart city challenges by
stakeholders and highlight the effective policies, best
practices and reasonable decisions. The composite
indexes can be unambiguously undestanded by the
policy makers and easily communicated to the
general public (Bohringer, 2007). Both indicators and
composite indexes should be developed with a clear
vision of how they interact with each other, otherwise
the policy decisions could decrease the opportunities
for long-term sustainability (Mayer, 2008).
All these demand rethinking technologies around
smart city solutions and bring the main objective of
project “Big Data Innovative Solutions for Smart
Cities” (Big4Smart, 2018), funding by the National
Scientific fund of Ministry of Education and Science
in Bulgaria. The primary goal of Big4Smart project is
to develop methodology, implemented by an open
technological platform, that support making informed
and timely decisions on big data for building smart
cities. This paper proposes an architecture of the
technological platform for Big4Smart project that
provides a transparent and flexible performance
assessment of smart cities through a range of
indicators covering all city aspects such as living,
people, transport, etc. The indicators give an insight
into the extent to which the city is becoming
“smarter” and outline the driving factors for
sustainable development.
The purpose of the indicators directly influences
their selection. Since they are used for assessment of
cities’ performance and to inform policy at the city
level, it is important to define them in national
context, taking into account the national conditions
and priorities. In addition, the availability of data
sources is a critical issue for successful calculation of
indicators’ values. The required data is provided
primary at national level by variety of institutions
such as national statistical offices, ministries and
government agencies, non-government
organizations, etc. Thus, although the Big4Smart
methodology aims to provide a smart city evaluation
concept in general, its underlying technological
platform should be developed in national scope,
namely taking into account the Bulgarian context.
The rest of the paper is organized as follows. The
current state of the research on the problem area is
described in Section 2. The architecture of the
Big4Smart platform is described in Section 3. Section
4 is devoted on indicator classification schema,
adopted to the Big4Smart platform. Conclusions and
directions for future work are outlined in Section 5.
2 STATE-OF-THE-ART
Several indicator frameworks related to performance
evaluation of smart cities are developed within
European Framework programs. Their main
drawbacks could be summarized as follows:
Covering a specific city sector such as healthcare,
education, industry, etc.;
Assessment of current performance state without
any insight into progress to "smartness".
To the best of our knowledge there is no indicator
framework for evaluation of smart city performance
in Bulgaria. In addition, the proposed Big4Smart
platform aims to assess the progress of cities by
covering variety smart city dimensions in six thematic
areas: smart mobility, smart nature, smart living,
smart people, smart economy and smart government,
described further in Section 4.
2.1 State-of-the-Art at European Level
There are a lot of undergoing FP7 and Horizon 2020
projects and research initiatives related both to Big
Data and Smart Cities. Table 1 lists several ones very
relevant to Big4Smart research. It is advisable to keep
all the given values.
Towards a Technological Platform for Transparent and Flexible Assessment of Smart Cities
375

Table 1: State-of-the-Art at European level.
EIP-SCC Market Place
Description: The EIP-SCC Market Place is an initiative
supported by the European Commission that aims to
develop and implement integrated smart city solutions,
accumulate knowledge and facilitate exchange of
information and focus on the intersection of Energy, ICT
and Transport.
Relation: Big4Smart is especially interested in the
activities of Integrated Infrastructures & Processes
(including Open Data), Sustainable Districts and Built
Environment and Sustainable Urban Mobility action
clusters that exploit Big Data to provide energy, transport
and ecology solutions in the urban context.
Big Data Europe
Description: Big Data Europe builds innovative
multilingual products and services based on semantically
interoperable, large-scale, multi-lingual data assets and
knowledge, available under a variety of licenses and
b
usiness models.
Relation: The methods and tools related to Big Data
analytics that are targeted at use of mobility data coming
from multiple sources, transport data exploitation, energy
grid data, etc. are of special interest to the work of
Big4Smart.
SMARTIE
Description: SMARTIE develops a distributed
framework to share large volumes of heterogeneous data
in smart-city applications.
Relation: Big4Smart looks into the distributed
framework and its operation based on where these
volumes of smart city information are flowing and where
they should be (pre-) processed and analysed.
Open Cities
Description: EU CIP Open Cities project that aims to
validate Open Innovation methodologies to the Public
Sector Future Internet Services for Smart Cities. It uses
platforms in Crowdsourcing, Open Data, Fiber to the
Home and Open Sensor Networks in seven major
European cities.
Relation: Big4Smart investigates the Pan European
Open Data Platform developed within Open Cities, in
order to use the various sets of data for the project
methodology validation.
FIWARE
Description: FIWARE is an EU driven middleware
platform for development and global deployment of
Future Internet applications. FIWARE Lab deploys a
geographically distributed network of federated nodes
leveraging on a wide range of experimental facilities.
FIWARE provides specific enablers for data and smart
cities management.
Relation: FIWARE Lab and infrastructure will be used
by Big4Smart to test the project methodology and for the
use cases to be developed, exploiting Open Data
published by cities and other organizations that is made
available in the Lab. Big4Smart investigates the provided
b
y FIWARE Big Data and Smart City related enablers.
FINESCE
Description: FINESCE (Future INtErnet Smart Utility
ServiCEs) is the smart energy use case project under FI-
PPP EU FP7 that contributed to the development of an
open IT-infrastructure related to the energy sector. The
project organized and run a series of field trials in 7
European cities
Relation: Historical Smart Energy datasets from the
FINESCE trial sites are available as open data and will
be used in Big4Smart methodology validation.
Furthermore, Hybrid Cloud Data Management
component that provides interface with private and
public data storage platforms is of special interest for
Big4mart.
2.2 State-of-the-Art at Bulgarian Level
In the recent years Big Data and Smart Cities
challenges have become a research topic for
Bulgarian academy, public administration and
industry. Research endeavours are not isolated at
national level but are taken in collaboration with
leading EU and world research teams and
organizations. Even though the obtained results are
promising, they are still providing just limited
solutions related to specific aspects and do not realize
a more holistic approach and methodology that is
targeted by Big4Smart. Table 2 shows a summary of
the current research initiatives in the area and
description on how Big4Smart plans to leverage
beyond.
Table 2: State-of-the-Art at Bulgarian level.
SMARTER
TOGETHER
Description: H2020 SMARTER TOGETHER aims at
large-scale replication and at in-depth knowledge transfer
about setting up of Smart City business models and
citizen-centric innovation contributing to positive
societal dynamics.
Bulgarian partner: Sofia city
Relation: Big4Smart investigates the SMARTER
TOGETHER Data Platforms, the integrated new datasets
from energy and mobility, as they all provide Open APIs
that can be easily extended of data analysis.
mySMARTLife
Description: mySMARTLife H2020 project is
developing and testing integrated innovative solutions in
the ‘lighthouse cities’ focuses on high performance
district (smart homes, smart buildings, renewables,
district heating and cooling); smart grids and mobility
(electric vehicles, smart charging infrastructure).
Bulgarian partner: Varna city
Relation: The project deploys an extensive monitoring
and evaluation programme to assess the effectiveness of
mySMARTLife actions and interventions. Contacts have
already been established by the team to apply Big4Smart
methodology in the mySMARTLife integrated planning
and decision-making process.
Sharing Cities
Description: Sharing Cities is a H2020 project offers a
framework for citizen engagement and collaboration at
local level, thereby strengthening trust between cities and
citizens.
Bulgarian partner: Bourgas city
Relation: Big4Smart investigates the developed by
Sharing Cities technologies to manage data from a wide
range of sources, including sensors, and will built upon
them.
Description: H2020 SmartEnCity, aims to develop a
systemic approach and strategies for transforming
European cities into sustainable, smart and resource-
efficient urban environments.
Bulgarian partner: Asenovgrad city
Relation: Big4Smart investigates the mechanisms
for data analysis for integrated planning of measures
to reduce energy demand and maximize renewable
energy supply.
KDIR 2018 - 10th International Conference on Knowledge Discovery and Information Retrieval
376
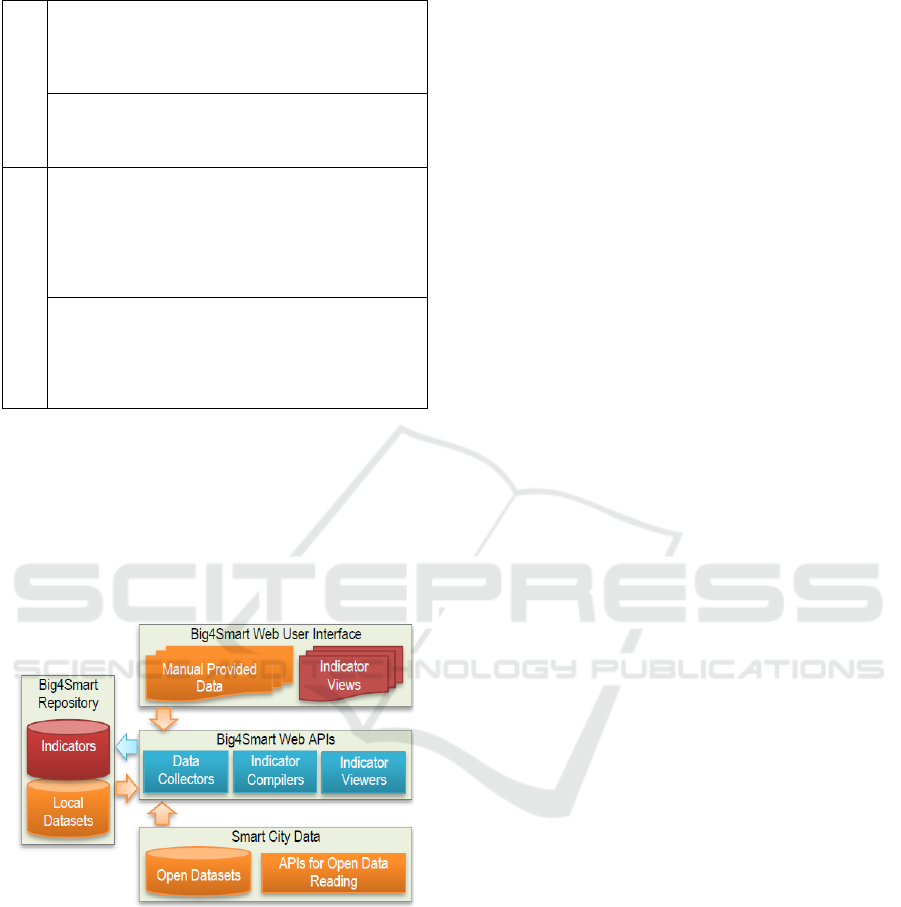
Table 2: State-of-the-Art at Bulgarian level. (cont.)
PLEEC
Description: By combining best practices, FP7 PLEEC
(Planning for energy efficient cities) develops a general
model for energy efficiency and sustainable city
planning.
Bulgarian partner: Ruse city
Relation: The model developed by PLEEC is based on
an intensive analysis of vast amounts of heterogenous
data, which is of special interest to Big4Smart
developments.
DaPaaS
Description: The project combines data-as-a-service
theories with use of open and linked data to improve
linked open data access. The goal is to reduce the barriers
of insufficient resources and allow citizens and public
bodies to contribute to the open data and expand the
linked open data cloud.
Bulgarian partner: Sirma and Ontotex
t
Relation: The project is more focused on linked open
data and its management, rather than on the analysis of
Big Data. Nevertheless, the Big4Smart investigates the
developed DataGraft tool, which accelerates and
simplifies the linked open data publication, consumption
and reuse cycle.
3 Big4Smart ARCHITECTURE
The architecture of the Big4Smart platform is
presented in Fig.1. It has three main building
components, namely repository, web APIs and web
user interface.
Figure 1: Big4Smart Architecture.
Big4Smart Repository stores datasets needed for
calculation of indicators’ values, metadata for
indicators as well as indicators’ values themselves.
Both automatic and manual data collection is
supported. The automatic data collection is based on
open datasets and external APIs that provide access
to such datasets. In the Republic of Bulgaria National
Reform Programme aligned to the strategy “Europe
2020” is included an initiative for establishment of
open data (Strategy “Europe 2020”). At European
level, the open data are regulated by the Directive
2001/29/EC of the European Parliament and of the
Council of 26 June 2013 amending Directive
2003/98/EC on the re-use of public sector information
(Directive 2003/98/EC). The law of access to the
public information carries this directive in Bulgarian
legislation. In this regard, Republic of Bulgaria open
data portal is functioning since 2014. Thus, a source
of data for calculating the indicators are the existing
open datasets. A large share of useful data is stored
internally in cities’ departments. Often, such data is
not easily localizable and sometimes it is not in
machine readable format. In addition, not all
published open data satisfies the common accepted
principles of open data and specific data needed for
calculation of indicators’ values could be missing.
Thus, a Web User Interface for structuring new
datasets is provided.
The Big4Smart web APIs consists of three groups
of services:
Data Collectors – read datasets needed for
indicator calculation;
Indicator Compiles – calculate values of
indicators;
Indicator Viewers – support indicator
visualization.
Data Collectors are responsible for gathering data,
which can be available open datasets, non-open
datasets, provided by stakeholders, data form
additional sources such as online questionnaires,
existing smart city platforms, etc. Since the
calculation of single indicator could requires
aggregation of data from multiple datasets, the data
collectors adopt the Linked Data approach for
interlinking and attribute mapping between datasets.
The linked data sets allow heterogenous data to be
combined in a unified coherent source and usage for
“smart”, data-driven decision making.
The calculation of indicators’ values is provided
by Indicator Compilers services of Big4Smart web
APIs. Depending of the type of the output from
calculation, there are three types of indicators:
Number – an absolute numerical value, for
example the concentration of carbon dioxide
emissions in µg/m3.
Rate – a value, typically calculated in percentages,
for example the percentage of the population
affected seriously by crime or traffic accidents.
Value on a scale – an integer value obtained
through qualitative assessment, for example an
assessment of the extent to which citizens may
participate in environmental decision-making in
scale of 0 to 10. A widely adopted approach is
application of Likert scale described qualitatively.
Towards a Technological Platform for Transparent and Flexible Assessment of Smart Cities
377
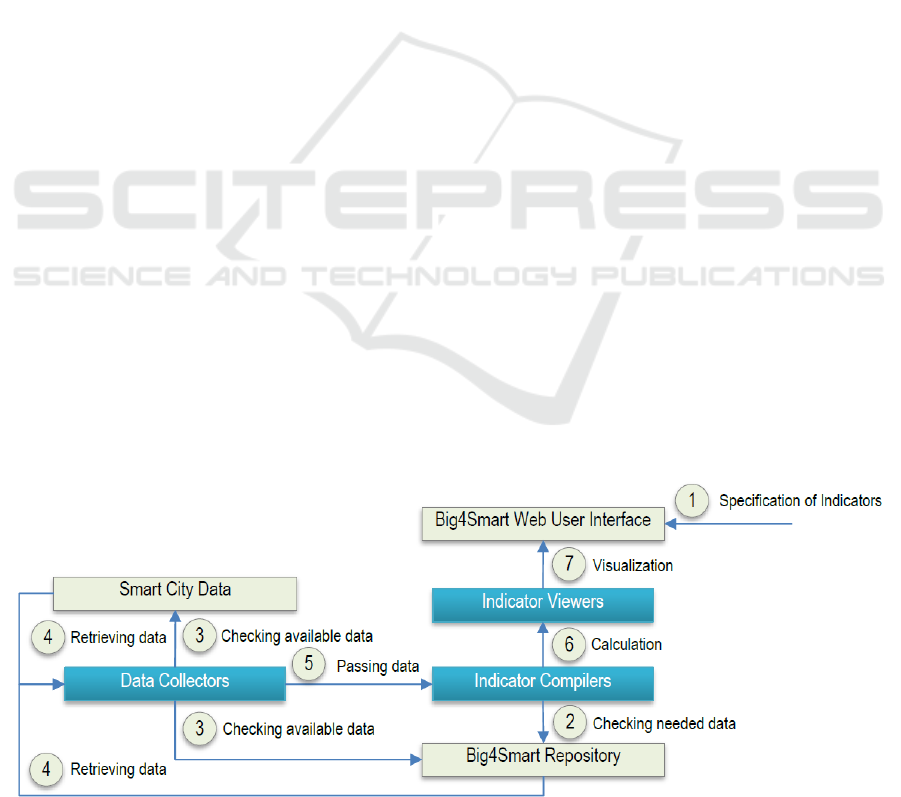
The calculation of indicators’ values is performed
by preliminary defined formulas and/or algorithms
that are implemented as operations of data compiles
services. The calculation process includes the
following steps, shown in Fig. 2:
1) Specification of indicator(s), which value(s)
should be calculated through web user interface,
for example calculate Access to public transport;
2) Checking needed data for calculation, for
example collect the number of inhabitants with a
transportation stop within 500 m and the total
population by Indicator Compilers;
3) Checking available data for calculation by Data
Collectors;
4) Retrieving data for calculation by Data Collectors
(if step 3 is successfully performed, otherwise
sending notification to the end user);
5) Passing data to Indicator Compilers;
6) Calculation based on related algorithms by
Indicator Compilers, for example (number of
inh/total population) x 100;
7) Visualization of indicator(s)’ value(s) by
Indicator Viewers.
The quotative values of the indicators provide a
possibility for their visualization on the web user
interface. The visual presentation is supported by
Indicator Viewers services of Big4Smart web APIs,
providing different visualization models. It is
especially important for effective perception of
obtained assessments by the stakeholders. The
visualization provides not only graphical data
representation, but “smart” interaction with the users.
It is widely adopted by companies such as Google,
Facebook, Amazon, Apple, Twitter and Netflix to
support decision making.
4 CLASSIFICATION SCHEMA OF
INDICATORS
The classification schema of indicators is elaborated
as a result of systematic literature review, covering
four major reference electronic databases provided by
IEEE, ACM, Elsevier and Springer (Petrova-
Antonova, 2018). Additionally, a manual web search
is performed using Google and Bing search engines.
The collected indicators are explored in terms of
property that is measured or observed, primary
purpose, approach of calculation, unit and type of
assessment. As a result, six thematic areas of
classification schema are identified: Smart Nature,
Smart Living, Smart Mobility, Smart Governance,
Smart People and Smart Economy.
The Smart Nature thematic area asses the city
impact on the environment and its environmental
resilience. The pollution, the supply and efficiency
usage of resources (energy, water, land, etc.) are
analysed, as well as the activities to build a green
environment are considered in this thematic area. The
cities face complex and multi-dimensional challenges
during smart transformation process. Therefore,
Governance mechanisms are required to facilitate the
creation and implementation of effective public
policies. Building of a smart city needs more than just
concentrating on a few specific problem areas in a
piecemeal approach to policy. It requires a set of
coordinated policies that eliminate differences
between various sector-specific policies and provide
feedback to city leaders in order to work more
productively with each other as well as with citizens
and businesses. The Smart Economy thematic area is
focused on sustainable economic growth. It takes into
account the innovation and entrepreneurship spirit of
the city. The labour market and the companies’
lifecycle demonstrate the dynamics of the economy.
Figure 2: Calculation of indicators.
KDIR 2018 - 10th International Conference on Knowledge Discovery and Information Retrieval
378
The international embeddedness is also analysed
to obtain vision about the recognition of the city
beyond the boundaries of the country. The Smart
Living thematic area is directly related to the citizens’
quality of life. Its dimensions show whether the cities
are comfortable places to live focusing on aspects
such as education, healthcare, housing, safety, etc.
The cities are more than a combination of
infrastructure and buildings assets. They are living
ecosystem at the centre of which the People are. The
smart cities need their residents to participate in the
smart initiatives in order to be successfully
implemented. The citizens need to adapt to new
solutions, showing creativity and providing value to
their community regardless of their diversity.
Knowledge, professional qualification and skills form
the main tool to improve the city performance. The
Smart Mobility thematic area is related to delivery of
efficient, safe, clean and reliable transport network
for people, data and goods. The reduction of traffic
accidents, environmental impact and demands on
time and energy directly affect the mobility quality.
The assessment of city mobility provides a valuable
feedback for reshaping mobility patterns and
planning mechanisms.
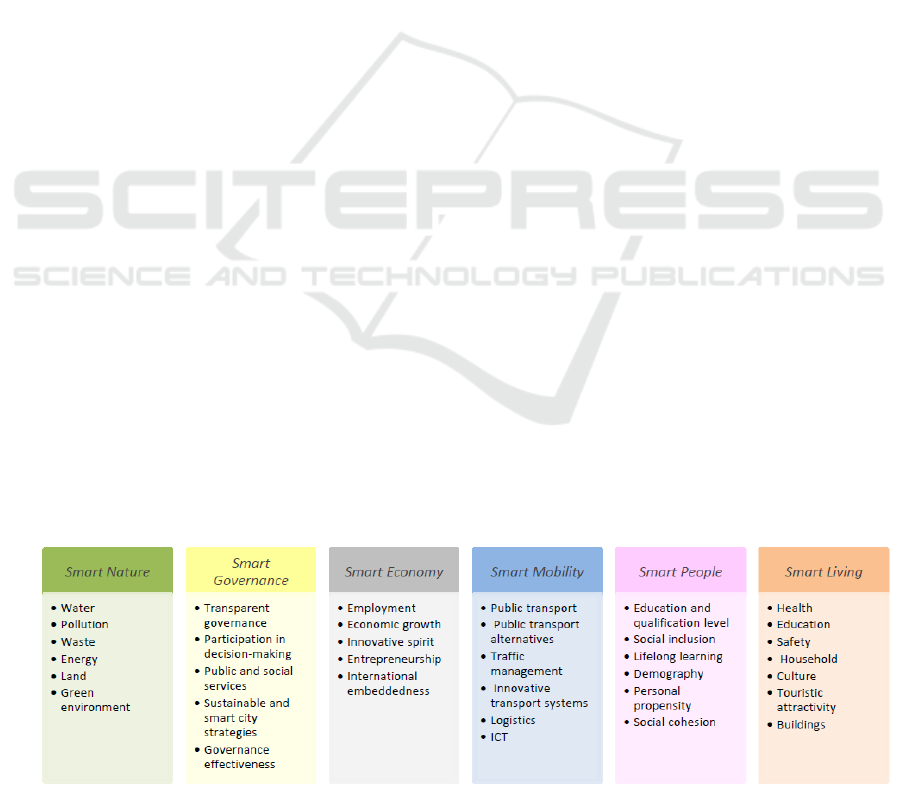
The thematic areas are further divided in several
categories, shown in Fig. 3.
Smart Nature – Water, Pollution, Waste, Energy,
Land and Green environment.
The indicators related to water and energy are
considered from two points of view – supply and
consumption, and efficiency usage and management.
The indicators assessing the pollution are divided in
two groups regards to target of assessment: air
pollution and noise pollution. The indicators of waste
evaluate both solid waste and wastewater. The
indicators assessing the land usage and status cover
the change of land use, land degradation, land
desertification, arable and permanent crop land,
fertilizer use efficiency, use of agricultural pesticides
and area under organic farming. The indicators of
green environment asses the ambitiousness and
comprehensiveness of strategies to improve and
monitor environmental performance, the
management of environmental issues and
commitment to achieving international
environmental standards.
Smart Governance – Transparent governance,
Participation in decision-making, Public and
social services, Sustainable and smart city
strategies and Governance effectiveness.
The transparency of governance can be assessed
regarding the satisfaction with transparency of
bureaucracy, fight against corruption and availability
of open government data. The electronic public
services answer better to citizens’ needs and enable
participation in decision-making and governance
transparency. The participation of citizens in
governance decision-making process provide
inclusive and participatory growth of cities. The
certification of the environmental management
systems by international certification standards is a
common practice at local level that indicates
availability of sustainable and smart city strategies.
The e-procurement transactions, development of
monitoring systems and public-private partnerships
facilitate governance effectiveness.
Smart Economy – Employment, Economic
growth, Innovative spirit, Entrepreneurship and
International embeddedness.
The employment can be assessed through a wide
range of indicators such as total unemployment rate,
youth unemployment rate, female employment, etc.
The economic growth has variety dimensions such as
total investments, grants, total annual costs, payback
and return on investment, gross domestic product, etc.
The innovation spirit of the city is evaluated by SCIs
such as Research and Development (R&D)
expenditure in percentage of GDP, employment rate
in knowledge-intensive sectors and number of patent
applications per inhabitant.
Figure 3: Classification schema of indicators.
Towards a Technological Platform for Transparent and Flexible Assessment of Smart Cities
379

The self-employment rate and new businesses
registered are sample indicators for assessment of the
entrepreneurship in city development. The business
and commerce networks, and online presence of
businesses are another dimension of international
embeddedness.
Smart Mobility – Public transport, Public
transport alternatives, Traffic management,
Innovative transport systems, Logistics and ICT.
The indicators of public transport alternatives assess
the usage of bicycles, private cars and walking as
means of moving. The indicators of innovative
transport systems are focused on development of
sustainable, safe and clean transport system. The
indicators of ICT are divided in three groups, namely
Connectivity, Informational awareness and
Digitalization.
Smart People – Education and qualification level,
Social inclusion, Lifelong learning, Demography,
Personal propensity and Social cohesion.
The education and qualification of citizens are an
important social and territorial competitiveness
factor. The indicators of social inclusion assess the
civic engagement in decision-making and full and
equal participation of people in economic, social,
cultural and political institutions. The affinity to life-
long learning is essential to sustainable development
of the cities since the scale and quality of human
capital are directly related to the creation and
dissemination of new knowledge. The indicators of
personal propensity are related to individual
characteristics such as creativity, open-mindedness,
flexibility, cosmopolitanism, etc. leading to personal
success and innovation. The social cohesion is a
characteristic of society which depends on the
accumulated social capital and could be assessed for
example using indicators of gender discrimination
and the inequalities, poverty and Gini coefficient.
Smart Living – Health, Education, Safety,
Household, Culture, Touristic attractivity and
Buildings.
The accessibility to basic healthcare and
encouragement of a healthy lifestyle are core
indicators of healthcare. Undoubtedly, the shares of
students completing the primary, secondary and
higher education are critical indicators of education
system. The indicators of household give evidence
about the breakdown of housing sector by property
type (owner occupied or rental, single occupant,
couples, family or multifamily occupant, etc.) and
measure the housing quality as a degree to which
inhabitants suffer from poor housing conditions. The
share of natural disaster related deaths and number of
citizens living in disaster prone areas as well as the
share of population affected by crime or traffic
accidents are critical indicators of safety. The tourism
intensity is a distinctive indicator of city appealing
since the tourists also interact with city services and
affect the city profile. The sustainability in new
buildings and in building renovation, the policies and
systems of energy consumption and sustainability of
buildings are sample indicators of buildings.
5 CONCLUSIONS
Due to urbanization the cities meet a lot of challenges
affecting both their economic performance and well-
being. Some of them, like higher prices of services
and goods might be directly measured, and others,
such as pollution, traffic congestion and limited
parking spaces, are difficult to quantify in term of
cost. This paper proposes an architecture of
technological platform of indicators to monitor and
assess the performance and sustainability of smart
cities. It presents the building components of the
architecture and the adopted classification schema of
indicators covering six thematic areas, namely Smart
Nature, Smart Living, Smart Mobility, Smart
Governance, Smart People and Smart Economy.
The validation of the platform will be performed
using real data collected from Bulgarian cities. Sofia
is considered as a pilot city for conducting validation
experiment. The ambitions of Sofia to become a smart
city are laid down to the Sustainable Energy Action
Plan 2012-2020 (SOFENA, 2012). Sofia
Municipality is a partner of European project Smarter
Together. Its objective is to replicate the key findings
from lighthouse cities Vienna, Munich and Lion in
targeted areas, implementing them in different urban
and institutional environments. A current project of
Sofia Municipality is “Integrated metropolitan urban
transport – Phase II” funded by Operational
Programme "Regions in growth" 2014-2020. The
2020 vision of Sofia is to become “The green and
smart capital of Bulgaria – a model for sustainable
development”. The foregoing as well as the support
of the project by the Sofia Development Association,
motivates the choice of Sofia as a pilot city for
validation of the proposed solution.
ACKNOWLEDGEMENTS
This work was supported by the National Scientific
Fund, Bulgarian Ministry of Education and Science
KDIR 2018 - 10th International Conference on Knowledge Discovery and Information Retrieval
380

within the project no. DN12/9 and project no. DN
02/11, and by the Scientific Fund of Sofia University
within project 80-10-162/25.04.2018.
REFERENCES
EC, 2013. “Digital Single Market”,
https://ec.europa.eu/digital-single-market/en/policies/
smart-cities, 9 May 2018.
Gulisano, V., Almgren, M., Papatriantafilou, 2004. M.
When smart cities meet big data, https://ercim-
news.ercim.eu/en98/special/when-smart-cities-meet-
big-data, 19 May 2018.
Bohringer, C. and Jochem. P.E.P. 2007. Measuring the
immeasurable – a survey of sustainability indices.
Ecological Economics, 63, pp. 1-8.
Mayer, A. L. 2008. Strengths and weaknesses of common
sustainability indices for multidimensional systems.
Environment International, 34, pp. 277-291.
Big4Smart, 2018. Big Data Innovative Solutions for Smart
Cities, http://big4smart.eu/, 7 July 2018.
EIP-SCC Market Place, https://eu-smartcities.eu/, 12 June
2018.
Big Data Europe, https://www.big-data-europe.eu/, 8 June
2018.
SMARTIE, http://www.smartie-project.eu/, 8 June 2018.
Open Cities, http://www.opencities.net/, 14 June 2018.
FIWARE, https://www.fiware.org/, 14 June 2018.
FINESCE, http://www.finesce.eu, 22 June 2018.
Smarter Together, http://smarter-together.eu, 9 June 2018.
mySMARTLife, https://ec.europa.eu/inea/en/horizon-
2020/projects/H2020-Energy/mySMARTLife, 9 June
2018.
Sharing Cities, http://www.sharingcities.eu, 9 June 2018.
SmartEnCity, http://smartencity.eu, 9 June 2018.
PLEEC, http://www.pleecproject.eu/, 8 June 2018.
DaPaaS Project, http://project.dapaas.eu/, 8 March 2018.
SOFENA, Sofia Energy Association, 2012. Energy
efficiency plan of Sofia municipality,
http://www.bsa.bg/assets/Database/stolichna-obshtina-
plan-energiina-efektivnost.doc, 28 March 2018.
Sofia Development Association, http://www.sofia-
da.eu/en/, 8 May 2018.
Petrova-Antonova, D., Ilieva, S. 2008. Smart Cities
Evaluation – А Survey of Performance and
Sustainability Indicators. EUROMICRO conference on
Software Engineering and Advanced Applications,
2018 (accepted for publication).
Strategy “Europe 2020”, http://www.strategy.bg/
StrategicDocuments/View.aspx?lang=bg-BG&Id=762,
28 May 2018.
Directive 2003/98/EC on the re-use of public sector
information, http://eur-lex.europa.eu/legal-content/EN/
TXT/HTML/?uri=CELEX:32013L0037&from=BG,
28 May 2018.
Towards a Technological Platform for Transparent and Flexible Assessment of Smart Cities
381
