
Modeling Method for Temperature Anomaly Analysis
Kittisak Kerdprasop
1
, Paradee Chuaybamroong
2
and Nittaya Kerdprasop
1
1
Data and Knowledge Engineering Research Unit, School of Computer Engineering,
Suranaree University of Technology, Nakhon Ratchasima, Thailand
2
Department of Environmental Science, Thammasat University, Thailand
Keywords: Environmental Analytics, Temperature Anomaly, Reanalysis Data, Chi-Squared Automatic Interaction
Detection, CHAID Algorithm.
Abstract: This study applies intelligent analytical methods to analyze temperature anomaly events during the past
seven centuries of countries in the Southeast Asia including Thailand, Malaysia, Myanmar, and Cambodia.
The temperature reconstruction during the years 1300 to 1999 were used as data source for anomaly
analysis. In the analytical process, correlation analysis was applied to initially investigate the temperature
variability concordance among the Southeast Asian countries. The results are that temperature variability
patterns in Thailand, Myanmar, and Cambodia are moderately correlated to each other. On the contrary, the
temperature variation patterns of Malaysia do not correlate to other countries in the same region. The further
in-depth analysis focuses on the temperature anomaly of Thailand that shows high variability from the 14
th
to 16
th
centuries. Several machine learning algorithms had been applied to estimate the temperature anomaly
of Thailand based on the anomaly events among the neighbors. The learned models reveal that Myanmar
temperature anomaly most associate to the Thailand’s temperature variation. The performance of each
model had been assessed and the results reveal that the chi-squared automatic interaction detection, or
CHAID, is the best one with 0.624 correlation coefficient and relative error around 0.611.
1 INTRODUCTION
Climate change has been reported to have strong
influence over various natural dangers such as global
wildfires (Jolly et al., 2015), major volcanic
eruptions (Fujiwara et al., 2015), intense tropical
cyclones (Wing, Emanuel, and Solomon, 2015),
mega-heatwave (Sánchez-Benítez et al., 2018), and
extreme cold (Hartmann, 2015; Liu et al., 2015).
Temperature and precipitation anomalies are two
important factors to estimate climate changes. To
assess climate variation and trends, researchers
deploy several interpolating techniques, for instance,
analyzing the stratospheric temperature change
(Seidel et al., 2016), estimating the Antarctic and
Arctic surface air temperature anomalies over land
and sea ice (Comiso et al., 2017; Dodd et al., 2015;
Francis and Vavrus, 2015; Turner et al., 2016),
examining the cloud amount anomalies (Liu and
Key, 2016), and observing wind and temperature
over the ocean surface (Dong and Dai, 2015;
England et al., 2014; Randel and Wu, 2015).
These techniques require temperature record as a
major source of information for the climate variation
assessment. Temperature reading using thermometer
from the ground-based weather stations and
instrumental reading from ships and buoys are
common form of temperature data acquisition. But
the major shortcoming of this kind of data source is
that the instrumental data are available for only the
past one or two centuries.
To observe temperature trends and variations
over a long period spanning across several centuries
or a millennium, scientists have to rely on some
forms of natural proxy records such as tree rings
(Cai et al., 2018; Seim, 2016) and sediments from
lakes (Li et al., 2017; McColl, 2016). Such natural-
based reconstruction data are now complemented
with the state-of-the-art reanalysis technique that
combines instrumental record with satellite
observations to form an atmospheric data set suitable
for studying climate change (Cowtan and Way,
2014; Donat and Sillmann, 2014; Kobayashi et al.,
2015; Saha et al., 2014; Simmons et al., 2017; Xu et
al., 2018). Reanalysis data are now widely adopted
for observing temperature trends in many areas
274
Kerdprasop, K., Chuaybamroong, P. and Kerdprasop, N.
Modeling Method for Temperature Anomaly Analysis.
DOI: 10.5220/0007224902740280
In Proceedings of the 10th Inter national Joint Conference on Computational Intelligence (IJCCI 2018), pages 274-280
ISBN: 978-989-758-327-8
Copyright © 2018 by SCITEPRESS – Science and Technology Publications, Lda. All rights reserved
globally (Kern et al., 2016; Song et al., 2016; Way
and Bonnaventure, 2015).
In this work, we use reanalysis data of surface
temperature anomaly in eastern and south-central
Asia (Shi et al., 2015) to analyze the anomaly
association patterns among four countries in the
Southeast Asia. We apply correlation analysis and
machine learning techniques to capture the anomaly
association patterns. The applied machine learning
techniques include artificial neural network (ANN),
classification and regression tree (CART), and chi-
squared automatic interaction detection (CHAID).
Machine learning has recently been applied to the
climatology domain, but the technique is limited to
cluster analysis (Horton et al., 2015; Kretschmer et
al., 2018). This work introduces a classification
scheme to support the work of climatologists as well
as to expand the frontier of climate change study.
2 ANOMALY ANALYSIS
METHODOLOGY
2.1 Area of Study
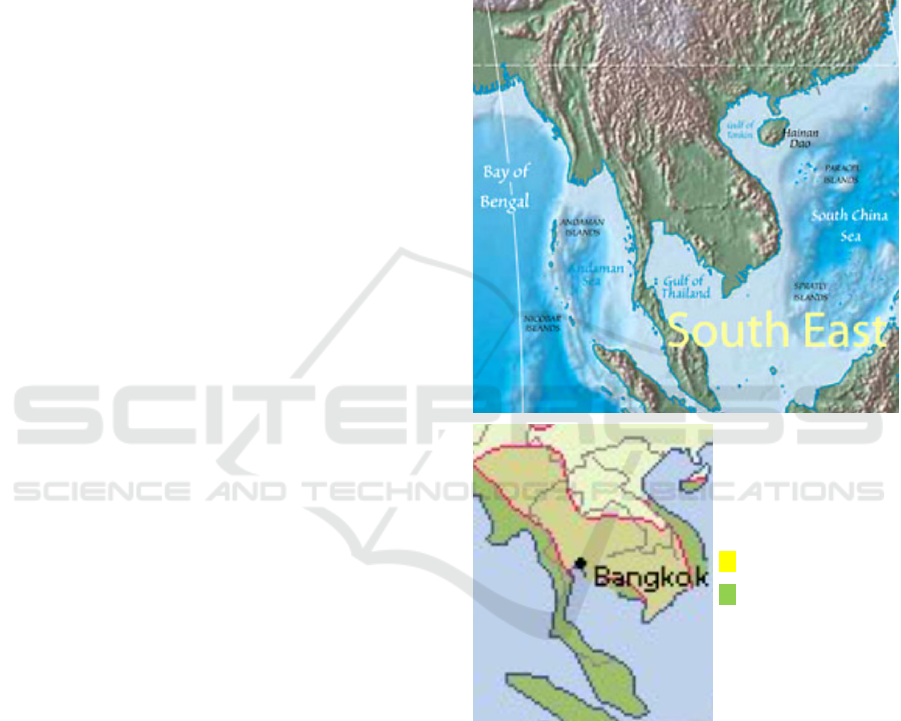
We focus our anomaly analysis on the neighborhood
countries of Thailand sharing some common
characteristics based on the climatic type (Figure 1).
Thailand locates at 102.5 longitude and 17.5
latitude. Country in the northwest is Myanmar
(102.5 longitude, 2.5 latitude) with the same tropical
wet and tropical wet and dry climate zones as in the
north and the west parts of Thailand. Cambodia in
the east (107.5 longitude, 12.5 latitude) is in the
tropical wet and dry zone sharing the same climate
type as the northeastern of Thailand. Malaysia in the
south (102.5 longitude, 17.5 latitude) is in the
tropical wet zone as most southern part of Thailand.
2.2 Temperature Anomaly Analysis
Steps
To study the temperature anomaly patterns of
countries in the Southeast Asia, we perform the
following steps of data analytics:
Step 1: Data Extraction. The temperature
reconstruction data during the rainy season (June-
July-August) of the four countries are extract from
the original data set that contains surface
temperature anomaly of 126 countries in the east and
central Asia. These data had been reconstructed in
2015 by Feng Shi from China and his international
team using hundreds of proxy climate data (Shi et
al., 2015) Data are made publicly available by the
National Centers for Environmental Information
(http://ncdc.noaa.gov/ paleo/study/18635).
Step 2: Correlation Analysis. Surface
temperature anomalies of the selected four countries
during the years 1300 to 1999 are analyzed with
Pearson correlation to explore their association of
anomaly event occurrence.
Tropical wet and dry
Tropical wet
Figure 1: Geographical map of the study area in Southeast
Asia (shown on the above map) covering (1) Myanmar,
(2) Thailand, (3) Cambodia, and (4) Malaysia, with the
climate chart (on the bottom) showing the two weather
styles of this region: tropical wet along the coastal areas of
Myanmar, Thailand, and Malaysia and tropical wet and
dry in the mainland regions. (sources: http://www.
nationsonline.org/oneworld/map/physical_world_map_32
00.htm and http://www.asiafastfacts.com/asiaclimate.
html).
Step 3: Predictive Model Building. We apply
five learning algorithms to construct a predictive
model with Thailand’s temperature anomaly as a
Modeling Method for Temperature Anomaly Analysis
275

target of the model. These algorithms are ANN,
CART, CHAID, linear regression, and generalized
linear model.
Step 4: Model Evaluation. The five models are
assessed based on their correlation metric and
relative error on predicting the target event. The best
model with the highest correlation and the lowest
error is to be reported as the temperature anomaly
estimator.
3 ANALYSIS RESULTS
3.1 Correlation Analysis Result of
Temperature Variability
From the exploration of temperature anomalies
among the four Southeast Asian countries
(summarized in Table 1), we found that temperature
in Cambodia is the most fluctuate one with the
variance as high as 0.171. Cambodia also shows the
cold period with its minimum temperature anomaly
at -1.688
o
C. The country showing clearly the warm
period during the past millennium is Malaysia with
the mean temperature anomaly at 0.093
o
C. In the
18
th
century while Cambodia was in the cold phase,
Malaysia was in the warm phase (as shown in Figure
2).
Table 1: Temperature anomaly statistics.
Region /
Country
Temperature Anomaly (
o
C)
Min Max Mean Variance
Eastern and
south-central
Asia (E&SC
Asia)
-0.766 0.089 -0.323 0.030
Malaysia
(MAL)
-0.724 0.831 0.093 0.083
Cambodia
(CAM)
-1.688 0.284 -0.613 0.171
Myanmar
(MYR)
-0.524 0.446 -0.027 0.038
Thailand
(THA)
-1.315 0.783 -0.243 0.113
Figure 2: Temperature anomaly comparison of eastern and
south central Asia against anomalies in Malaysia,
Cambodia, Myanmar, and Thailand.
The association of temperature anomaly patterns
through the correlation analysis (as displayed in
Table 2) is the result from the second step of our
analysis. The strongest association pattern through
Pearson’s correlation is the temperature anomalies
between Thailand and Myanmar. Malaysia shows
weak correlated temperature patterns to other
neighboring countries. Instead, among the four
regional countries, temperature pattern of Malaysia
is closest to the east and central Asia with
correlation coefficient 0.125, whereas Cambodia
shows opposite direction of pattern.
Table 2: Pearson correlation of temperature anomaly.
E&SC
Asia
MAL CAM MYR THA
E&SC
Asia
-- 0.125
-0.175
0.051 0.009
MAL 0.125
-- 0.034 0.107 0.044
CAM
-0.175 0.034 -- 0.070
0.313
MYR
0.051 0.107 0.070 --
0.549
THA
0.009 0.044 0.313
0.549
--
3.2 Temperature Estimation Model
The five machine learning algorithms that have been
used to model temperature anomaly association
among Thailand and the other three neighboring
countries in the region are assessed their
performances based on the correlation coefficient
and the relative error. Results are summarized in
Table 3.
IJCCI 2018 - 10th International Joint Conference on Computational Intelligence
276

Table 3: Performance comparison of estimation models.
Model Correlation
coefficient
Relative
error
CHAID 0.624 0.611
CART 0.611 0.627
ANN 0.575 0.673
Linear Regression 0.559 0.688
Generalized Linear Model 0.558 0.688
It can be seen from the results that CHAID is the
best machine learning algorithm to estimate
temperature anomaly of Thailand based on
anomalies of the neighbors. The CHAID model is
shown in Figure 3.
CHAID is a tree-based machine learning
algorithm that grows tree and split data set into
subsets based on the result from the chi-square test
(Kass, 1980). The tree is to be interpreted from the
root node on the left-hand-side to reach a
conclusion, which is the target node on the right-
hand-side. From Fig. 3, the interpretation of this tree
model to estimate temperature anomaly (TA) in
Thailand is as follows.
• In case of TA in Myanmar ≤ -0.326, the TA in
Thailand is around -0.643.
• In case of TA in Myanmar > -0.326 but less
than or equal to -0.212, the TA in Thailand is
around -0.486.
• In case of TA in Myanmar > -0.212 but less
than or equal to -0.058, also taking into account
TA in Cambodia:
− If the TA in Cambodia ≤ 0, then TA in
Thailand is expected to be around -0.319.
− But if the TA in Cambodia > 0, then TA in
Thailand is expected to be around 0.130.
• In case of TA in Myanmar > -0.058 but less
than or equal to 0.044, taking into account TA
in Cambodia:
− If the TA in Cambodia ≤ -0.939, then TA in
Thailand is around -0.259.
− If the TA in Cambodia > -0.939 but less
than or equal to -0.378, then TA in
Thailand is around -0.343.
Predictive Factors
Thailan
d
Temperature
A
nomal
y
MYR: ≤ -
0.326
-0.643
MYR:
(-0.326, -
0.212]
-0.486
MYR:
(-0.212, -
0.058]
&
CAM: ≤
0
-0.319
MYR:
(-0.212, -
0.058]
&
CAM: >
0
0.130
MYR:
(-0.058,
0.044]
&
CAM: ≤
-0.939
-0.259
MYR:
(-0.058,
0.044]
&
CAM:
(-0.939,
-0.378]
-0.343
MYR:
(-0.058,
0.044]
&
CAM: >
-0.378
&
MAL:≤ -0.192
-0.027
MYR:
(-0.058,
0.044]
&
CAM: >
-0.378
&
MAL:
(-0.192, 0.247]
-0.201
MYR:
(-0.058,
0.044]
&
CAM: >
-0.378
& MAL: > 0.247
0.022
MYR:
(0.044,
0.149]
-0.117
MYR: >
0.149
&
MAL: ≤
-0.192
0.114
MYR: >
0.149
&
MAL:
(-0.192,
0.181]
&
CAM: ≤ -
0.939
-0.337
MYR: >
0.149
&
MAL:
(-0.192,
0.181]
&
CAM:
(-0.939, -
0.003]
0.037
MYR: >
0.149
&
MAL:
(-0.192,
0.181]
&
CAM: > -
0.003
-0.090
Figure 3: CHAID model for estimating temperature
anomaly of Thailand based on the neighboring anomalies.
Modeling Method for Temperature Anomaly Analysis
277

Predictive Factors
Thailan
d
Temperature
A
nomal
y
MYR: >
0.149
&
MAL:
(0.181,
0.247]
0.135
MYR: >
0.149
&
MAL:
(0.247,
0.332]
-0.283
MYR: >
0.149
&
MAL: >
0.332
-0.007
Figure 3: CHAID model for estimating temperature
anomaly of Thailand based on the neighboring anomalies
(cont.).
− But if the TA in Cambodia > -0.378, then
also consider the TA in Malaysia:
If TA in Malaysia ≤ -0.192, then TA in
Thailand is around -0.027.
If TA in Malaysia > -0.192 but less
than or equal to 0.247, then TA in
Thailand is around -0.201.
If TA in Malaysia > 0.247, then TA in
Thailand is around 0.022.
• In case of TA in Myanmar > 0.044 but less than
or equal to 0.149, the TA in Thailand is around
-0.117.
• In case of TA in Myanmar > 0.149, also taking
into account TA in Malaysia:
− If the TA in Malaysia ≤ -0.192, then TA in
Thailand is around 0.114.
− If the TA in Malaysia > -0.192 but less than
or equal to 0.181, then also consider TA in
Cambodia:
If TA in Cambodia ≤ -0.939, then TA
in Thailand is around -0.337.
If TA in Cambodia > -0.939 but
less than or equal to -0.003,
then TA in Thailand is around
0.037.
If TA in Cambodia > -0.003, then TA
in Thailand is around -0.090.
− If the TA in Malaysia > 0.181 but less than
or equal to 0.247, then TA in Thailand is
around 0.135.
− If the TA in Malaysia > 0.247 but less than
or equal to 0.332, then TA in Thailand is
around -0.283.
− If the TA in Malaysia > 0.332, then TA in
Thailand is around -0.007.
4 CONCLUSIONS
This research presents the statistical and machine
learning approaches to learn correlated and
associated patterns from historical temperature
anomaly events among countries in the Southeast
Asia including Myanmar, Thailand, Cambodia, and
Malaysia. The temperature anomaly data used in this
work are obtained from the multi-proxy
reconstruction of east and south-central Asia during
June-July-August of the past millennium between
the years 1300-1999 C.E.
Correlation analysis results reveal that climate
variations in Myanmar and Thailand closely
resemble, but anomaly events in Malaysia are quite
different from other countries. From the temperature
anomaly record of Cambodia, the cold events during
the 18
th
century are noticeable and contrasting to the
warm events in Malaysia within the same timeframe.
Machine learning methodology is further applied
to study associative patterns of temperature
variations across countries. Such patterns are to be
analyzed through modeling within the classification
and regression framework. The results from
applying five algorithms to induce patterns with
numeric target, which is the temperature anomaly of
Thailand, reveal that CHAID algorithm is the best
one. The CHAID model employs temperature
anomaly in Myanmar as the first factor to estimate
temperature anomaly in Thailand. In case of
complicate estimation, the model takes temperature
anomaly of Cambodia as the second factor. This is
in accordance with the correlation analysis results
that Thailand’s temperature anomalies closely
correlate to the anomalies in Myanmar and
Cambodia. But the CHAID model provides more
information than the correlation analysis in that the
model can quantify the conditional temperature
anomalies necessary for making accurate estimation
over the target’s temperature anomalies.
ACKNOWLEDGEMENTS
This work was financially supported by grants from
the Thailand Toray Science Foundation, the National
Research Council of Thailand, and Suranaree
University of Technology through the funding of the
Data and Knowledge Engineering Research Units.
IJCCI 2018 - 10th International Joint Conference on Computational Intelligence
278

REFERENCES
Cai, Q., Liu, Y., Duan, B., Sun, C., 2018. Regional
difference of the start time of recent warming in
Eastern China: prompted by a 165-year temperature
record deduced from tree rings in the Dabie
Mountains. Climate Dynamics, vol. 50, pp. 2157–
2168.
Comiso, J.C., Gersten, R.A., Stock, L.V., Turner, J., Perez,
G.J., Cho, K. 2017. Positive trend in the Antarctic sea
ice cover and associated changes in surface
temperature. Journal of Climate, vol. 30, pp. 2251–
2267
.
Cowtan, K., Way, R.G., 2014. Coverage bias in the
HadCRUT4 temperature series and its impact on
recent temperature trends. Quarterly Journal of the
Royal Meteorological Society, vol. 140, pp. 1935–
1944
.
Dodd, E.M.A., Merchant, C.J., Rayner, N.A., Morice,
C.P., 2015. An investigation into the impact of using
various techniques to estimate Arctic surface air
temperature anomalies. Journal of Climate, vol. 28,
article 21.
Donat, M.G., Sillmann, J., 2014. Consistency of
temperature and precipitation extremes across various
global gridded in situ and reanalysis datasets. Journal
of Climate, vol. 27, article 17.
Dong, B., Dai, A., 2015. The influence of the interdecadal
Pacific oscillation on temperature and precipitation
over the globe. Climate Dynamics, vol. 45, pp. 2667–
2681.
England, M.H., McGregor, S., Spence, P., Meehl, G.A.,
Timmermann, A., Cai, W., Gupta, A.S., McPhaden,
M.J., Purich, A., Santoso, A., 2014. Recent
intensification of wind-driven circulation in the Pacific
and the ongoing warming hiatus. Nature Climate
Change, vol. 4, pp. 222–227.
Francis, J.A., Vavrus, S.J., 2015. Evidence for a wavier jet
stream in response to rapid Arctic warming.
Environmental Research Letters, vol. 10, article
014005.
Fujiwara, M., Hibino, T., Mehta, S.K., Gray, L., Mitchell,
D., Anstey, J., 2015. Global temperature response to
the major volcanic eruptions in multiple reanalysis
datasets. Atmospheric Chemistry and Physics
Discussions, vol. 15, pp. 13315–13346.
Hartmann, D.L., 2015. Pacific sea surface temperature and
the winter of 2014. Geophysical Research Letters, vol.
42, pp. 1894–1902.
Horton, D.E., Johnson, N.C., Singh, D., Swain, D.L.,
Rajaratnam, B., Diffenbaugh, N.S., 2015. Contribution
of changes in atmospheric circulation patterns to
extreme temperature trends. Nature, vol. 522, pp. 465–
469.
Jolly, W.M., Cochrane, M.A., Freeborn, P.H., Holden,
Z.A., Brown, T.J., Williamson, G.J., Bowman,
D.M.J.S., 2015. Climate-induced variations in global
wildfire danger from 1979 to 2013. Nature
Communications, vol. 6.
Kass, G.V., 1980. An exploratory technique for
investigating large quantities of categorical data.
Applied Statistics, vol. 29, no. 2, pp. 119–127.
Kern, Z., Németh, A., Horoszné Gulyás, M., Popa, I.,
Levanič, T., Hatvani, I.G., 2016. Natural proxy
records of temperature- and hydroclimate variability
with annual resolution from the Northern Balkan–
Carpathian region for the past millennium – Review &
recalibration. Quaternary International, vol. 415, pp.
109–125.
Kobayashi, S., Ota, Y., Harada, Y., Ebita, A., Moriya, M.,
Onoda, H., Onogi, K., Kamahori, H., Kobayashi, C.,
Endo, H., Miyaoka, K., Takahashi, K., 2015. The
JRA-55 reanalysis: General specifications and basic
characteristics. Journal of the Meteorological Society
of Japan, Ser. II, vol. 93, pp. 5–48.
Kretschmer, M., Coumou, D., Agel, L., Barlow, M.,
Tziperman, E., Cohen, J., 2018. More-persistent weak
stratospheric polar vortex states linked to cold
extremes. Bulletin of the American Meteorological
Society, vol. 99, pp. 49–60.
Li, J., Kong, L., Yang, H., Wang, Q., Yang, X., Shen, J.,
Zhao, C., 2017. Temperature variations since 1750 CE
inferred from an alpine lake in the southeastern margin
of the Tibetan Plateau. Quaternary International, vol.
436, pp. 37–44.
Liu, Y., Key, J.R., 2016. Assessment of Arctic cloud cover
anomalies in atmospheric reanalysis products using
satellite data. Journal of Climate, vol. 29, pp, 6065–
6083.
Liu, Z., Jian, Z., Yoshimura, K., Buenning, N.H., Poulsen,
C.J., Bowen, G.J., 2015. Recent contrasting winter
temperature changes over North America linked to
enhanced positive Pacific-North American pattern.
Geophysical Research Letters, vol. 42, pp. 7750–7757.
McColl, J.L., 2016. Climate variability of the last 1000
years in the NW Pacific: high resolution, multi-
biomarker records from Lake Toyoni. PhD Thesis,
University of Glasgow, U.K., available at
http://theses.gla.ac.uk/7793
Randel, W.J., Wu, F., 2015. Variability of zonal mean
tropical temperatures derived from a decade of GPS
radio occultation data. Journal of the Atmospheric
Sciences, vol. 72, pp. 1261–1275.
Saha, S., Moorthi, S., Wu, X., Wang, J., Nadiga, S., Tripp,
P., Behringer, D., Hou, Y.-T., Chuang, H., Iredell, M.,
Ek, M., Meng, J., Yang, R., Mendez, M.P., van den
Dool, H., Zhang, Q., Wang, W., Chen, M., Becker, E.,
2014. The NCEP climate forecast system version 2.
Journal of Climate, vol. 27, pp. 2185–2208.
Sánchez-Benítez, A., García-Herrera, R., Barriopedro, D.,
Sousa, P.M., Trigo, R.M., 2018. June 2017: The
earliest European summer mega-heatwave of
reanalysis period. Geophysical Research Letters, vol.
45, pp. 1955–1962.
Seidel, D.J., Li, J., Mears, C., Moradi, I., Nash, J., Randel,
W.J., Saunders, R., Thompson, D.W.J., Zou, C.-Z.,
2016. Stratospheric temperature changes during the
satellite era. Journal of Geophysical Research:
Atmospheres, vol. 121, pp. 664–681.
Modeling Method for Temperature Anomaly Analysis
279

Seim, A., 2016. Spatiotemporal climate and atmospheric
circulation variability in Asia inferred from tree rings,
PhD Thesis, University of Gothenburg, Sweden.
Shi, F., Ge, Q., Yang, B., Li, J., Yang, F., Ljungqvist,
F.C., Solomina, O., Nakatsuka, T., Wang, N., Zhao,
S., Xu. C., Fang, K., Sano, M., Chu, G., Fan, Z., Gaire,
N.P., Zafar, M.U., 2015. A multi-proxy reconstruction
variations in Asian summer temperatures over the last
millennium. Climate Change, vol. 131, no. 4, pp. 663–
676.
Simmons, A.J., Berrisford, P., Dee, D.P., Hersbach, H.,
Hirahara, S., Thépaut, J.-N., 2017. A reassessment of
temperature variations and trends from global
reanalyses and monthly surface climatological
datasets. Quarterly Journal of the Royal
Meteorological Society, vol. 143, pp. 101–119.
Song, C., Ke, L., Richards, K.S., Cui, Y., 2016.
Homogenization of surface temperature data in High
Mountain Asia through comparison of reanalysis data
and station observations. International Journal of
Climatology, vol. 36, pp. 1088–1101.
Turner, J., Lu, H., White, I., King, J.C., Phillips, T.,
Hosking, J.S., Bracegirdle, T.J., Marshall, G.J.,
Mulvaney, R., Deb, P., 2016. Absence of 21st century
warming on Antarctic Peninsula consistent with
natural variability. Nature, vol. 535, pp. 411–415.
Way, R.G., Bonnaventure, P.P., 2015. Testing a
reanalysis-based infilling method for areas with sparse
discontinuous air temperature data in northeastern
Canada. Atmospheric Science Letters, vol. 16, pp.
398–407.
Wing, A.A., Emanuel, K., Solomon, S., 2015. On the
factors affecting trends and variability in tropical
cyclone potential intensity. Geophysical Research
Letters, vol. 42, pp. 8669–8677.
Xu, W., Li, Q., Jones, P., Wang, X.L., Trewin, B., Yang,
S., Zhu, C., Zhai, P., Wang, J., Vincent, L., Dai, A.,
Gao, Y., Ding, Y., 2018. A new integrated and
homogenized global monthly land surface air
temperature dataset for the period since 1900. Climate
Dynamics, vol. 50, pp. 2513–2536.
IJCCI 2018 - 10th International Joint Conference on Computational Intelligence
280
