
Quantifying the Attention Potential of Pervasive Display Placements
Marcus Winter
1
, Ian Brunswick
2
and Derek Williams
2
1
Centre for Secure, Intelligent and Usable Systems, University of Brighton, U.K.
2
Science Gallery Dublin, The Naughton Institute, Trinity College, Dublin, Ireland
Keywords: Pervasive Displays, Public Displays, Museum, Attention, Engagement, Interaction, Placement.
Abstract: Being able to quantify the attention potential of pervasive display placements holds promise in selecting
suitable placements, scoping expectations of impact, informing display designs and calibrating engagement
data against placement-related factors when evaluating display designs. This paper contributes a first
version of an instrument to quantify the attention potential of display placements, focusing in particular on
small interactive displays in museum environments. It reports on an empirical evaluation revealing strong
and significant correlations between quantified attention potential and measured attention and engagement.
The paper describes the methodology of the evaluation, discusses its findings and their limitations, and
concludes with a call for more research into quantifying the attention potential of display placements.
1 INTRODUCTION
Attention and engagement are key aspects in the
design and evaluation of public displays. The
former, characterised by Mack and Rock (1998,
p.25) as "the process that brings a stimulus into
consciousness" relates to the problem of making
people aware of a pervasive display in the first
place. The latter, commonly used to mean both the
act of making initial contact and the state of being
occupied with the object of attention (Peters et al.,
2009), relates to the problem of making people read
a display and possibly interact with it once they are
aware of it.
The HCI literature is rich in empirical studies
about attention and engagement with public
displays, offering various models and heuristics to
conceptualise, capture and manage attention, to
communicate the interactivity and affordances of
public displays and to support peoples' transition
from attention to engagement. One important aspects
under discussion in this context is the physical
placement of displays, which has been identified as a
key factor determining whether people notice and
engage with them (Huang et al., 2008).
Various guidelines on how to increase attention
and engagement with public displays offer
placement-related recommendations (e.g. Brignull
and Rogers, 2003; Kules et al., 2004; Hardy et al.,
2010; Huang, Koster and Borchers, 2008), however,
these are typically simple heuristics that aim to
maximise attention or to address specific problems
related to attention and engagement.
By contrast, a more elaborate approach that
combines multiple heuristics and allows to quantify
the attention potential of display placements might
be useful in many ways. For instance, quantification
could help to select display placements among
possible alternatives and scope expectations of the
attention and engagement they receive; it could
inform design aspects such as display size, type,
content and casing as well as supporting measures
advertising, framing and explaining display use to
mitigate for a low or high attention potential of the
placement; and it could help to calibrate evaluation
results by isolating placement-related factors of
attention and engagement from factors related to
display design and supporting measures.
In this paper we tentatively propose an
instrument to quantify the attention potential of
display placements, focusing in particular on inch
scale (Weiser, 1991) interactive displays. The
approach emerged from research around Social
Object Labels as a specific instance of this display
class, designed to support situated commenting and
feedback in museums (Winter, 2014a). Reflecting
this context, the instrument uses a subset of
placement-related criteria found to affect visitors'
attention to exhibits and labels in gallery
environments (Bitgood 2009a; 2009b). As these
70
Winter, M., Brunswick, I. and Williams, D.
Quantifying the Attention Potential of Pervasive Display Placements.
DOI: 10.5220/0007223800700080
In Proceedings of the 2nd International Conference on Computer-Human Interaction Research and Applications (CHIRA 2018), pages 70-80
ISBN: 978-989-758-328-5
Copyright © 2018 by SCITEPRESS – Science and Technology Publications, Lda. All rights reserved

placement-related criteria are fundamentally domain
agnostic, the model might also be useful in other
environments.
The following sections briefly discuss literature
on attention and engagement with public displays,
and describe a first version of the proposed
instrument to quantify the attention potential of
display placements. The paper then reports on an
empirical evaluation at Science Gallery Dublin,
where the proposed model was used to quantify the
attention potential of display placements before
deployment while actual attention and engagement
were recorded through observations and technical
logs. The paper concludes with a discussion of
findings, including limitations of both the instrument
and its preliminary evaluation, and a call for further
development and evaluation towards quantifying the
attention potential of display placements.
2 BACKGROUND
There is a broad range of literature on ambient
information systems and interactive public displays
discussing attention and engagement. While the
former is strongly influenced by Weiser and Seely
Brown's (1996) vision of calm computing and seeks
minimise the cognitive costs of monitoring
information, the latter is not encumbered by an
aspiration to minimise cognitive load. An important
question in this field is simply how to attract the
attention of audiences and, for interactive displays,
how to communicate interactivity and encourage
engagement. Besides engagement models, this field
also provides heuristics on how placement in the
physical environment affects attention and
engagement.
In addition to largely domain agnostic HCI
perspectives, the field of museum studies offers
detailed insights into attention and engagement in
museums. While some guidelines in this field can be
mapped to placement heuristics in public display
research, others provide additional aspects that
might be equally useful outside a museum context.
2.1 Attention and Ambient Displays
Reflecting the more differentiated approach to
attention in ambient display research, this field
offers various models breaking down attention into
pre-attention, in-attention, divided attention and
focused attention (Matthews et al., 2003), primary,
secondary and tertiary realms of attention
(Hazlewood and Coyle, 2009) or simply peripheral
and focused attention (Matthews et al., 2007).
Common to all these notions is that attention can be
voluntary or involuntary (Mack and Rock, 1998),
and that display designers should address multiple
forms of attention as well as transition between
them, for instance targeting peripheral attention by
default but supporting escalation to focused attention
through appropriate notifications when an exception
occurs.
2.2 Attention and Engagement Models
for Public Displays
In contrast to ambient information displays, which
typically have limited affordances for explicit
interaction and consequently focus on attention
management rather than user engagement, research
into interactive public displays sees attention as the
first stage in a sequence of stages leading up to
users' engagement and eventual disengagement.
The literature in this field offers several models
of engagement with public displays, which have
been classified by Michelis and Müller (2011) into
ad-hoc models describing how displays react to
users, and observational models describing how
visitors engage with displays. Ad-hoc models use
concepts of proxemic interaction (Greenberg, 2011;
Wang et al., 2012) and are typically employed to
support specific stages in observational engagement
models such as attracting attention and
communicating interactivity.
One of the best known observational models of
engagement with interactive public displays is the
audience funnel (Michelis and Müller, 2011), which
differentiates between six distinct phases including
(i) passing by, (ii) viewing and reacting, (iii) subtle
interaction, (iv) direct interaction, (v) multiple
interaction and (vi) follow-up action.
An earlier observational model by Brignull and
Rogers (2003) describes only three levels, including
(i) peripheral awareness, (ii) focal awareness and
(iii) direct interaction, but crucially also offers
advice on how to help users to transition between
these stages.
Finke et al.'s (2008) model of engagement,
originally developed for game design on large public
displays, defines seven distinct interaction states
including (i) enter, (ii) glance, (iii) decode, (iv)
observe, (v) input, (vi) feedback and (vii) result, and
the authors discuss relevant design aspects relating
to each of these states.
Casting the net wider to include earlier literature
on public access systems, Kearsley (1994) identifies
four stages of audience engagement including (i)
Quantifying the Attention Potential of Pervasive Display Placements
71

attraction, (ii) learning, (iii) engagement and (iv)
disengagement. Kules et al. (2004) offer guidelines
for each of these four stages based on the concept of
immediate usability (ibid).
2.3 Placement-Related Factors
Influencing Attention and
Engagement
While many of the recommendations around
attention and engagement relate to display design
and content (e.g. content type and representation,
information design, learnability, usability) or to
supporting measures framing and explaining the
purpose and use of displays in a specific context
(e.g. appropriate signage, calls to action,
facilitation), some explicitly refer to the physical
placement of displays:
a. Cheverst et al., (2003) point out that interactive
displays should be installed at an appropriate
height to be accessible to wheelchair users.
b. Brignull and Rogers (2003) and Kules et al.,
(2004) suggest there should be enough space
around displays in which interaction can take
place.
c. Kules et al., (2004) suggest that interactive
installations should be placed in locations with a
sustained flow of people.
d. Huang et al., (2008) found that displays installed
at eye height and close to other eye-catching
objects receive more attention.
e. Huang et al., (2008) suggest to consider the
direction of people’s movement within a space
when placing displays.
f. Ten Koppel at al., (2012) found that flat spatial
configurations of displays emphasise the
honeypot effect and foster social learning, and
that hexagonal configurations are most inviting
for strangers to join in and interact with adjacent
screens, while concave configurations are less
conductive to people interacting simultaneously.
g. Brignull and Rogers (2003), Riekki et al., (2006)
and Finke et al., (2008) all discuss social
embarrassment as a barrier to engagement with
public displays and in this context suggest to
avoid display placements that would expose
users or involve awkward body positions during
interaction.
These heuristics help researchers to avoid pitfalls
when placing displays in the environment and to
identify suitable locations. However, they typically
focus on a single characteristic (a-e), relate to spatial
configurations rather than placement locations (f) or
leave considerable room for interpretation (g).
The only effort towards quantification is
described by Dalton et al., (2010), who found that
the visual complexity of a space influences attention
and reading of displays. Drawing on the
architectural concept of an isovist, defined by
Benedikt (1979) as the set of all points visible from
a given vantage point in space, they quantify visual
complexity by calculating the Area-Perimeter Ratio
(APR = Area ÷ Perimeter) of a display location's
isovist. Using this concept in empirical studies, they
found significant correlations between APR and how
people notice displays and perceive different types
of information on them.
2.4 Attention and Engagement in
Museums
Looking outside the fields of ambient information
systems and public displays, there is a rich seam of
research into attention and engagement in museums
(e.g. Screven, 1969; 1992; Serrell, 1996; Bitgood,
1991; 2000; 2009a; 2009b), which offers useful
heuristics on the design and placement of
interpretive resources and exhibits to improve
communication and increase visitor engagement.
While many of these heuristics are based on
experiences with (static) print labels and tangible
information displays, such as multi-layer labels and
multiple-choice flip questions, some researchers in
this field explicitly widen their scope to digital
displays and interactives. For instance, Screven
(1992, p.1) refers to "all type of media [including]
print, audio and graphics" and presentation formats
including "interactivity, sound, graphics, video,
computers", while Bitgood (2009a; 2009b) examines
attention for both interactive interpretation resources
and exhibits.
Some placement-related heuristics in this domain
have clear equivalents in public display research,
e.g. Bitgood's (1991, p.120) recommendation to
place labels "within line of sight so that visitors do
not have to turn, look up high, or down low" can be
directly related to Huang, Koster and Borchers'
(2008) finding that displays installed at eye-height
and in the direction of people's movement receive
more attention. Others demonstrate a more holistic
perspective that takes into account people's overall
visiting experience. For instance, Bitgood (2009a;
2009b) considers satiation and fatigue when visitors
progress through a exhibition as critical factors
affecting attention and engagement. While this
consideration is clearly informed by experiences in
CHIRA 2018 - 2nd International Conference on Computer-Human Interaction Research and Applications
72

museum environments, it might also be relevant to
other contexts where passers-by encounter multiple
displays over a period of time.
Overall, research into ambient information
systems and public displays, as well as museum
studies exploring attention and engagement with
exhibits and interpretive labels, offer useful models
and heuristics that can inform the placement of
displays in the physical environment. However,
apart from Dalton et al. (2010), who introduce the
APR of a display location's isovist as a quantifiable
measure influencing attention and reading of
displays, the literature offers little in terms of
quantifying the attention potential of display
placements.
3 TOWARDS QUANTIFYING
ATTENTION POTENTIAL
Being able to quantify the attention potential of
display locations might be useful in many ways. For
instance, it might help to scope expectations when
deploying displays; it might inform specific display
designs and configurations before deployment to
mitigate for a low or high attention potential of its
placement; and it can help to calibrate measured
attention and engagement rates against placement-
related factors when evaluating display designs
during and after deployment.
3.1 Instrument
In order to test the viability of quantification, we
developed a first version of an instrument to
quantify the attention potential of display
placements in museums. Considering the specific
environment, it draws on Stephen Bitgood's (2009a;
2009b) research into factors impacting on attention
and engagement with exhibits and interpretive labels
during a museum visit. While Bitgood's (ibid)
original research describes a wide range of factors,
the developed instrument limits itself to four factors
that can be related to placement either in a local
context (placement in relation to close-by exhibits
and interactives) or in a global context (placement in
the gallery space). These include:
Distraction - how many other stimuli are close
by that add to a visitor's cognitive load.
Competition - whether there is competition from
other interaction opportunities.
Satiation - how often a visitor has encountered a
similar object before (boredom).
Fatigue: at what stage during a visit a visitor
encounters an object (physical exertion).
For each of these criteria, potential placements are
assessed along a simple rating scale reflecting the
number of displays deployed, which simplifies
ratings along the Satiation and Fatigue criteria.
Individual ratings are then added up to a total score
for a specific placement, which, together with
maximum and minimum possible scores, is used to
express the attention potential as a percentage value:
Higher attention potentials indicate conditions that
are more conductive for displays to be noticed and
engaged with, while lower attention potentials
indicate conditions that are less conductive to
displays being noticed and engaged with.
3.2 Limitations
An obvious limitation of the instrument in its current
form is that it contains only four criteria drawn from
museum studies. Other versions of the instrument
could include a larger number of criteria to cover
more aspects and increase precision. These could
include additional or entirely different criteria, for
instance drawing on heuristics from public display
research, to make them more suitable for their
specific context.
Another limitation is that two of the criteria used
in the current version make certain assumptions
about the context in which displays are deployed.
Specifically, the Satiation and Fatigue criteria
assume that displays are encountered in a certain
order, which might not apply, or might not be easily
predicted, in other contexts.
Lastly, measuring Distraction and Competition
for placements might be problematic due to a lack of
suitable approaches and metrics. While highly
relevant, rating placements along these criteria
necessarily introduces some level of subjectivity.
While subjectivity could be mitigated to some
degree by employing multiple raters, this might not
always be an option due to practical constraints.
4 EVALUATION
In order to evaluate the instrument in a realistic
gallery environment, it was used to quantify the
attention potential of four display placements in the
Home\Sick exhibition at Science Gallery Dublin
(SGD, 2015). The evaluation formed part of a wider
Quantifying the Attention Potential of Pervasive Display Placements
73
research effort to develop design guidelines for
Social Object Labels as a platform for social
interpretation in museums (Winter, 2013; 2014a;
2014b; 2015).
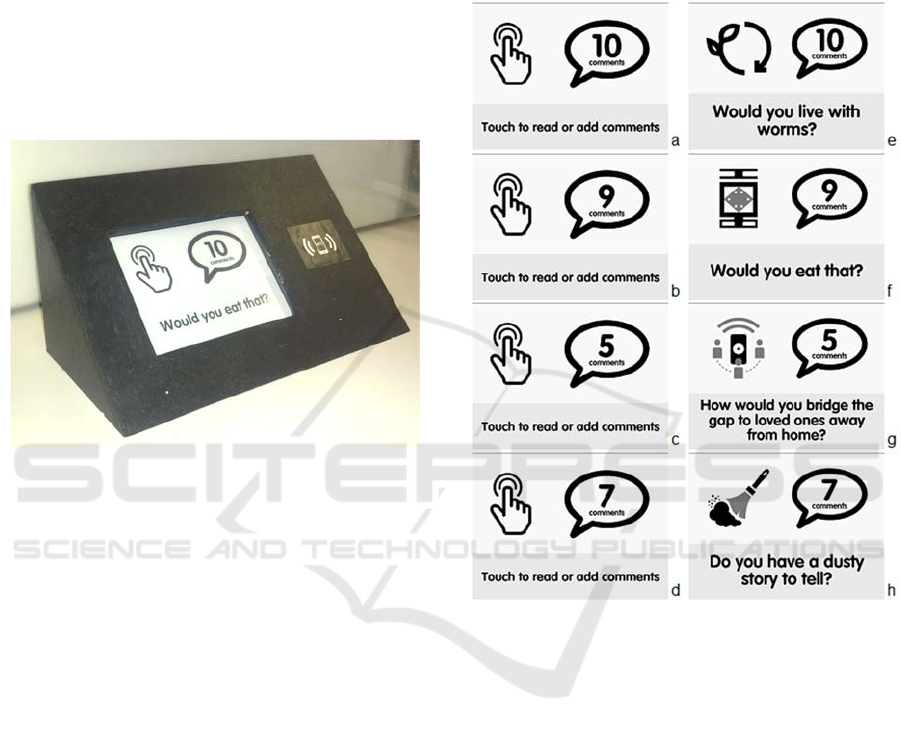
4.1 Display Type and Content
The deployed displays were inch scale (Weiser,
1991) interactive screens affording both direct touch
interaction and mobile interaction via a related web
application for visitors to submit and browse
comments for specific exhibits (Figure 1).
Figure 1: Deployed displays consisting of a 6 inch e-ink
screen and black casing to fit in with gallery environment.
Reflecting their particular purpose and gallery
environment, the displays are designed to strike a
balance between attracting enough attention to be
noticed and encouraging engagement on the one
hand, but not detracting visitors' attention from the
exhibit as the primary object of interest on the other
hand. Given these opposing requirements, the
displays use small, 6 inch, monochrome, passive-
light e-ink screens and black casings that integrate
with the gallery environment.
Each display is associated with a specific exhibit
and can be configured to show different types of
content (e.g. exhibit specific question or generic
prompt) and representations (e.g. exhibit specific
icon or generic icon) and to expose different
interaction capabilities (e.g. allow content browsing
on touch screen or not) reflecting curators' specific
requirements and preferences (Winter, 2014b).
In order to answer research questions in the
wider study, displays were set up to automatically
switch between seven possible configurations at
specific times. Switches between configurations
were synchronised so that all displays ran the same
user interface at any given time, i.e. while there was
some content variation between placements, these
were limited to different icons or questions, whereas
all displays at the same time either showed a generic
icon or an exhibit specific icon and a generic prompt
or an exhibit specific questions. Figure 2 shows
minimum and maximum display variations between
placements under these conditions.
Figure 2: Minimum (a-d) and maximum (e-f) content
variation between displays at different exhibits.
4.2 Display Placement
The selection of exhibits and related placements was
guided by the idea of social objects (Engeström,
2005; Simon, 2010), which provoke a reaction from
visitors and stimulate debate, however, faced with
realities on the ground, actual object selection was
equally influenced by more pragmatic aspects such
as availability of a mains power socket and artists'
agreement to have a display installed next to their
exhibit.
Figure 3 shows the four display installations in
the order in which visitors would typically encounter
them when making their way through the exhibition.
In the ground floor gallery, one display was
integrated with an exhibit called Parasite Farm,
which explores how agricultural practices can
become part of urban living. The display was placed
CHIRA 2018 - 2nd International Conference on Computer-Human Interaction Research and Applications
74
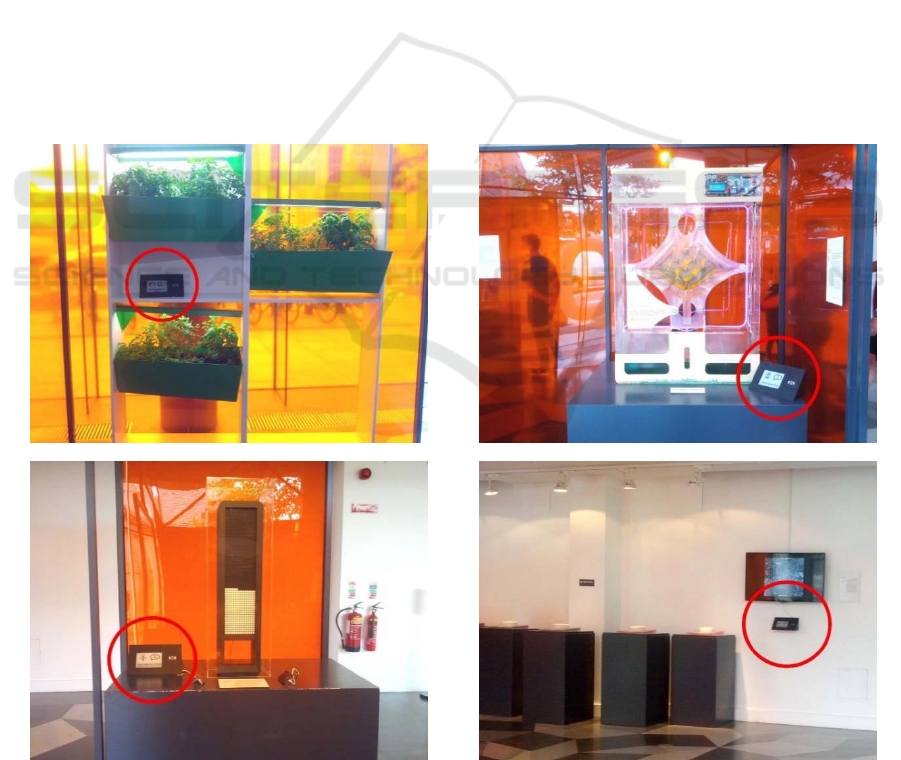
on an empty shelf in a book case holding the plant
boxes, occupying a central position and affording
convenient access for direct interaction (Figure 3a).
Also in the ground floor gallery, one display was
installed next to LillyBot 2.0, a personal microalgae
farm that produces oxygen and Chlorella algae while
binding carbon dioxide in the air. The display was
placed on the right side of the plinth supporting the
installation, in a peripheral position that required
visitors to slightly bend down for direct interaction
(Figure 3b).
In the first floor gallery, one display was
integrated with Ritual Machines, which explores
how technology can help to connect with family
members away from home. The display was slightly
set back from an interactive installation involving
two iPod devices, in a peripheral position but within
easy reach of visitors operating the iPod on the left
side of the installation (Figure 3c).
Also in the first floor gallery, a display as
installed next to Dust Matter(s), which
conceptualises domestic dust in the home as an
indicator of the occupants' outdoor activities. The
display was placed in a prominent position below a
large video screen and within easy reach for direct
interaction (Figure 3d).
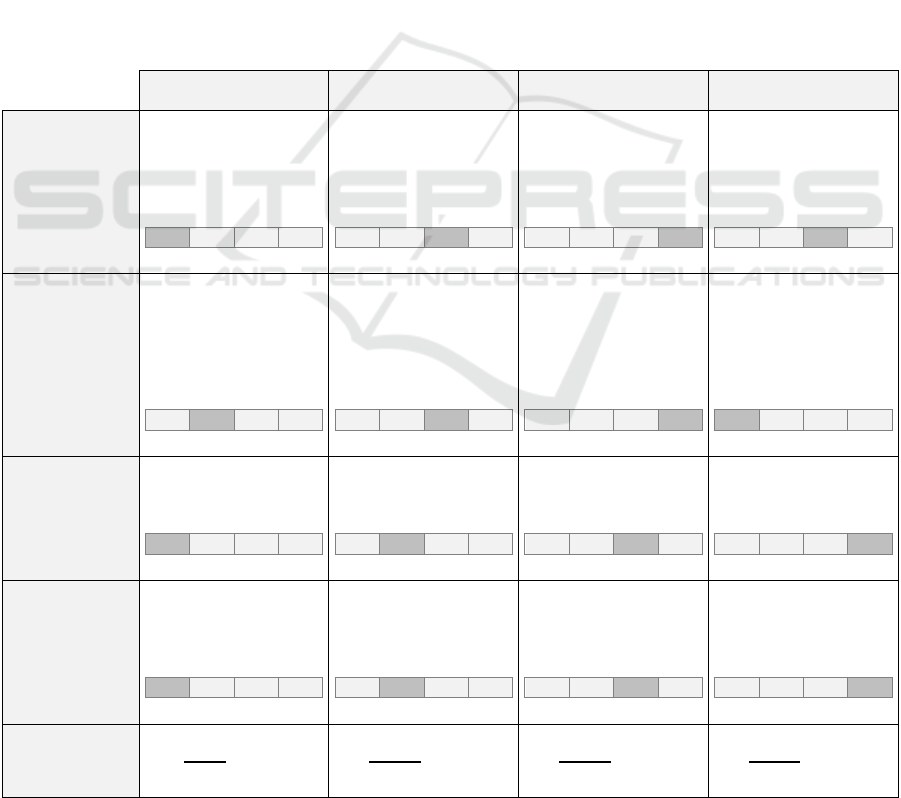
4.3 Attention Potential
Table 1 rates all four display placements with the
developed instrument to quantify their attention
potential. To make ratings for specific placement
criteria more transparent, the table provides brief
descriptions explaining the reasoning behind each
rating and includes image references to the related
display installations.
The quantified attention potential of individual
display installations varies considerably, ranging
from a maximum of 92% for the placement at
Parasite Farm to a minimum of 17% for the
placement at Dust Matter(s). While this information
could have been used to compensate for low or high
attention potentials by adjusting relevant design
aspects, such as the luminosity of the display or the
design of the casing, no mitigating measures were
taken in this case to avoid compromising the
experimental setup.
a
b
c
d
Figure 3: Displays (circled red) integrated with exhibits Parasite Farm (a) and LillyBot 2.0 (b) in the ground-floor gallery
space, and with exhibits Ritual Machines (c) and Dust Matter(s) (d) in the first-floor gallery space.
Quantifying the Attention Potential of Pervasive Display Placements
75
4.4 Data Collection and Analysis
The displays were deployed for 20 days, during
which time actual attention and engagement was
recorded through observations, analytics data and
content contributions.
Observations were carried out covert in order to
not disturb visitors' natural behaviour. Observation
notes were recorded in a coding template and then
transferred into a spreadsheet for analysis with
standard statistical methods discussed in Sauro and
Lewis (2012). The observations were carried out in
two blocks of four days each, with a combined
observation time of 28 hours and 56 minutes, during
which a total of 812 encounters were observed.
Encounters are conceptualised as situations where
visitors have a clear chance to notice and engage
with a display. As a minimum, this involves a visitor
stopping at an exhibit. Visitors might then look at
the exhibit, read the object label, look at and engage
with the display in various ways.
Analytics data was collected for mobile and
touchscreen interaction with displays. The data was
prepared for analysis by excluding touchscreen
interactions involving admin tasks (e.g. display
configuration, initial screen activation) and mobile
interactions from demonstrations (e.g. to show
visitors how NFC works). Analytics data is
structured into sessions, with a key difference
between mobile and touchscreen sessions being that
the former relate to specific users, while the latter
are anonymous and can involve multiple visitors,
e.g. when a visitor initiating a session abandons the
display and another visitor engages before the screen
times out. In order to approximate the number of
visitors engaging with touchscreens, Jenks' (1967)
natural breaks classification was used to segment the
time intervals between interactions into two clusters,
Table 1: Quantifying the attention potential of display placements in the gallery.
ParasiteFarm LillyBot2.0 RitualMachines DustMatter(s)
Distraction
Displayplacedprominently
onemptyshelfwithlittle
distractionapartfrompot‐
plantabove(Figure3a).
Rating:
1 2 3 4
LowHigh
Displayplacedperipherally
atfootofsensor‐driven
exhibitthatdominatesthe
scene(Figure3b).
Rating:
1 2 3 4
LowHigh
Displayplacedperipherally
nexttointeractiveflip‐dot
matrixandtwoiPodsto
controlmatrix(Figure3c).
Rating:
1 2 3 4
LowHigh
Displayplacedprominently
totherightoftheexhibit
belowalargevideoscreen
(Figure3d)
Rating:
1 2 3 4
LowHigh
Competition
Thereisanoptiontousea
littlespatulatodiginthe
plantboxontheshelf
belowbutthisisoftennot
noticedbyvisitors.
Rating:
1 2 3 4
LowHigh
Anotherexhibitjustfive
feetawayinvitesvisitorsto
controlablenderbyvoice,
whichisverypopularwith
visitors
Rating:
1 2 3 4
LowHigh
Visitorsareinvitedtouse
twoiPodsinfrontofthe
exhibittocontrolan
interactiveflip‐dotdisplay,
whichisverypopular
Rating:
1 2 3 4
LowHigh
Therearenointeraction
possibilitiesattheexhibit
(videoscreencan'tbe
controlled)oratother
close‐byexhibits.
Rating:
1 2 3 4
LowHigh
Satiation
1stdisplayencounteredin
atypicalgallerytour.
Rating:
1 2 3 4
LowHigh
2nddisplayencounteredin
atypicalgallerytour.
Rating:
1 2 3 4
LowHigh
3rddisplayencounteredin
atypicalgallerytour.
Rating:
1 2 3 4
LowHigh
4thdisplayencounteredin
atypicalgallerytour.
Rating:
1 2 3 4
LowHigh
Fatigue
Displayinstalledinground‐
floorgalleryat3rdexhibit
inatypicalgallerytour
Rating:
1 2 3 4
LowHigh
Displayinstalledinground‐
floorgalleryat4thexhibit
inatypicalgallerytour.
Rating:
1 2 3 4
LowHigh
Displayinstalledinfirst‐
floorgalleryat6thexhibit
inatypicalgallerytour.
Rating:
1 2 3 4
LowHigh
Displayinstalledinfirst‐
floorgalleryat10thexhibit
inatypicalgallerytour.
Rating:
1 2 3 4
LowHigh
Attention
potential
92%
50%
17%
33%
CHIRA 2018 - 2nd International Conference on Computer-Human Interaction Research and Applications
76
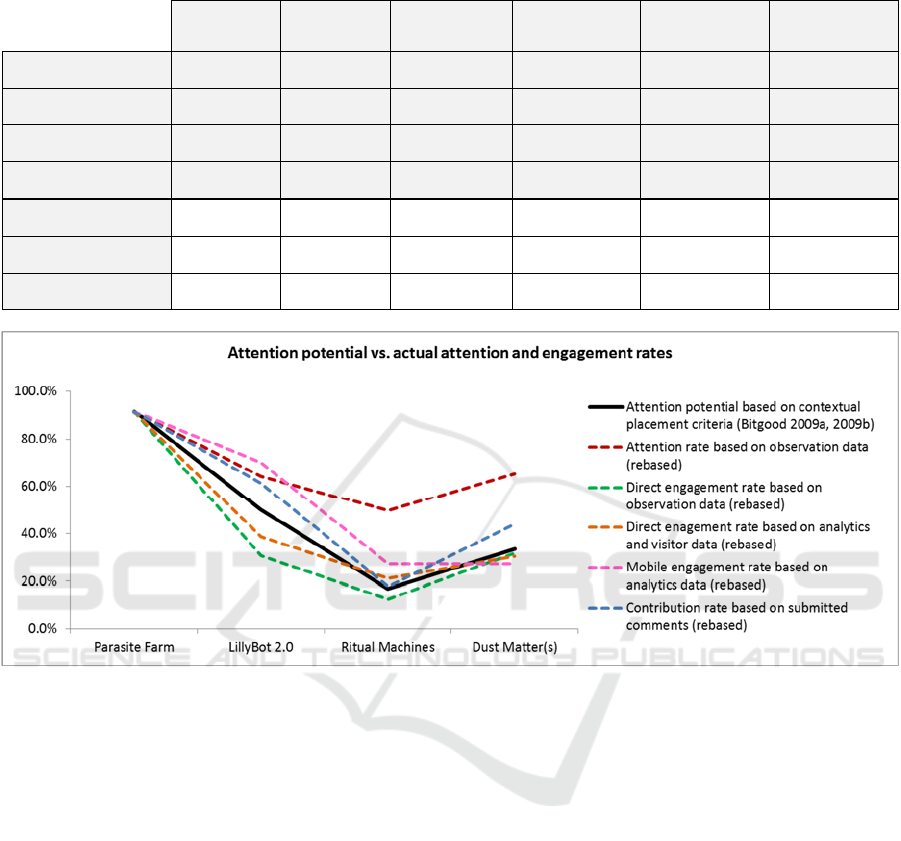
Table 2: Correlation between attention potential and measured attention and engagement.
Attention
potential
Attention
(observed)
DirectEng.
(observed)
DirectEng.
(analytics)
MobileEng.
(analytics)
Contribution
(comments)
ParasiteFarm
91.7% 86.6% 31.4% 23.7% 1.28% 0.25%
LillyBot2.0
50.0% 60.8% 10.5% 10.0% 0.97% 0.17%
RitualMachines
16.7% 47.0% 4.3% 5.4% 0.38% 0.05%
DustMatter(s)
33.3% 61.7% 10.9% 7.9% 0.38% 0.12%
Correlationr
‐ 0.97 0.97 0.98 0.93 0.98
t‐value
‐ 5.80 5.39 6.68 3.76 7.32
p‐value
‐ 0.0011 0.0017 0.0005 0.0094 0.0003
Figure 4: Correlation between attention potential and measured attention and engagement. The diagram shows values
proportionally rebased to the attention potential of Parasite Farm.
representing touches during and between individual
user sessions. The resulting disengagement threshold
was then used to estimate the number of individual
users engaging through touchscreen interaction.
Total numbers based on 1,921 analytics data logs
(excluding logs relating to admin and demonstration
activities) include 2,031 touchscreen user sessions
and 109 mobile interaction sessions.
Content contributions were measured as
comments submitted to displays by visitors. The
small number of contributions during the evaluation
period (n=21, excluding seed comments) does not
support a meaningful analysis but shall be included
nonetheless as an additional indicator of visitor
engagement with displays.
Finally, a baseline of 15,446 possible encounters
with displays during the evaluation period was
established based on Science Gallery Dublin's in-
house visitor numbers and display uptimes. As
visitor numbers are based on automatic counters
installed in the gallery and therefore include false
positives caused by double entries, trade and staff,
they represent a theoretical maximum rather than
verified visitor numbers. For the purpose of this
study, however, they are taken at face value in order
to arrive at defendable minimum values when using
them to calculate attention and engagement rates
from analytics data.
4.5 Results
Attention rates per display were calculated by
dividing the number of people observed to look at a
display by the total number of encounters observed
for that exhibit. There are marked differences in
attention rates between exhibits despite all displays
using the same design at any given time, with
observed attention being highest at Parasite Farm
(86.6%), decreasing at LillyBot 2.0 (60.8%),
reaching its lowest at Ritual Machines (47.0%) and
Quantifying the Attention Potential of Pervasive Display Placements
77

picking up again for Dust Matter(s) (61.7%).
Observed direct engagement rates per display
were calculated by dividing the number of people
observed to touch the display screen by the total
number of encounters observed for that exhibit.
Similar to observed attention, there are clear
differences in observed engagement rates between
exhibits, being highest at Parasite Farm (31.4%),
decreasing sharply at LillyBot 2.0 (10.5%), reaching
its lowest point at Ritual Machines (4.3%) and
picking up at Dust Matter(s) (10.9%).
Direct engagement from analytics data was
calculated by dividing the number of individual user
sessions for each display by the number of potential
encounters per display based on visitor numbers and
display uptime. The data shows marked differences
in engagement rates between exhibits, with
engagement being highest at Parasite Farm (23.7%),
decreasing considerably at Lillybot 2.0 (10.0%),
reaching its lowest at Ritual Machines (5.4%) and
picking up again for Dust Matter(s) (7.9%).
Mobile engagement rates per exhibit were
calculated from analytics data and visitor numbers
by dividing the number of mobile interaction
sessions with a display by the number of potential
encounters with that display and its uptime. The
mobile engagement rate is highest at Parasite Farm
(1.28%), decreases at LillyBot 2.0 (0.97%), reaches
its lowest point at Ritual Machines (0.38%) and
stays at this level for Dust Matter(s) (0.38%).
Contribution rates per exhibit were calculated by
dividing the number of submitted comments per
exhibit by the number of potential encounters for
that exhibit and its uptime. The contribution rate is
highest at Parasite Farm (0.25%), decreases at
LillyBot 2.0 (0.17%), reaches its lowest point at
Ritual Machines (0.05%) and increases again for
Dust Matter(s) (0.12%).
4.6 Findings
The data reflects visitors' contingent progression
from attention to engagement to contribution, with
large numbers failing to progress at each stage.
Regardless of absolute numbers, the different data
sets reveal a consistent pattern (Figure 4) suggesting
they are influenced by similar factors. There are
strong and significant correlations between observed
attention and observed direct engagement (r = 0.99, t
= 8.69, p < 0.01), engagement rates from analytics
data (r = 0.97, t = 5.52, p < 0.01) and contribution
rates (r = 0.96, t = 4.56, p < 0.01). The only data set
not strongly and significantly correlating to observed
attention is mobile engagement (r = 0.83, t = 2.08, p
= 0.08), which remains flat between Ritual Machines
and Dust Matter(s). While this might be attributed to
the small sample, an alternative interpretation is that
the additional physical and cognitive effort
associated with connecting a mobile device to the
display becomes more relevant in the later stages of
a visit when museum fatigue (Davey, 2005; Bitgood,
2009a; 2009b) sets in.
Regarding the predictive power of the developed
instrument, the data shows strong and significant
correlations (Table 2) not only between quantified
attention potential and observed attention rates but
also between attention potential and observed direct
engagement, direct engagement from analytics data,
mobile engagement and contributions. While these
correlations do not imply causality, they suggests
that placement-related factors are a good indicator of
how much attention and engagement a display
receives.
5 DISCUSSION
We introduced a first version of an instrument to
quantify the attention potential of pervasive display
placements. The instrument is based on the idea that
combining multiple placement criteria evens out
inaccuracies and gives a better overall representation
of attention potential. Reflecting the wider context in
which the research took place, we used placement-
related criteria relevant in museum environments
(Bitgood, 2009a; 2009b) and evaluated the
instrument in a gallery setting.
The results show significant differences in
attention and engagement rates between individual
display installations that far outweigh the small and
mostly insignificant differences between design
variations involved in the evaluation. Comparing the
attention and engagement rates for specific display
installations with their quantified attention potential
reveals strong and significant correlations.
While the correlations do not imply causality,
they suggests that the attention potential of display
placements is indicative of the relative levels of
attention and engagement the displays receive. As
such, the evaluation suggests that the developed
instrument might be a useful tool to inform
placement- and design-related decision leading up to
display deployments.
Several limitations of both the instrument and the
evaluation study must be considered with regard to
validity, reliability and generalisability. The
instrument uses only four criteria in its current form,
two of which make specific assumptions about the
CHIRA 2018 - 2nd International Conference on Computer-Human Interaction Research and Applications
78

order in which placements are encountered. While
the small number of criteria might impact on
accuracy, the implied order in two of the criteria
impacts on generalisability as it only applies to
environments where that order can be predicted. A
limitation of the evaluation study is that it is based
on only four display placements, which considerably
weakens the substantiation of found correlations and
thereby impacts on the validity and reliability of the
results.
Considering these limitations, the findings are
presented only as indicative of warranting further
investigation.
6 CONCLUSIONS
Being able to quantify the attention potential of
display placements could help to scope expectations
when deploying displays, inform design decisions
mitigating low or high attention potentials, and
calibrate measured attention and engagement against
placement-related factors when evaluating display
designs. While the literature offers a number of
insights and heuristics for the placement of displays
in order to maximise attention and engagement,
there are so far no attempts to combine multiple
heuristics into a single instrument as a way to cover
a range of relevant aspects and even out inaccuracies
when quantifying the attention potential of display
placements.
The main contribution of this paper is a first
version of an instrument to quantify the attention
potential of display placements, focusing in
particular on small interactive displays in a museum
environment. An empirical evaluation of the
instrument involving displays deployed in a real
gallery environment found strong and significant
correlations between quantified attention potential
and measured attention and engagement with
displays.
Acknowledging limitations of both the
instrument and the evaluation study, no claims are
made towards the reliability and generalisability of
findings. The aim at this stage is rather to flag up the
surprising correlation between predicted attention
potential and measured attention and engagement,
and to encourage others to adapt and evaluate the
instrument with a view to developing alternative
versions of the instrument and a more robust
evidence base for its predictive qualities. As such,
the paper presents a starting point rather than a
solution to quantifying the attention potential of
display placements.
ACKNOWLEDGEMENTS
We would like to thank visitors to the Home\Sick
exhibition at Science Gallery Dublin for unwittingly
supporting this research with their curiosity and
engagement in the gallery space.
REFERENCES
Benedict, M. L., 1979. To take hold of space: isovist and
isovist fields. Environment and Planning B: Planning
and design, 6(1), pp.47-65.
Bitgood, S., 1991. The ABCs of label design. Visitor
Studies: Theory, Research, and Practice, 3(1), pp.115-
129.
Bitgood, S., 2000. The Role of Attention in Designing
Effective Interpretive labels. Journal of Interpretation
Research, 5(2), pp.31-45.
Bitgood, S., 2009a. Museum Fatigue: A Critical Review.
Visitor Studies, 12(2), pp.93-111.
Bitgood, S., 2009b. When Is “Museum Fatigue” Not
Fatigue? Curator, 52(2), pp.193-202.
Brignull, H. and Rogers, Y., 2003. Enticing People to
Interact with Large Public Displays in Public Spaces.
In: Proceedings of the 9th IFIP TC13 International
Conference on Human-Computer Interaction
(INTERACT 2003), 1-5 September, Zurich,
Switzerland.
Cheverst, K., Fitton, D. and Dix. A., 2003. Exploring the
Evolution of Office Door Displays. In O’Hara, K. et
al. (Eds.) Public and Situated Displays: Social and
Interactional aspects of shared display technologies,
Kluwer. Ch. 6.
Dalton, N. S., Marshall, P. and Conroy-Dalton, R., 2010.
Measuring environments for public displays: A Space
Syntax approach. In: Proceedings of the ACM
SIGCHI Conference on Human Factors in Computing
Systems (CHI 2010), Extended Abstracts, 10-15 April,
Atlanta, GA, USA.
Davey, G., 2005. What is museum fatigue? Visitor Studies
Today, 8(3), pp.17-21.
Engeström, J., 2005. Why some social network services
work and others don’t - Or: the case for object-
centered sociality. [online] Available at:
<http://www.zengestrom.com/blog/2005/04/why-
some-social-network-services-work-and-others-dont-
or-the-case-for-object-centered-sociality.html>
[Accessed 04 April 2018].
Finke, M., Tang, A., Leung, R. and Blackstock, M., 2008.
Lessons Learned: Game Design for Large Public
Displays. In: Proceedings of the 3rd ACM
International Conference on Digital Interactive Media
in Entertainment and Arts (DIMEA 2008), 10-12
September, Athens, Greece.
Greenberg, S., 2011. Opportunities for Proxemic
Interactions in Ubicomp (Keynote). In: Proceedings
of the 13th IFIP TC13 International Conference on
Quantifying the Attention Potential of Pervasive Display Placements
79

Human-Computer Interaction (INTERACT 2011), 5-9
September, Lisbon, Portugal.
Hardy, R., Rukzio, E., Holleis, P. and Wagner, M., 2010.
Mobile interaction with static and dynamic NFC-based
displays. In: Proceedings of the 12th ACM
International Conference on Human Computer
Interaction with Mobile Devices and Services (Mobile
HCI 2010), 7-10 September, Lisbon, Portugal.
Hazlewood, W. R. and Coyle, L., 2009. On Ambient
Information Systems. International Journal of Ambient
Computing and Intelligence, 1(2), pp. 1-12.
Huang, E., Koster, A. and Borchers, J., 2008. Overcoming
assumptions and uncovering practices: When does the
public really look at public displays? In: International
Conference on Pervasive Computing (pp. 228-243).
Springer, Berlin, Heidelberg.
Jenks, G.F., 1967. The Data Model Concept in Statistical
Mapping, International Yearbook of Cartography 7,
pp.186-190.
Kearsley, G., 1994. Public Access Systems: Bringing
Computer Power to the People. Ablex Publishing
Corporation, Norwood, NJ.
Kules, B., Kang, H., Plaisant, C. and Rose, A., 2004.
Immediate usability: a case study of public access
design for a community photo library. Interacting with
Computers, 16(6), pp.1171-1193.
Mack, A. and Rock, I., 1998. Inattentional blindness (Vol.
33). Cambridge, MA: MIT press.
Matthews, T., Rattenbury, T., Carter, S., Dey, A. and
Mankoff, J., 2003. A Peripheral Display Toolkit.
Technical Report No. UCB/CSD-03-1258. University
of California, Berkley.
Matthews, T., Rattenbury, T., and Carter, S., 2007.
Defining, designing, and evaluating peripheral
displays: An analysis using activity theory. Human–
Computer Interaction, 22(1-2), pp.221-261.
Michelis, D. and Müller, J., 2011. The Audience Funnel:
Observations of Gesture Based Interaction With
Multiple Large Displays in a City Center. International
Journal of Human-Computer Interaction, 27(6),
pp.562-579.
Peters, C., Castellano, G. and de Freitas, S., 2009. An
exploration of user engagement in HCI. In:
Proceedings of the ACM International Workshop on
Affective-Aware Virtual Agents and Social Robots
(AFFINE '09), 2-4 November, Cambridge, MA, USA.
Riekki, J., Salminen, T. and Alakärppä, I., 2006.
Requesting Pervasive Services by Touching RFID
Tags. IEEE Pervasive Computing, 5(1), pp.40-46.
Sauro, J. and Lewis, J.R., 2012. Quantifying the User
Experience. Morgan Kaufmann: Waltham, MA, USA
Screven, C.G., 1969. The Museum as a Responsive
Learning Environment. Museum News, 47(10), pp.7-
10.
Screven, C.G., 1992. Motivating Visitors to Read Labels.
ILVS Review, 2(2), pp.183-211.
SGD, 2015. Home\Sick: Post-Domestic Bliss. Science
Gallery Dublin. [online] Available at: <https://dublin.
sciencegallery.com/homesick/> [Accessed 18 June
2018].
Serrell, B., 1996. Exhibit Labels: An Interpretive
Approach. Alta Mira Press, CA, USA.
Simon, N., 2010. The participatory museum. Museum 2.0.
[online] Available at: <http://www.
participatorymuseum.org/> [Accessed 04 April 2018].
Ten Koppel, M., Bailly, G., Müller, J., and Walter, R.,
2012. Chained displays: Configurations of public
displays can be used to influence actor-, audience-,
and passer-by behavior. In: Proceedings of the ACM
SIGCHI Conference on Human Factors in Computing
Systems (CHI 2012), 5-10 May, Austin, TX, USA.
Wang, M., Boring, S. and Greenberg, S., 2012. Proxemic
peddler: a public advertising display that captures and
preserves the attention of a passerby. In: Proceedings
of ACM International Symposium on Pervasive
Displays (PerDis 2012), 4-5 June, Porto, Portugal.
Weiser, M., 1991. The computer for the 21st century.
Scientific American, 3(3), pp.3-11.
Weiser, M. and Seely Brown, J., 1996. Designing calm
technology. PowerGrid Journal, 1.01(July 1996), pp.1-
5.
Winter, M., 2013. Inch-scale Interactive Displays for
Social Object Annotation. In: Adjunct Proceedings of
the 2013 ACM International Joint Conference on
Pervasive and Ubiquitous Computing (UbiComp
2013), Sep. 8-12, Zurich, Switzerland.
Winter, M., 2014a. Social Object Labels: Supporting
Social Object Annotation with Small Pervasive
Displays. In: Proceedings of IEEE International
Conference on Pervasive Computing and
Communications (PerCom 2014), 24-28 March 2014,
Budapest, Hungary.
Winter, M., 2014b. Ad-hoc Registration and Configuration
of Social Object Labels. In: Proceedings of ACM
International Symposium on Pervasive Displays
(PerDis 2014), 3-4 June, Copenhagen, Denmark.
Winter, M., Gorman, M.J., Brunswick, I., Browne, D.,
Williams, D. and Kidney, F., 2015. Fail Better:
Lessons Learned from a Formative Evaluation of
Social Object Labels. In: Proceedings of 8th
International Workshop on Personalized Access to
Cultural Heritage (PATCH), ACM International
Conference on Intelligent User Interfaces (IUI 2015),
29 March - 1 April, 2015, Atlanta, USA.
CHIRA 2018 - 2nd International Conference on Computer-Human Interaction Research and Applications
80
