
The Effect of Intitutional Ownership, Profitability, and Growth on
Capital Structue
Case Study on Companies Listed on The LQ45 Index, 2010–2015
Widya Aulia Sudarman and Widi Hidayat
Department of Accounting, Airlangga University, Surabaya Indonesia
widyaauliasudarman@yahoo.com, h.widi.h@gmail.com
Keywords: Agency Theory, Growth, Institutional Ownership, Pecking Order, Profitability, Static Trade-Off.
Abstract: The main objective of this research is to investigate the explanatory factors that affect the capital structure
choice of companies in the period after a global economic crisis. Explanatory variables in this study cover
institutional ownership, profitability, and growth. The investigation is based on two major competing
theories in the capital structure literature, i.e. pecking order theory/static trade-off theory and agency theory.
This research examines firms listed on the LQ45 index for the period 2010–2015. The sample was selected
through purposive sampling, with 17 firms being selected for this research. The data used in this study was
taken from annual reports. Multiple regression analysis was used to process the data and the hypotheses
were tested by means of F-statistics test and t-statistics tests at the 5% significant level. The result of the F-
test show that institutional ownership, profitability, and growth simultaneously influence capital structure.
Further, the partial t-test results show that (1) institutional ownership has an influence on capital structure,
with a positive correlation; (2) profitability and growth do not have an influence on capital structure, with a
positive correlation; (3) firms listed on the LQ45 index follow static trade-off theory in regards to
profitability and pecking order theory with regard to growth. Institutional ownership does not follow agency
theory.
1 INTRODUCTION
Business activities have been developing rapidly in
the era of globalization. Companies not only face
domestic competitors but also foreign competition
with strong funding, which results in problems for
business development. Because of this, it is
necessary for a company to be able to hold its
ground despite any economic situations they may be
facing. However, management often makes bad
decisions that can lead a company into conflicts,
especially with shareholders. These conflicts surface
because there may be a difference between two
parties’ ideas of important matters. Institutional
investors, with their high proportion of ownership,
have the ability to monitor the activities of
management and boards of commissioners, and,
since they are considered as sophisticated investors,
they will not be easily fooled by managers’ actions.
A study by Agha (2015) on manufacturing
companies in Pakistan shows that companies with
high profitability tend to have low leverage rates,
while high asset growth has no effect whatsoever on
companies’ leverage. This demonstrates that
managers in Pakistan have preferences in regard to
using internal funding, borrowing, and then equity.
This situation supports pecking order theory.
Research by Arslan and Phil (2014) and Chung and
Wang (2014) on manufacturing companies in
Pakistan during the period 2006–2009 found that
institutional ownership negatively affects leverage.
This article will empirically analyze the effect of
institutional ownership, profitability, and growth on
capital structure. The study’s subjects are companies
listed on the LQ45 index after the crisis period in
Indonesia (2010–2015).
Based on the background above, the research
questions can be formulated as follows:
1. Does institutional ownership, profitability,
and growth simultaneously affect a company’s
capital structure?
2. Does institutional ownership, profitability,
and growth partially affect a company’s capital
structure?
128
Sudarman, W. and Hidayat, W.
The Effect of Intitutional Ownership, Profitability, and Growth on Capital Structue - Case Study on Companies Listed on The LQ45 Index, 2010–2015.
In Proceedings of the Journal of Contemporary Accounting and Economics Symposium 2018 on Special Session for Indonesian Study (JCAE 2018) - Contemporary Accounting Studies in
Indonesia, pages 128-135
ISBN: 978-989-758-339-1
Copyright © 2018 by SCITEPRESS – Science and Technology Publications, Lda. All rights reserved

3. What theories are able to explain
companies’ decisions regarding capital structure
in the LQ45 index during the post-crisis period
(2010–2015)?
2 LITERATURE REVIEW
2.1 Pecking Order Theory
Pecking order theory is one of theories relating to
capital structure. It was proposed by Myers and
Majluf (1984, as cited in Husnan, 2000, p. 324) and
explains why a company determines a particular
source of funding order to fund corporate activities.
Pecking order theory states that companies prefer to
use internal funding, and if companies need external
funding to fulfil their operational activities, then
they will use the lowest risk form of borrowing
(Husnan, 2000, p. 324).
This theory relies on two factors: information
asymmetry and adverse asymmetry selection cost
(Myers & Majluf, 1984). Information asymmetry is
where those internal to a company are considered
more informed about the company’s situation than
external parties who have an interest in the
company’s activities (e.g. investors). Adverse
selection cost relates to the consequences arising
from information asymmetry between management
and investors, where investors assume that managers
are likely to publish shares if they are confident that
the stock price is overvalued. Therefore, investors
often interpret the announcement of the issuance of
shares as a negative signal, i.e. bad news about the
company’s prospects, thus resulting in a declining
share price.
On the other hand, investors assume that debt
issuance reflects the managers’ belief that the future
prospects of the company are very good and that the
market (as stated in the stock price) is not entirely
appreciative of the actual value of the company. In
this sense, the issuance of debt provides a positive
signal that the manager believes the stock price is
undervalued.
This problem can be solved by the company
through using securities that have the lowest adverse
selection risk. Retained earnings is the best choice
for management to avoid such problems because the
use of internal funds does not incur costs or require
information to investors (Ross, Westerfield & Jaffe,
2010, p. 539). This theory can explain why firms
with a high level of profitability will have low debt
levels. In addition, pecking order theory is able to
explain the interrelation between the selection of
sources of funding and the market response in
relation to the issuance of securities by the company.
2.2 Hypotheses Development
2.2.1 The Effect of Institutional Ownership
on Capital Structure
Ownership represents a source of power that can be
used to support, or otherwise, the existence of
management, and so the concentration/distribution
of power becomes relevant. In this regard,
institutional investors, such as insurance companies,
banks, investment companies, and ownership by
other institutions in the form of companies, will
encourage a more optimized oversight of insider
performance. Research by Chung and Wang (2014),
Indahningrum (2009), and Primadhanny (2016)
found that institutional ownership has a negative
effect on companies’ capital structure, which
illustrates that the presence of institutional owners
can reduce companies’ debt and thus minimize the
agency cost of debt.
Research by Agyei and Owusu (2014), Hasan
(2009), Laksana and Widyawati (2016), Larasati
(2011), Maftukhah (2013), and Nuraina (2012)
found opposing results, in that institutional
ownership positively affects companies’ capital
structure. This means that the greater the
involvement of institutional investors in monitoring,
the greater the use of debt.
H1: Institutional ownership has a positive
relationship with companies’ capital structure.
2.2.2 Profitability Effect on Capital
Structure
Profitability is the result of a series of policies and
activities conducted by management. Through
pecking order theory, Myers and Majluf (1984)
conclude that, in funding its investment activities, a
company will follow a hierarchy of risk, meaning
that a company with a high level of profitability
tends to use internal funds as opposed to external
funds, which is also in line with research conducted
by Agha (2015), Agyei and Owusu (2014), and
Indahningrum (2009).
On static trade-off theory, companies with a high
profitability rate prefer debt to fund their business
activities. This is done in order to get tax shielding
benefits, which are produced by debt, so as to
increase company value (Seftianne, 2011).
H2: Profitability has a positive relationship with
companies’ capital structure.
The Effect of Intitutional Ownership, Profitability, and Growth on Capital Structue - Case Study on Companies Listed on The LQ45 Index,
2010–2015
129

2.2.3 The Effect of Growth on Capital
Structure
Based on pecking order theory, firms with high
growth rates tend to require high funding and are
expected to have a higher level of leverage than
firms with low growth rates (Mazur, 2007). This is
due to the company's growth rate needing to be
balanced with high levels of funding, so it is
assumed that internal funding is unable to finance
such growth, forcing the company to use external
financing in the form of debt or funding sources that
have the lowest risk of information asymmetry (see
Agha, 2015; Indahningrum, 2009; Kartika & Dana,
2014)
However, based on static trade-off theory,
companies with high growth tend to decrease their
borrowing, assuming that a high growth company
will also be followed by high risks (see Alipoue,
2015; Darmayanti, 2012).
H3: Growth has a positive relationship with
companies’ capital structure.
This study also hypothesizes the simultaneous
positive correlation between the three variables and
companies’ capital structure.
H4: Institutional ownership, profitability, and
growth simultaneously have a positive relationship
with companies’ capital structure.
3 METHODS
3.1 Operational Variable Definition
The operational definitions for the variables used in
this research are as follows:
Institutional Ownership (X1): The proportion of
institutional ownership of shares at the end of the
year as measured by the percentage of shares held by
institutional investors in an enterprise (Masdupi,
2005).
Profitability (X2): A company’s ability to gain
profits. This study measures profitability using ROA
(Riyanto, 2010).
Growth (X3): Changes in total assets owned by a
company. Asset growth is measured based on a
comparison between the current period’s total assets
minus the previous period’s total assets (Saidi,
2004).
Capital structure (Y): A company’s ability to
fulfil its obligations, which is shown in the equity
used to pay debts (DER) (Brigham & Houston,
2011).
3.2 Types and Source of Data
The data in this study is secondary data, which is
data gathered, processed, and presented by other
parties. In this sense, the study data is companies’
financial reports listed on the LQ45 index during the
period 2010–2015 (downloadable from
www.idx.co.id).
3.3 Data Gathering Procedures
Data gathering procedures in this study were as
follows:
1. Literary Method
The literary method of gathering data relates to
studying books, articles, journals, internet sites,
and other papers related to the issues in this
study.
2. Documentation Method
In this method, researchers take notes on the data
published by data gathering institutions, gather
some data, and then review the secondary data,
which, in this study, relates to companies’
financial reports listed on the LQ45 index for the
period 2010–2015. Data can be downloaded from
the BEI site (www.idx.co.id) and the Indonesia
Capital Market Directory (ICMD).
3.4 Data Analysis Technique
The data analysis technique utilized in this study is
double linear regression analysis, which is used to
define relationships and how significant the effect of
the independent variables (i.e. institutional
ownership, profitability, and growth) are on the
dependent variable (i.e. capital structure).
4 RESULTS AND DISCUSSION
4.1 Descriptive Statistics
Tabel 1: Descriptive Statistics.
N
Min Max Mean Std.
Deviation
DER 102 .0000 2.8000 .677644 .5562695
Inst. Ownership 102 .1800 .9900 .651614 .2214282
ROA 102 .0100 .4390 .145962 .0940917
GROWTH 102 -.1008 .5636 .142113 .1168801
Valid N
(listwise)
102
JCAE Symposium 2018 – Journal of Contemporary Accounting and Economics Symposium 2018 on Special Session for Indonesian Study
130
4.2 Normality Test
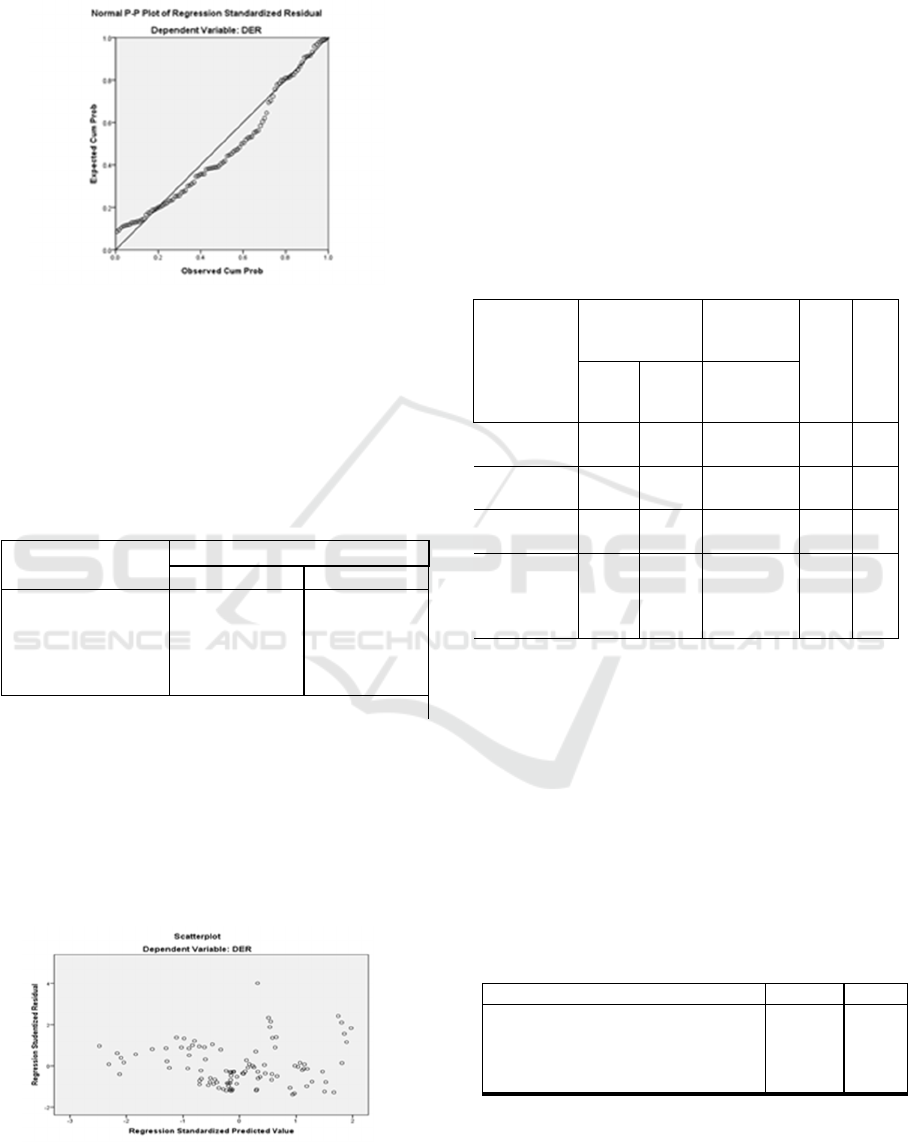
Figure 1: Normality Test Result with P-Plot.
In Figure 1, the data spreads around the diagonal
line and follows the direction of the diagonal line;
thus, it can be concluded that the data is normally
distributed and the normality test is met.
4.3 Multicollinearity Test
Table 2: Multicollinearity Test.
From the SPSS output in Table 2, the VIF value
is not greater than 10 and the tolerance values for all
the X variables are above 0.1, so it can be concluded
that there is no multicollinearity between the
independent variables institutional ownership,
profitability, and growth.
4.4 Heteroscedasticity Test
Figure 2: Heterocedasticity Test.
Figure 2 shows that the points are spread
randomly either above or below 0 on the Y axis.
This shows that heteroscedasticity on the regression
model is non-existent.
4.5 Multiple Linear Regression Results
Multiple linear regression analysis is used to
examine the influence of the independent variables
on the dependent variable, where there is more than
one independent variable in a study. The results of
the multiple linear regression analysis can be seen in
the following table:
4.6 Hypothesis Testing and Discussion
4.6.1 T-Test (Partial Test)
A t-test examines the significance and regression
coefficient individually. In this study, the researcher
used a two-part hypothesis testing approach, with α
= 5%.
The hypothesis testing follows the criteria of:
a. Ho rejection: t
calculate
> + t
table
, or if t
calculate
< - t
table
b. Ho acceptance: – t
table
≤ t
calculate
≤ + t
table
The hypotheses to be examined are:
1. Institutional Ownership (X1)
a. Ho.2: Institutional ownership does not affect
capital structure
Model
Collinearity Statistics
Tolerance VIF
1
(Constant)
ROA .917 1.090
GROWTH_ASSET .957 1.045
Inst. Ownership .902 1.108
Table 3: Multiple Linear Regression Results.
Model Unstandardized
Coefficients
Standardized
Coefficients
t Sig.
B Std.
Erro
r
Beta
(Constant) -.068 .189 -.363 .717
Inst.Ownership .882 .239 .351 3.693 .000
ROA .927 .558 .157 1.660 .100
GROWTH
_
ASSET
.255 .451 .054 .565 .573
Table 4: T Test Result.
Model T Sig.
1
(Constant) -.363 .717
Ins
t
. Ownership 3.693 .000
ROA 1.660 .100
GROWTH_ASSET .565 .573
The Effect of Intitutional Ownership, Profitability, and Growth on Capital Structue - Case Study on Companies Listed on The LQ45 Index,
2010–2015
131

b. Ha.2: Institutional ownership affects capital
structure
From the output of Table 4, the t-calculate is
3.693 while the t-table is ± 1.984, so t
calculate
> + t
table
(3.693 > 1.984), meaning that Ho is rejected. In
other words, with a positive correlation, institutional
ownership has a significant effect on capital
structure.
2. Profitability (X2)
a. Ho.3: Profitability does not affect capital
structure
b. Ha.3: Profitability affects capital structure
From the output of Table 4, the t-calculate is
1.66 while the t-table is ± 1.984, so t-calculate <+ t-
table (1.66 < 1.984), meaning that Ho is accepted. In
other words, with a positive correlation, profitability
does not significantly affect capital structure.
3. Growth (X3)
a. Ho. 4: Growth does not affect the capital
structure
b. Ha. 4: Growth affects capital structure
From the output of Table 4.4, the t-calculate is
0.565 while the t-table is ± 1.984, so t-calculate <+ t-
table (0.565<1.669), meaning that Ho is accepted. In
other words, with a positive correlation, growth does
not significantly affect capital structure.
4.6.2 F Test (Simultaneous Test)
Table 5: F Test Result.
With the hypotheses as follows:
Ho. 1: Institutional ownership, profitability, and
growth do not simultaneously affect the capital
structure.
Ha. 1: institutional ownership, profitability, and
growth affect simultaneously on capital structure
In order to examine the effect, a comparison
between the Ftable and Fcalculate was conducted.
From the Anova table, Fcalculate = 6.315 while
from F test table, Ftable = 2.7, with v1 = 3 and v2 =
98. Mathematically, 6.315 > 2.7, with the Ho criteria
of acceptance and rejection as follows:
Ho rejection : F calculate > F table
Ho acceptance : F calculate ≤ F table
Hence, Ho is rejected and the statistic test result
shows that institutional ownership, profitability, and
growth simultaneously affect capital structure.
4.6.3 Determination Coefficient
Table 6: Determination Coefficient Result.
4.7 Discussion
4.7.1 Institutional Ownership Impact on
Capital Structure
Table 7: Institutional Ownership Impact on Capital
Structure.
m
Average of
Institutional
Ownership
Number of
Company
Capital
Structure
Below Over Below Over
2010 0.69 9 8 12 5
2011 0.61 10 7 12 5
2012 0.62 9 8 11 6
2013 0.69 8 9 10 7
2014 0.70 8 9 10 7
2015 0.75 10 7 9 8
Based on the t-test result, the institutional ownership
variable partially affects capital structure, since the
t-count = 3.693 and t-table ± 1.984, so t-count> +t-
table, (3.693 > 1.984), which means that Ho is
accepted. In addition, Ha2, i.e. institutional
ownership affects a company’s capital structure, is
also accepted. This conclusion is supported by the
significance value of 0.00, which is less than α =
0.05, meaning that institutional ownership
significantly affects capital structure.
The relationship between institutional ownership
and a company’s capital structure has a positive
direction in this study. Institutional shareholders
usually hold a large proportion of the ownership of a
company. This happens because shareholders want a
third party to monitor management’s performance,
which, in this case, is the debt holders. These results
are consistent with those of Agyei and Owusu
(2014), Arshad (2009), Laksana and Widyawati
Model F Sig.
1
Regression 6.315 .001
b
Residual
Total
Model R R
Square
Adjusted R
Square
Std. Error of the
Estimate
1 .402
a
.162 .136 .5169609
JCAE Symposium 2018 – Journal of Contemporary Accounting and Economics Symposium 2018 on Special Session for Indonesian Study
132

(2016), Larasati (2011), Maftukhah (2013), and
Nuraina (2012), which show that institutional
ownership has a positive effect on a company’s
capital structure.
4.3.2 The effect of profitability on capital
structure
Based on the t-test results, it was found that the
profitability variable does not affect capital
structure, where the t-count = 1.66, and the t-table =
± 1.984, meaning that the t-count <+ t-table
(1.66<1.984), so Ho is accepted. In addition, Ha3,
i.e. profitability affects a company’s capital
structure, is rejected. In this sense, with a positive
correlation, profitability does not significantly affect
capital structure.
Table 8: Profitability on Capital Structure.
Year
Profitability
Average
Number of
Company
Capital
Structure
Below Over Below Over
2010 0.16 7 10 12 5
2011 0.19 8 9 12 5
2012 0.17 8 9 11 6
2013 0.14 10 7 10 7
2014 0.13 10 7 10 7
2015 0.09 11 6 9 8
The higher the profitability, the higher the capital
structure. On the contrary, the lower the
profitability, the lower the capital structure. High or
low profits generated by the company cannot be
guaranteed by the company’s capital structure
because this depends on uncertain economic
conditions. The positive direction shown in the
results of this study is in line with static trade-off
theory, which argues that there is a relationship
between taxes, the risk of bankruptcy, and the use of
debt caused by the decision of the capital structure
taken by the company (Brealey & Myers, 1991). The
results of this study agree with those of Putri (2012)
and Seftianne (2011), which showed that
profitability has no positive effect on capital
structure.
4.3.3 The effect of growth on capital
structure
Table 9: Profitability on Capital Structure
Year
Growth
Average
Number of
Company
Capital
Structure
Below Over Below Over
2010 0.13 10 7 12 5
2011 0.23 8 9 12 5
2012 0.16 10 7 11 6
2013 0.13 11 6 10 7
2014 0.13 11 6 10 7
2015 0.07 7 10 9 8
Based on the t-test, the growth variable has a
partially non-significant effect on capital structure;
the t-count = 0.565 and the t-table ± 1.984, so t-
count <+ t-table (0.565< 1.984), meaning that Ho is
accepted and Ha4, i.e. growth affects capital
structure, is rejected. This means that, with positive
correlation, growth does not significantly affect
capital structure. This conclusion is supported by the
significance value of 0.537, which is bigger than α =
0.05, meaning that there is no significant
relationship between growth and capital structure.
Average asset growth experienced a decrease
during the 2012–2015 period due to the difficult
economic conditions at the time, which resulted in
hardships for companies in relation to asset growth.
A positive correlation between growth and capital
structure shows that increasing asset growth will
also increase the capital structure value. Companies
who experience high growth may have minimum
sources of funding, so they will need more access to
external funds, such as debt, when compared to
companies with slower growth. The results of this
research are consistent with those of Agha (2015),
Indahningrum (2009), and Kartika and Dana (2014),
where the higher the level of company growth, the
The Effect of Intitutional Ownership, Profitability, and Growth on Capital Structue - Case Study on Companies Listed on The LQ45 Index,
2010–2015
133

more a company will use external funds, such as
debt.
4.3.4 Results of the F test (Simultant test)
The results obtained from this hypothesis testing can
be seen in the table is less than α = 0.05. Thus, Ho is
rejected, and the results of the simultaneous
statistical tests are that institutional ownership,
profitability, and growth simultaneously affect
capital structure. From the analysis, the correlation
of the independent variables on the dependent
variable is 0.136. This indicates that 13.6% of the
variation or change in the dependent variable, i.e.
capital structure (DER), can be explained by a
change or variation in the independent variables, i.e.
institutional ownership, profitability, and growth.
The remaining 86.4% can be explained by other
factors that have not been examined in this study,
such as insider ownership, liquidity, firm size,
business risk, future cash flow forecasts, debt levels
in the past, and dividend payout ratio.
5 CONCLUSIONS AND
SUGGESTIONS
5.1 Conclusions
Based on the results of the analysis and the
subsequent discussion, the following can be
concluded:
1. Institutional ownership, profitability, and growth
simultaneously affect capital structure
2. Institutional ownership significantly affects
capital structure (with a positive correlation),
meaning that increases in institutional ownership
will lead to increases in the value of capital
structure.
3. Profitability has no significant effect on capital
structure (with a positive correlation), meaning
that profitability enhancement will increase the
value of capital structure.
4. Growth has no significant effect on capital
structure (with a positive correlation), meaning
that asset growth enhancement will increase the
value of capital structure.
5. Pecking order theory can explain capital structure
decision making in regard to the profitability
variable, while static-trade off theory can explain
the growth variable.
5.2 Suggestions
Based on the research conclusions, there are some
suggestions to be made:
1. For investors and creditors
When making investment and credit decisions, it
is best to consider a company’s capital structure
policy because this policy could affect the rate of
return that will be earned by investors, in
addition to demonstrating the company’s ability
to pay principal debts and interest to creditors.
2. Future studies should:
a. Use wider samples, i.e. not only companies
listed on the LQ45 index but also companies
outside of the LQ45 index that are listed on
the BEI.
b. Extend the time period of study so as to
compare capital structure policies between
pre- and post-global crises.
c. Add factors that possibly affect capital
structure decision making so as to achieve a
broader perspective of events. The factors that
may be added include insider ownership,
liquidity, firm size, business risk, future cash
flow forecasts, past debt levels, and dividend
payout ratio.
REFERENCES
Anshori, M. and Sri, I. (2009). Metodologi Penelitian
Kuantitatif. Fakultas Ekonomi Universitas Airlangga.
Surabaya.
Agha, H. (2015). Determinants of Capital Sructure of
Cement Sector in Pakistan. European Scientific
Journal, Vol.11, No.13.
Agyei, A. and Appia, R. (2014). The Effect of Ownership
Structure and Corporate Governance on Capital
Structure of Ghanaian Listed Manufacturing
Companies. International Journal of Academic
Research in Accounting Finance and Management
Sciences, Vol. 4, No.1, pp. 109–118.
Arslan, M. and Phil. (2014). Relationship between Capital
Structure and Ownership Structure: A Comparative
Study of Textile and Non Textile Manufacturing
Firms. Public Policy and Administration Research,
Vol.4, No.11.
Brealey, R. and Myers. (1991). Principles of corporate
finance. Fourth edition. Richard D. Erwin, Inc.
Brigham, E. and Joel, F. (2001). ManajemenKeuangan II.
Jakarta: SalembaEmpat.
Chung, C. and Kainan, W. (2014). Do institutional
investors monitor management? Evidence from the
relationship between institutional ownership and
capital structure. North American Journal of
Economics and Finance, Vol 30, pp: 203–233.
JCAE Symposium 2018 – Journal of Contemporary Accounting and Economics Symposium 2018 on Special Session for Indonesian Study
134

Darmayanti, N. (2012). Pengaruh Profitabilitas,
Pertumbuhan Aktiva, dan Struktur Aktiva Terhadap
Keputusan Pendanaan pada Perusahaan Others di BEI.
Jurnal, hal: 714-730.
Husnan, S. (2000). Manajemen Keuangan “Teori dan
Penerapan Keputusan Jangka Panjang” Edisi
Keempat.Yogyakarta : BPFE.
Indahningrum, R. and Ratih, H. (2009). Pengaruh
Kepemilikan Manajerial, Kepemilikan Institusional,
Dividen, Pertumbuhan Perusahaan, Free Cash Flow,
dan Profitabilitas Terhadap Kebijakan Pendanaan
Perusahaan. Jurnal Bisnis dan Akuntansi, Vol. 11, No.
3, hal: 189-207.
Jensen and Meckling. (1976). Theory of the Firm:
Managerial Behaviour Agency Cost and Ownership
Structure. Journal of Finance Economics, Vol. 3, No.4,
pp. 305-360.
Kartika, I. (2015). Analisis Pengaruh Profitabilitas,
Likuiditas, Ukuran Perusahaan dan Tingkat
Pertumbuhan Terhadap Struktur Modal Perusahaan
Food and Beverages yang Terdaftar di Bursa Efek
Indonesia. Jurnal, hal: 606-625.
Kraus, A. and Litzenberger, R. (1973). A State-Preference
Model of Optimal Financial Leverage. Journal of
Finance, Vol. 28, No. 4, pp 911-922.
Laksana, I. and Dini, W. (2016). Pengaruh Kepemilikan
Saham, Kebijakan Dividen, Tangibility, Size dan
Profitabilitas Terhadap Struktur Modal. Jurnal Ilmu
dan Riset Akuntansi, Vol. 5, No. 4.
Larasati, E. (2011). Pengaruh Kepemilikan Manajerial,
Kepemilikan Institusional, dan Kebijakan Dividen
terhadap Kebijakan Hutang Perusahaan. Jurnal
Ekonomi Bisnis,Vol. 16, No. 2, hal: 103-107.
Maftkukhah, I. (2013). Kepemilikan Manajerial,
Kepemilikan Institusional dan Kinerja Keuangan
Sebagai Penentu Struktur Modal Perusahaan. Jurnal
Dinamika Manajemen,Vol. 4, No. 1, 2013, pp: 69-81.
Moore et al. (1999). Paper templates.In TEMPLATE’06,
1st International Conference on Template
Production.SCITEPRESS.
Nuraina, E. (2012). Pengaruh Kepemilikan Institusional
dan Ukuran Perusahaan Terhadap Kebijakan Hutang
dan Nilai Perusahaan (Studi Pada Perusahaan
Manufaktur yang Terdaftar Di BEI).AKRUAL, Vol. 4,
No. 1, hal: 51-70, e-ISSN: 2502-6380.
Primadhanny, R. (2016). Pengaruh Struktur Kepemilikan
Terhadap Struktur Modal Pada Perusahaan Sektor
Pertambangan yang Tercatat di BEI Periode 2010-
2014. Jurnal Ilmu Manajemen, Vol.4, No.3.
Putri, M. (2012). Pengaruh Profitabilitas, Struktur Aktiva
dan Ukuran Perusahaan terhadap Struktur Modal pada
Perusahaan Manufaktur Sektor Industri Makanan dan
Minuman.
Riyanto, B. (2010). Dasar-dasar Pembelanjaan
Perusahaan. Yogyakarta: BPFE.
Seftianne. (2011). Faktor-faktor yang Mempengaruhi
Struktur Modal pada Perusahaan Publik Sektor
Smith, J., 1998. The book, The publishing company.
London, 2
nd
edition.
Sugiyono. (2006). Metode Penelitian Bisnis. Bandung:
Alfabeta.
The Effect of Intitutional Ownership, Profitability, and Growth on Capital Structue - Case Study on Companies Listed on The LQ45 Index,
2010–2015
135
