
An Intelligent Defect Detection Method of Small Sized Ceramic Tile
Using Machine Vision
Linjie Yang, Mina Chong, Qiming Li and Jun Li
Quanzhou Institute of Equipment Manufacturing, Chinese Academy of Sciences, China, Quanzhou, 362200
E-mail: kidylj@fjiram.ac.cn, junli@fjiram.ac.cn
Keywords: Ceramic Tile, Defect detection, Size Parameters, Patch Strategy, Machine Vision, Chromatism Detection,
Abstract: Quality control of small sized ceramic tile is an important part for manufacturing enterprise. To improve the
efficiency and precision of ceramic tile defect detection, an intelligent detection method is proposed in this
paper. Firstly, the noise is eliminated by image pre-processing,and the geometric primitive of ceramic tile
is taken as benchmark. Meanwhile, the nearest neighbor algorithm is adopted to search measurement point,
and the size parameters are calculated by Euclidean distance. Then, local defect feature of chromatism is
obtained by patch strategy and composite contour mask. It is necessary to merge potential block to recover
original appearance of defects. Finally, the optimized parameters from feature distribution and a
discriminant function are utilized to achieve target defect detection. The experimental results show that the
method has good detection effect and high real-time performance.
1 INTRODUCTION
With the development of automation and artificial
intelligence, AVIS(Automated Visual Inspection
System) for ceramic tile is becoming increasingly
popular due to its low cost maintenance and high
accuracy. However, most of assembly line of
ceramic tile in China still adopt traditional manual
detection method because of the limitation of
automatic technology. It will inevitably bring about
the inspection errors and visual fatigue
during the process (Boukouvalas C, 1995; Karimi M
H, 2014).
Generally, the defect detection of ceramic tile is
an important step for the whole of assembly line,
because it ensures the quality of product. In the
AVIS, if a inspection task is accomplished
automatically by computers, the efficiency and
reliability of detection process are greatly improved.
Specially, for small specification of ceramic tile
which situate under the large FOV (Field of View),
the detection system requires high-speed and real-
time. Thus, designing an effective method based on
a AVIS is very important for ensuring quality of
ceramic tile.
In last few years, image processing has been
widely applied in many aspects of manufacturing.
However, few methods are applied in actual
production, in particularly the defect detection of
ceramic tile. H. Elbehiery proposed a method of
quality control for ceramic tile by integrating a
visual control stage. However, it only works well in
the defect of textured surfaces (2005). Andrade
utilized infrared images and Artificial Neural
Network to solve the issue of automatic inspection
of ceramic tile, and the performance of the technique
has been evaluated theoretically and experimentally
in laboratory, but the system has not been applied in
practical production (Andrade, 2011). Ehsan Golkar
proposed a model which allows ceramic tile
companies to perform quality inspection without
costly artificial measuring tools, and this method can
be applied in different situations of manufacturing
production line systems (2011). Cristina Costa
presented a phase correlation based algorithm for the
automatic surface inspection of ceramic tile for fault
detection, and the algorithm can be used to register
the reference and test images (2000). However, there
are very few methods have been proposed for the
defect detection of small specification ceramic tile.
In order to solve the aforementioned limitations,
a defect detection method for ceramic tile based on
the machine vision is proposed in this paper. The
works of size measurement and chromatism
detection are completed under the large FOV and
complex environment, and the proposed method
Yang, L., Chong, M., Li, Q. and Li, J.
An Intelligent Defect Detection Method of Small Sized Ceramic Tile Using Machine Vision.
In 3rd International Conference on Electromechanical Control Technology and Transportation (ICECTT 2018), pages 427-433
ISBN: 978-989-758-312-4
Copyright © 2018 by SCITEPRESS – Science and Technology Publications, Lda. All rights reserved
427
utilizes the techniques of gradient sharpening,
nearest neighbor searching algorithm, parameters
optimization, color space, geometric primitives and
composite mask etc. In the experiments, extensive
test data is provided for the subsequent quality
evaluation.
This paper is organized as follows, the overall
frame of both platform and algorithm is given in
Section II. In Section III, the strategy of image pre-
processing is illustrated in detail. The method of size
measurement is introduced in Section IV and the
chromatism detection is discussed in Section V.
Finally, the experiment and conclusion of our work
are summarized in the last two sections.
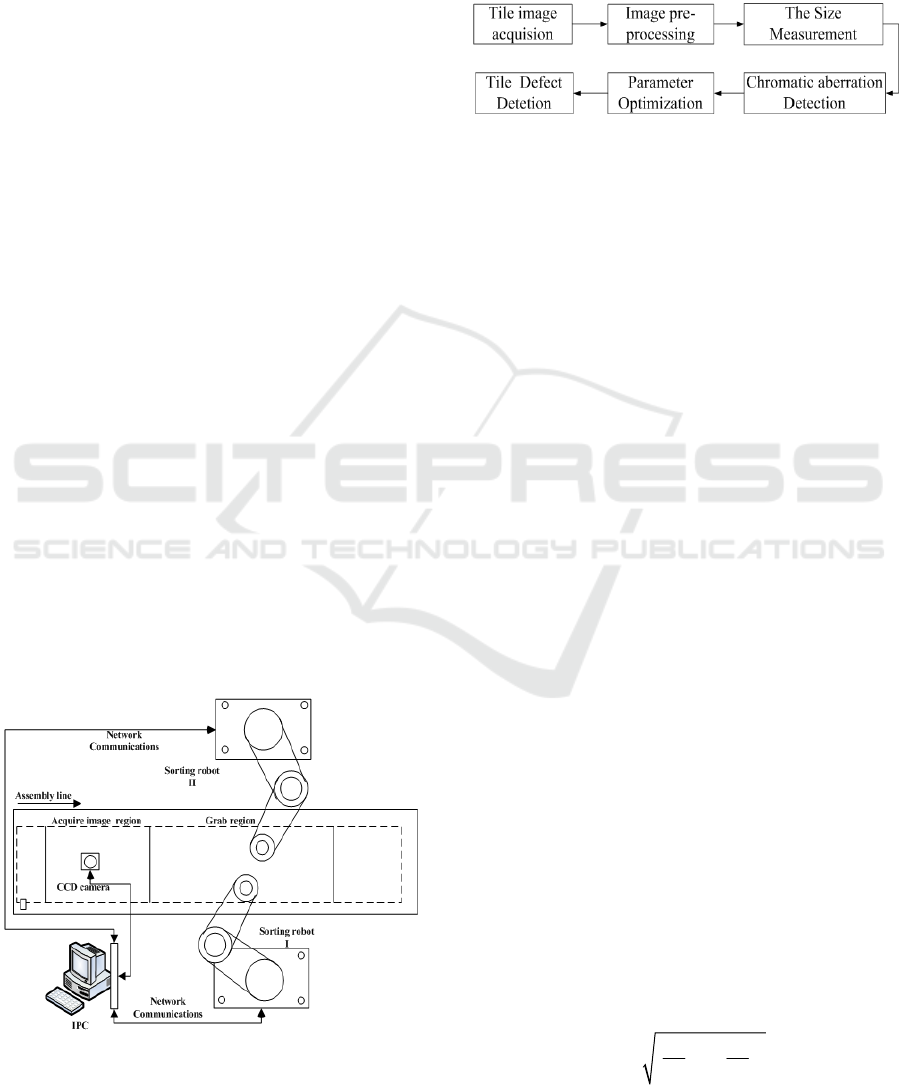
2 THE OVERALL FRAME
2.1 Hardware Platform
In our method, the locating and sorting system
mainly consists of IPC (Industrial Personal
Computer), CCD industrial camera, LED light,
EPSON robot, image processing software etc. The
overall platform is shown in Fig. 1, the whole
assembly line is divided into acquire and grab region
for the task. Firstly, the standard parameters are
acquired and stored into the database offline through
the feature model. When the visual system is
initialized, the location packet is imported to system
automatically. The center coordinates of the ceramic
tiles are obtained by location system with the
proposed algorithm, Subsequently, the coordinate
datas through system calibration are sent to the each
CSARA robot by network communication separately
(Ashraf M A, 2011; Lan M I, 2007).
Figure 1: The platform of defect detection and sorting
2.2 The Algorithm Flow
The algorithm of defect detection is achieved by
four steps in our work: image pre-processing, size
measurement, chromatic aberration detection and
parameter optimization, the main process is shown
in Fig. 2.
Figure 2: The algorithm flow of defects detection
(1) The image pre-processing consists of
sharping the image and extracting the contour.
(2) The size measurement mainly adopts
geometric primitives of contour and nearest
neighbor algorithm to search segmentation points.
(3) Chromatic detection is conducted based on
HSV color space, patch strategy and composite
mask to obtain local defect features of color.
(4) Gaussian model is adopted to obtain the
optimized standard parameters from the sample
feature distribution.
3 THE IMAGE RFEPROCESSING
Due to the perturbation from environmental
condition and noise of acquisition systems, the
image quality of ceramic tile is inevitably degraded.
It is necessary to highlight the concerned target and
enhance image contrast. Related works of improving
image quality have completed base on the both
hardware and software in this paper.
Firstly, the annular LED light and obscura are
adopted to construct the stable inspection
environmental. Moreover, an improved gradient
sharpening method is introduced to ensure that the
targets edge will not be over-smoothed.
The conventional sharpening algorithms will not
be discussed in this part (Lan M I, 2007). The
contour of detection target is a fundamental task for
subsequent detection algorithms, and the improved
sharpening method for ceramic tile will be
introduced later. For the image f(x,y), the gradient
of pixel (x, y)indicates the maximum change in
this location, and its magnitude G
M
[f(x, y)] is
defined by
22
[f(x, y)] ( ) ( )
M
f
f
G
x
y
∂∂
=+
∂∂
(1)
ICECTT 2018 - 3rd International Conference on Electromechanical Control Technology and Transportation
428
In order to reduce the computational cost, the
absolute value is adopted to replace the traditional
square operation, and the gradient modulus value is
formulated as .
[f(x, y)] (x, y) (x 1, y 1) (x 1, y) f(x, y 1)
M
Gff f=−++++−+
(2)
The pixel value is directly replaced by the
gradient value in the traditional method, by doing so,
it could result in some weaknesses with ? image
original information. Therefore, the gradient
sharpening has been improved by setting threshold
judgment in our work, and the specific formula is
'
11
''
22
[f(x, y)] [f(x, y)] T
[f(x, y)] (x, y) T (x, y)
(x, y)
MM
M
GTG
Gf fT
fother
⎧
+≥
⎪
=− ≥
⎨
⎪
⎩
(3)
'
[f(x, y)]
M
G
is the final value after above mapping,
and its maximum value is 255. T’
1
denotes a low
threshold which is used to highlight the dark details.
When the
'
[f(x, y)]
M
G
is greater than T’
1
, its value is
increased by T
1
, which can enhance the object edge.
Similarly, T’
2
denotes a high threshold, and it
restrains light regions. Based on the above analysis,
the regions in the original image with high pixel
value are retained while its dark details are enhanced
by equation 3. And the modified method increases
the contrast between the edge information and
backgrounds.
The image pre-processing is an essential step to
obtain accurate target contour. The median filter is
used to reduce the noise of image firstly. Both
the Otsu algorithm and Canny edge detection (Jiao,
2007) are used in pre-processing step to highlight
target edge, and also 8 Freeman chain code is
adopted to acquire ceramic tile contour (Galba T,
2014; Kerautret B, 2014).
4 THE SIZE MEASUREMENT
The indicators of the target size measurement are
defined as the upper width(UW), lower width(LW),
left height(LH), right height(RH), integrity(IN) and
edge straightness(ES), which cover the basic shape
features of the ceramic tile. The steps of the
measurement method mainly include two parts:
acquiring segmentation points and calculating size
parameters.
4.1 Acquiring The Segmentation Points
The most methods for ceramic tile size measurement
are given which takes its corner as the theoretical
segmentation points. However, it is difficult to
acquire stable and accurate corner location by
traditional algorithm in industry (Boukouvalas C,
1995; Karimi M H, 2014). Another strategy obtains
the intersections between borders by fitting linear of
target edges, and this method refers to these
intersections as segmentation points which are
obviously deviated from engineering practice.
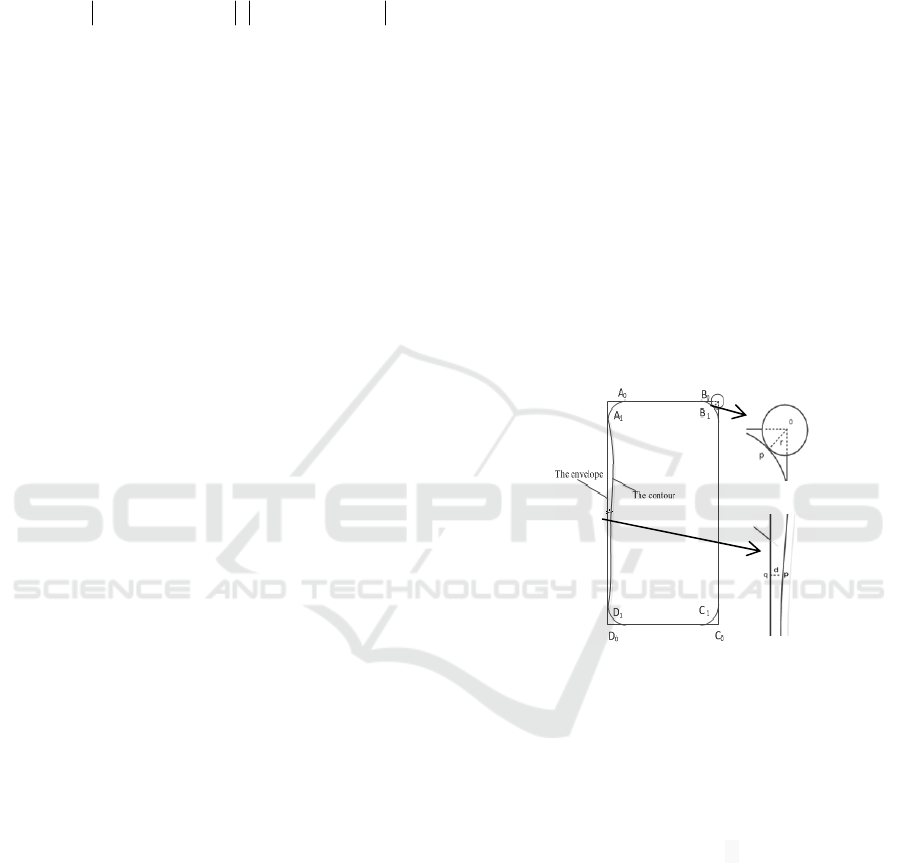
Actually, the real tile corner is circle
transitional region as shown in Fig. 3. A nearest
neighbor algorithm based on the oblique external
envelope is proposed to solve the problem
of points
segmentation
. The oblique external rectangle is an
ideal geometric primitive for ceramic tile, and the
geometric characteristic changes with the fitting
target. Furthermore, its shape property is not
affected by the target rotation and translation.
Figure3: The envelope and segmentation points of contour
How to break the closed ceramic tile contour is
the core content in this work. Taking partial enlarged
detail from upper-right corner of Fig.3 as example.
B
0
is the benchmark of the oblique external
rectangle, and B
1
is the corresponding segmentation
point of B
0
on the closed contour. r is the minimum
radius of the contour spatial neighborhood. The
nearest neighbor algorithm used for point position
segmentation is shown below.
An Intelligent Defect Detection Method of Small Sized Ceramic Tile Using Machine Vision
429

Table.1: The nearest neighbor search algorithm
Nearest neighbor search algorithm
Intput:O(x
0,
y
o
), r=r
0,
step=s , flag=false,
discri{(p(r),C(i)};
Output: Return Flag{ true, false };
1. count=0;
2.for all r do
3.r=r
0+
step;
4. if discri{(p(r),C(i)} satisfy T;
5. Flag=true;
6. else
7. Flag=false;
8. Break;
9. return Flag
The related Parameter description are illustrated
below.
(1) O(x
0
, y
0
): Envelope reference point;
(2) r: Neighborhood radius,the value is
initialized r
0
=2;
(3) Step: Radius step represents the minimum
precision of searching, and its value is set as 1;
(4) Flag :Test mark, it is initialized as false;
(5) discri{}: Discriminant function, it determines
whether the point are within the setting
neighborhood;
(6)T: Discrimination rules.
4.2 Size Parameter Calculation
The coordinates of segmentation points A
1
,B
1
,C
1
and D
1
on the ceramic tile contour are obtained
according to the process discussed in the above
section
. Subsequently, the length of the line
segments L
A1B1
, L
C1D1
, L
A1D1
, L
B1C1
are
calculated as the ceramic tile parameters of the
upper width, lower width, left height and right
height by Euclidean distance
respectively.
The contour edge of the ceramic tile is not the
ideal straight line as shown in partial enlarged view
of Fig. 3 . The p is the midpoint of the line, and q
denotes the projection of p on the endpoint straight
line. d denotes the edge straightness, and the least
square method is adopted to fit actual ceramic tile
edge. The system uses this method to fit the contour
between the segmentation points. The maximum
value of the ceramic tile straightness is defined as
ES.
5 THE CHROMATISM ETECTION
The purpose of chromatism detection for ceramic
tile is to sort products whose color differ from
standard sample. Our method uses HSV color space,
patch strategy and composite mask to obtain local
defects of chromatism.
5.1 Color Space
Comparing with other color spaces, HSV is more
closer to model of human visual cortex (Muhammad
B, 2016). Moreover, the component of H and S is
less affected by the environment. The color feature F
is generated based on the weight of the HSV color
space by .
12
()/N
t
FHS
λλ
=×+× (9)
F
t
represents the color feature generated by the I
block. H and S which represent hue component and
saturation respectively. Similarly,
1
λ
and
2
λ
are the
weight of corresponding component. N denotes the
number of pixels traversed in the setting block, and
the weight value
1
λ
=0.7,
2
λ
=0.3 in this paper after
testing.
5.2 Image Patch
Traditional strategy describes color information of
the whole region by evaluating statistic, such as
mean, variance and entropy. However, this method
can not perceive small change and it dilutes effect of
local color information. So the patch strategy for
ceramic tile is introduced to solve above problem.
The uniform block is adopted for local
segmentation in ceramic tile image. It is difficult to
guarantee that the image length and width are
integer multiples of the patch step, so the four types
of patch are produced during the process. The
specific judgment rule is analyzed by equation (10),
and g(i, j) is the discriminant function of boundary
conditions.
1 i Width&&i S Width&& j
2 &&j S && Width
(i, j) 3 &&j S &&i Width&&
iS Width
0
x
y
y
x
Hei ght
j Height Height i
gjHeight
other
<+> <
⎧
⎪
<+><
⎪
⎪
=< +<
⎨
⎪
+>
⎪
⎪
⎩
(10)
S
x
, S
y
are patch step in horizontal and vertical
direction respectively. The smaller the value is, the
higher the patch accuracy is, but the real-time of the
algorithm will be depressed. In general, step value is
adjusted by specific target dimension.
Through the above algorithm, the image patch
for ceramic tile is completed. The problem of patch
scale and surpassing boundary is solved effectivelly,
which provides a new strategy for highlighting the
local chromatic aberration.
ICECTT 2018 - 3rd International Conference on Electromechanical Control Technology and Transportation
430
5.3 Compound Contour Mask Operation
When g(i, j)={1, 2, 3}, it is shown that the patch
situates beyond contour boundary of ceramic tile,
and the segmentation ROI unit may not completely
overlap with target boundary. So the feature statistic
which involves external contour brings some errors
in the calculation.
The biggest characteristic of contour mask is
that the ROI of arbitrary shape could be dug, so that
we only care about region strictly which is needed in
image process, while other area will be shielded at
the same time. Another detail which the filling color
of contour mask may be same with the color of
target defect will be focused on in this part. A
composite mask method is used to acquire pure
color feature Ft, and the specific operation is as
follows.
(1) Two images which are the same size as the
acquiring image are initialized and the pixel value of
them is zero. We take images as the parent of the
tiled composite contour mask which are denoted as
M1, M2 respectively;
(2) The contour of ceramic tile is painted in the
M1 and M2 mask images with pixel precision
respectively, and the contour of M1 and M2 is
filled with RGB(255,0, 0) and RGB(0, 255, 255)
pixels.
(3) Then we perform “and operation” on HSV
color space of the images with mask M1, M2
respectively. If the resulted values of operation of
both M1 and M2 are equal to the original color, the
value will be retained to generate F
t
. Otherwise, they
will be ignored.
While the patch situates beyond contour
boundary of ceramic tile, step 3 will be implemented.
The compound contour mask operation can help
system to avoid interference from external contour
pixel.
6 OCATION DISCRIMINANT
6.1 Parameter Optimization
If the standard parameters are obtained directly from
the sample set off-line, the empirical errors are
inevitable in the practical calculation. Thus, the
Gaussian feature distribution is used to optimize the
standard parameters in our method.
In order to ensure the accuracy of the standard
parameters, the images of standard and defect-
free sample sets are tested directly to obtain each
parameter. Gaussian distribution is performed on
each element of sample sets.
Mean
j
μ
and standard deviation
j
σ
of each
parameter type are acquired by maximum likelihood
estimation. The
3
δ
principle is used to remove the
part of data which falls outside the model
( 3
μ
δ
− , 3
μ
δ
+ ), and then the optimized standard
parameters are obtained by averaging the processed
data. From statistics point of view, the standard
parameter obtained by distribution model can
eliminate the bad samples, and the data are more
stable.
6.2 Target discriminating
Once target does not meet the discriminantive
requirement as shown in the equation 11, the system
will terminate the judgment immediately to reduce
the determination time.
1
()
0
tj sj j
tj
if f f T
gf
else
⎧
−≤
⎪
=
⎨
⎪
⎩
where j={0,1,2 … } refers to parameter types,
()
g
indicates the discriminant function.
tj
f
is the
parameter of the test online.
s
j
f
is the optimal
standard parameter.
j
T
is the threshold which
determines the tolerance capability of qualified
product. When all the values of the corresponding
()
g
are equal to 1, it is identified as the qualified
product. Otherwise, the program terminates the at
once. The coordinate data is sent to each EPSON
robot by network communication separately.
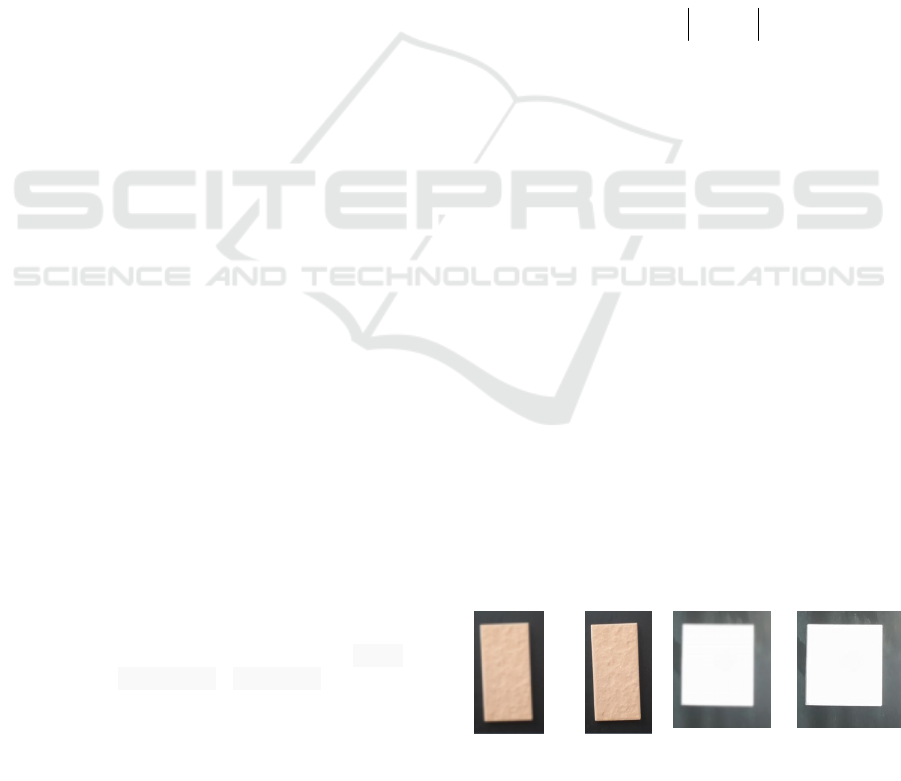
7 EXPERIMENT
1). In order to evaluate the effectiveness of the
improved sharpening method for the ceramic tile
image, we implement the image pre-processing by
before and after sharpening modification under the
same experimental conditions. Two types of ceramic
tile are used for test. We visualize the performance
improvement in Fig. 4.
Figure 4: The effect before and after of sharpening
(c)
(
d
)
(a)
(b)
An Intelligent Defect Detection Method of Small Sized Ceramic Tile Using Machine Vision
431
It can be seen that the ceramic tile edge with
modification is sharper and the contrast is stronger
than before, which facilitates subsequent size
measurements.
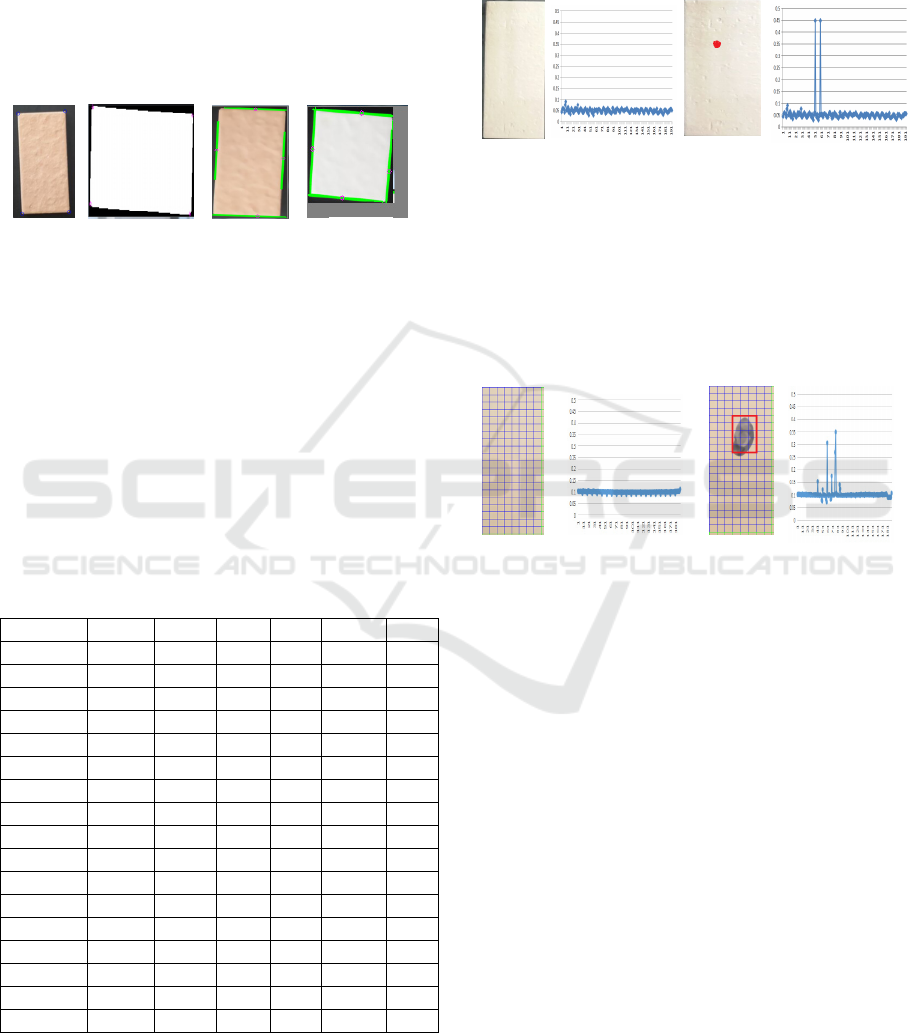
2).We test the stability and accuracy of
measurement method which is provided by section
III, and this method is adopted to measure some
indication for different types of ceramic tile, such as
segmentation points, fitting edges and the extraction
midpoints. The specific effect is shown in Fig.5.
Figure 5: The effect of size measurement
It can be observed that measurement indicators
have a precise fitting effect and it can reflect the
actual shape of the ceramic tile effectivelly. The
indication data of ceramic tile (45mm
×95mm) is
given in table 2, and the measure accuracy is 0.2mm
per pixel .
As seen in Table 2, the indicator of 15 same type
and qualified ceramic tiles are obtained, and the
deviation of resultss is very small. It indicates that
the proposed size measurement method has high
accuracy and stable.
Table 2: The indication data of ceramic tile (mm)
Test order UW LW LH RH IN
ES
1 44.6 44.6 95.2 95.0 0.959 0.2
2 44.8 44.6 94.8 94.6 0.965 0.2
3 45.0 44.8 94.6 94.8 0.958 0.4
4 45.2 45.0 94.6 94.6 0.940 0.2
5 44.8 45.0 94.8 95.0 0.950 0.4
6 44.6 44.8 94.2 94.4 0.954 0.4
7 44.6 44.6 94.6 94.8 0.956 0.2
8 44.4 44.8 94.6 94.8 0.962 0.2
9 44.8 44.6 94.4 94.6 0.965 0.2
10 44.6 44.8 95.2 95.0 0.945 0.4
11 44.6 44.4 95.0 94.8 0.974 0.4
12 45.0 45.2 95.2 95.0 0.978 0.2
13 45.2 45.0 95.0 95.0 0.985 0.2
14 45.2 45.0 95.2 95.0 0.982 0.4
15 44.8 45.0 94.8 94.6 0.965 0.2
Average 44.81 44.81 94.8 94.8 0.962 0.28
Variance 0.239 0.212 0.29 0.18 0.0120 0.09
3). For validating the strategy of chromatism
detection, the defect location detection from
ceramic tile is conducted in this subsection. As
shown in the Fig.6, c,d is the feature changes of a
and b respectively, and the feature F
t
of existing
defect patch is obvious mutation than other patchs.
The experimental result shows the validity of
chromatism detection.
Figure 6: The effect of chromatism detection
The work of merging potential block is done to
recover original appearance of defects based on
spatial information, and the feature distribution of
patch is given in Fig. 7 . The region of green line
represents that the patch situates beyond contour
boundary.
Figure7: The effect of patch and recovering original
appearance
4).To verify the precision rate of the defect
detection algorithm, 1000 ceramic tiles are used for
detecting and sorting on assembly line. The result
shows that the precision rate of the experiment with
proposed method is 91%, and the detection time is
100 per second, which basically meets the needs of
industrial production.
8 CONCLUSIONS
In this paper, an intelligent defect detection method
of
small sized ceramic tile using machine vision is
proposed in AVIS, and the main works of the
proposed method are summarized as follows.
1).An improved sharpening method is designed
for the image of ceramic tile to improve the edge
sharpness and the contrast.
(a)
(b)
(c)
(d)
(a)
(b)
(c)
(d)
(a)
(b)
(c)
(d)
ICECTT 2018 - 3rd International Conference on Electromechanical Control Technology and Transportation
432

2).The geometric primitive of contour is taken as
benchmark. The size parameters are calculated by
adopting the nearest neighbor algorithm and
Euclidean distance. The measure accuracy is 0.2mm
per pixel .
3).The local defect feature of chromatism is
acquired by patch strategy and composite mask, and
the experimental results show that the method has
good detection effect and high real-time
performance.
ACKNOWLEDGEMENTS
This work was supported by Laboratory of Robotics
and Intelligent Systems (CAS
, Quanzhou), and
Fujian Engineering Technology Center of Robot
Intelligent Control. Meanwhile, the work was
funded by Major Special Project of Fujian Province
(No.2015HZ0001-1) and Scientific and
Technological Project of Quanzhou (No.2015G109).
REFERENCES
Boukouvalas C, Kittler J, and Marik R. Ceramic tile
inspection for color and structural defects[J].
Proceedings of AMPT95, 1995, 390-399.
Karimi M H, and Asemani D. Surface defect detection in
tiling industries using digital image processing
methods: analysis and evaluation[J]. ISA transactions,
2014, 53(3): 834-844.
Elbehiery, H., A. Hefnawy, and M. Elewa. Surface
Defects Detection for Ceramic Tiles Using Image
Processing and Morphological Techniques[J]. World
Enformatika Conference, 2005,158-162.
Andrade, R. M. Deeduardo, and A. Carlos. Methodology
for automatic process of the fired ceramic tile's
internal defect using IR images and artificial neural
network [J]. Journal of the Brazilian Society of
Mechanical Sciences & Engineering, 2011,67-73.
Golkar E, Patel A, and Yazdi Ll. Ceramic tile border
defect detection algorithms in automated visual
inspection system[J]. Journal of American Science,
2011, 7(6): 542-550.
Costa C E, and Petrou M. Automatic registration of
ceramic tiles for the purpose of fault detection[J].
Machine Vision and Applications, 2000, 11(5): 225-
230.
Ashraf M A, and Kondo N, Shiigi T. Use of machine
vision to sort tomato seedlings for grafting robot[J].
Engineering in Agriculture, Environment and Food,
2011, 4(4): 119-125.
Lan M I, Hai-Bo X U. Image Mosaicing Based on Edge
Sharping[J]. Application Research of Computers, 2007,
24(5):318-320.
Jiao S, Li X, and Lu X. An Improved Ostu Method for
Image Segmentation[C], International Conference on
Signal Processing. IEEE, 2007:164-166.
Galba T, and Romi K, Baumgartner A. Edge-preserving
partial variable median filtering for fast noise
reduction in CT slices[C]. ELMAR (ELMAR), 2014
56th International Symposium. IEEE, 2014, 1-4.
Kerautret B, and Lachaud J O. Meaningful scales
detection: an unsupervised noise detection algorithm
for digital contours[J]. Image Processing On Line,
2014, 4: 18.
Muhammad B, Abu-Bakar S A R. A hybrid skin color
detection using HSV and YCgCr color space for face
detection[C]. IEEE International Conference on Signal
and Image Processing Applications. IEEE, 2016, 95-
98
.
An Intelligent Defect Detection Method of Small Sized Ceramic Tile Using Machine Vision
433
