
Glottal Attributes Extracted from Speech with Application to
Emotion Driven Smart Systems
Alexander Iliev
1,3
and Peter L. Stanchev
2,3
1
University of Wisconsin, Stevens Point, WI 54481, U.S.A.
2
Kettering University, Flint, MI 48504, U.S.A.
3
IMI – BAS, 8, Akad. G. Bonchev, Str. 1113, Sofia, Bulgaria
Keywords: Smart Systems, Speech, Emotion Recognition, Pattern Classification, Sentiment Extraction.
Abstract: Any novel smart system development depends on human-computer interaction and is also dependent either
directly or indirectly on the emotion of the user. In this paper we propose an idea for the development of a
smart system using sentiment extraction from speech with possible application in various areas in our
everyday life. Two different speech corpora were used for cross-validation with training and testing on each
set. The system is text, content and gender independent. Emotions were extracted from both female and male
speakers. The system is robust to external noise and can be implemented in areas such as entertainment,
personalization, system automation, service industries, security, surveillance, and many more.
1 INTRODUCTION
Knowledge discovery is an interdisciplinary area
focusing on creating methodologies for identifying
valid, novel, and potentially useful meaningful
patterns from data. The analysis between various data
points and the connections among them in attribute
space can be used for the creation of many practical
models for decision-making systems, that can be used
for the implementation in various smart areas. Such
systems may be based on text or time-varying speech
signals where data can be extracted in many levels.
One such level can be the semantic level: where we
would like to know the meaning of what has been
said. Although different, this level of analysis is
usually related to the syntactic level: where the user is
dealing with the grammatical validity of any given
utterance. So users are not only trying to understand
the parts of speech and how the expression was
constructed, but also they need to understand the
meaning of the message. In recent years it is
becoming more and more popular to also look into the
sentiment or emotion level: where users are trying to
extract multiple emotions from the way the utterance
is constructed or the way speech is delivered. This
alone opens up another level of smart system
development and can be used separately or in
combination with Natural Language Processing
systems while exploring parts of the speech. Since
signal processing of speech signals is more
computationally heavy procedure the main interest to
this research was speech signals alone. In addition,
there are many different emotions that can be
extracted, so we focused on few main emotions as
explained in more details in section 2 below.
2 LITERATURE REVIEW
Some of the main used areas for Emotion Systems are
(Pramod, 2017): Medicine – rehabilitation, e learning,
Entertainment, Psychology. Some of the main used
classification techniques (Avetisyan, 2016) for
Emotion Systems that have been used are: 1) Support
Vector Machines (Binali, 2010) – this is a binary
classification technique that uses training examples
and creates a model, which classifies input data in
predefined categories; 2) Naïve Bayes Classifier
(McCallum, 1998) - here, the frequencies of
occurrences of specific emotions are presented as
vectors; 3) Hidden Markov Model (Schuller, 2003) –
where classes are distributed over sequences of
observations.
According to the Robert Plutchik's theory
(Plutchik, 1980) there are eight basic emotions:
Iliev, A. and Stanchev, P.
Glottal Attributes Extracted from Speech with Application to Emotion Driven Smart Systems.
DOI: 10.5220/0006951002970302
In Proceedings of the 10th International Joint Conference on Knowledge Discovery, Knowledge Engineering and Knowledge Management (IC3K 2018) - Volume 1: KDIR, pages 297-302
ISBN: 978-989-758-330-8
Copyright © 2018 by SCITEPRESS – Science and Technology Publications, Lda. All rights reserved
297
• Fear - emotion comes with an unpleasant situation
caused from pain;
• Anger - involves a strong feeling of aggravation,
uncomfortable situation stress, displeasure, or
hostility;
• Sadness - a feeling caused with disadvantage or
loss due to anything;
• Joy - feeling happy. Other commonly used words
instead of joy are happiness, gladness;
• Disgust - a feeling with strong disapproval, nasty,
dislike;
• Surprise - occurred with an unexpected event or
shock;
• Trust - belief that someone or something is
reliable a positive emotion; admiration is
stronger;
• Anticipation - in the sense of looking forward
positively to something which is going to happen.
According to (Pramod, 2017) the most common
emotions searched and extracted are happiness’,
sadness, and disgust, along with joy, boredom, fear
and surprise. In addition, Neutral is also considered
an emotion and it treated as an emotional domain in
speech (Iliev, 2012).
Some emotion speech corpus in English are:
• KISMET (
Breazeal, 2002)
, 1002 utterances, 3
female speakers, 5 emotions;
• Baby Ears (
Slaney, 2003)
, 509 utterances, 12 actors
(6 males + 6 females), 3 emotions;
• SUSAS (
Zhang., 2014)
, 16,000 utterances, 32
actors (13 females + 19 males);
• MPEG-4 (
Anagnostopoulos, 2012)
, 2440
utterances, 35 speakers.
The most used acoustic features are
(Anagnostopoulos, 2012):
1. Maximum & Minimum counter ascent energy.
2. Mean and Median values of energy.
3. Mean and Median of energy decline in values.
4. Maximum of pitch frequency.
5. Mean and Median of pitch frequency.
6. Maximum duration of pitch in terms of frequency.
7. Mean and Median of first format.
8. Rate of change in formats.
9. Speed in voice frames.
For emotion recognition, we extract features like
pitch, intonation, duration by means of MFCC,
LPCC, PLPCS, RASTA. Then classifiers include
Gaussian-Mixture Model (GMM), Hidden-Markov
Model (HMM), Artificial-Neural Network (ANN),
Support-vector machine (SVM) and the advanced
features like General Regression NN (GRNN), Deep
Neural Network (DNN) (Anagnostopoulos. 2012).
3 SYSTEM METHODOLOGY
In this study, our focus is on processing speech
signals and extracting features that can later be
organized in rules for emotion extraction from
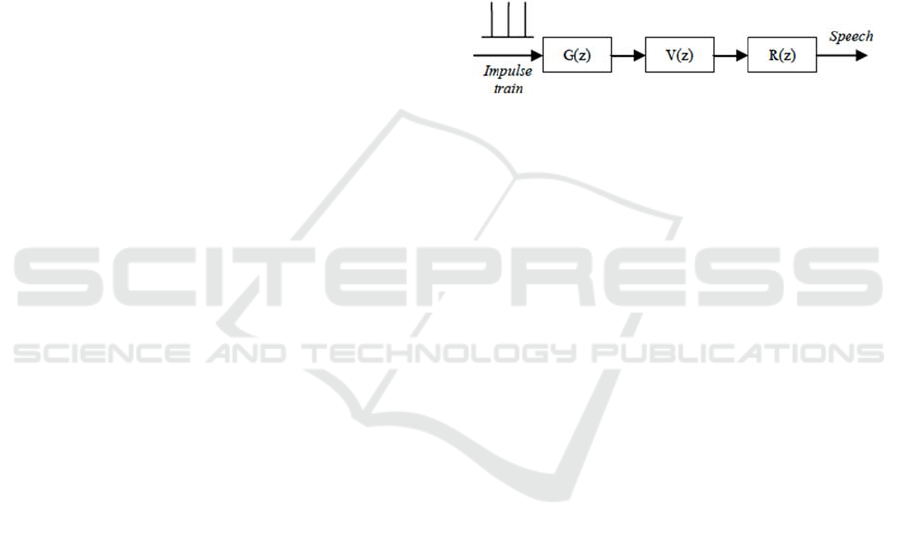
signals. The production of speech can be generalized
as consisting of three linear time-varying modules,
where at the input we supply an impulse train and at
the output we produce the speech signal as shown in
Figure 1.
Figure 1: Generalized speech production model (Iliev,
2012).
In speech expression, the excitation of the system
is mainly produced in the glottis and has quasi-
periodic characteristics. The impulse series of air
pressure directed at the glottis are sequential in time
and are formed as a result of the oscillation of the
vocal cords during the production process (Iliev,
2012). The glottal wave defines the basic frequency
of speech. The speech spectrum measured from the
speech, S (Z), can be expressed in the complex
frequency domain as:
S(z) = G(z)V(z)R(z) (1)
where, G(z) represents the glottal model and is of
interest to us, V(z) is the transfer function of the vocal
tract, and R(z) is the added effect from the radiation
at the lips.
To reproduce the spectrum of the glottal wave
from speech, the vocal tract system as well as the one
of the oral cavity must be present. For R (Z) we have
a simple first-degree filter. The coefficients of the V
(Z) filter can be easily obtained by linear prediction
(LP) analysis, autocorrelation or covariance (Rabiner,
1978), where p represents the order of prediction. The
solution of the G (Z) model of formula (1) can come
from the reverse filtering of the glottal signal, so we
can write:
G(z) = S(z)/V(z)R(z) (2)
When the model of the vocal tract is accurately
represented in the short intervals of the speech signal,
the inverse filtering can provide the glottal signal
accurately. The components of the vocal reproduction
KDIR 2018 - 10th International Conference on Knowledge Discovery and Information Retrieval
298

model are linearly separable and do not interact with
one another. In fact, vocal reproduction is influenced
by the vocal tract, which results in differences in
voice volume and energy. This inevitably alters the
structure of the sound waveform and modifies it. In
addition, variations in the glottal signal, as observed
with the use of a laryngograph, do not always reflect
such variations in the glottal airflow (O’Shaughnessy,
2000), (Quatieri, 2002). If only the main
characteristics of the voice signal are sought, such as
the opening and closing quotients of the voice stream
as well as the ratio between the opening and closing
phases (glottal symmetry), inverse filtering can not
only be an effective method in providing this
information, but is the only practical way for
calculating the glottal sound waves from speech
signals without direct intervention at the glottis. To
obtain a close estimate of the glottal signal, it is
necessary to use close estimates because in open
speech a glottal signal cannot be recorded at the
source. The quality of the resulting signal is critical to
the accuracy of the evaluation of the glottal part of the
speech reproduction system. Once recorded, the
speech is filtered to obtain the closest copy of the
waveform. The ambient sound also plays a role in the
glottal detection through inverse filtering.
There are number of methods that are related to
reverse filtering of speech (Brooks, 2006), (Moore,
2003), (Rothenberg, 1973), (Wong, 1979). The main
findings in the field are based on two groups that
differ in the way the recording was obtained: 1) inside
the oral cavity or 2) outside of the cavity, while taking
into account the influence of the lips. In a detailed
study, Rothenberg used a specially designed mask to
record sound in the lips. The analysis is limited to a
frequency of 1 kHz. The bandwidths of the first two
formants were computed using a narrow band
spectrogram and used to filter the vocal tract
information so that the glottal signal can be extracted.
Although the setup used in this study is rather
restrictive, it still offers more details on the shape of
the wave. Since this technique uses a flow mask one
of the most important contributions is that the
resulting glottal wave provides useful information
about the amplitude.
Assuming that the recording device is
appropriately calibrated then the minimum flow and
the amplitude flow (AC-flow) of the signal coming
from the glottis can be reliably obtained after inverse
filtering is applied. As mentioned in (Rothenberg,
1973), practically inverse filtering is limited to
slightly nasal or non-nasal vowels. Resonances of the
vocal tract are represented by complex conjugate
pairs of poles and are referred to as formants. The
effect created by the formats needs to be cancelled
(inverse filtered) by introducing a complex zero to
each of the vocal tract complex poles as well as a first-
order pole or resonance at the zero frequency. The
advantages of this method are: 1) imperviousness of
low frequency room noise; 2) the received signal
achieves zero frequency accuracy; and 3) better
calibration of the amplitude level using a constant
airflow. The main disadvantage is that it is performed
in controlled conditions using specialized methods,
so it may not be practical to use in normal ‘every day’
setup.
4 AUTOCORRELATION AND
LINEAR-PREDICTIVE
METHOD
One of the most commonly used algorithm for glottal
signal extraction is the covariance method. The
autocorrelation linear prediction performs really well
when used for speech recorded in noisy conditions,
which is why it is of interest to us. The waveform is
bound within the interval
1,0 N
hence for the true
output of our system y we can write:
nwknyny
(3)
where, w(n) is a fixed size Hamming window and
1,0 Nn
. N represents the number of points in the
window. The result of the liner predictor can be
expressed as:
kjN
n
jknyny
1
0
(4)
where
pj ,1
and
pk ,0
. The limits of the
window used suggest that the signal is zero outside
the sample region N. In short, the autocorrelation
formulation constructs a system of linear equations
represented in matrix form, which can be solved with
a typical Gaussian elimination. In practice, this
constitutes better efficiency since the autocorrelation
coefficients in the matrix form have a very simple
symmetric structure, allowing for a recursive
solution, hence decreasing the number of
calculations.
To make the speech recognition model more
resilient to synchronization between analytic
windows and larynx cycles, and to obtain better noise
resistance, LPC autocorrelation is used to analyse the
speech. By comparing the covariance and the
autocorrelation of a linear prediction method, there
Glottal Attributes Extracted from Speech with Application to Emotion Driven Smart Systems
299
are three basic questions to answer: 1) what is the
number of multiplications for calculating the
correlation matrix and as a consequence to find a
solution of the matrix equation; 2) how much is the
amount of memory used; and 3) what is the stability
of the system. All these values are well summarized
in (Iliev, 2012).
For the autocorrelation method, these figures are:
N for the number of data and p for the autocorrelation
matrix, which is again less than that required in the
covariance method. Finally, the autocorrelation
method is usually guaranteed to be stable when it is
calculated with sufficient accuracy. In retrospect, this
means that a sufficiently high degree of prediction
should be used. Furthermore, the stability of
prediction polynomials usually remains steady when
a speech pre-emphasis filter is used. However, in the
covariance method the stability of prediction
polynomials cannot be guaranteed. Generally, if the
number of speech samples in the analysis window is
large enough, the two methods will result to a similar
solution. Given the characteristics of the two methods
of covariance and the autocorrelation of linear
prediction, the latter remain the focus of the analysis
made on the colloquial speech data used here.
For standardized testing system in speech emotion
classification, we did the following:
1. Preparing data sets from existing rules;
2. Tuning hyper-parameters of the recognition
system;
3. Obtain attribute set using inverse filtering of
speech to extract the glottal signal;
4. Feeding the features in (3) through a classifier (2)
for testing 80% and training 20%.
5 DISCUSSION OF CORPORA
AND EXPERIMENTAL
RESULTS
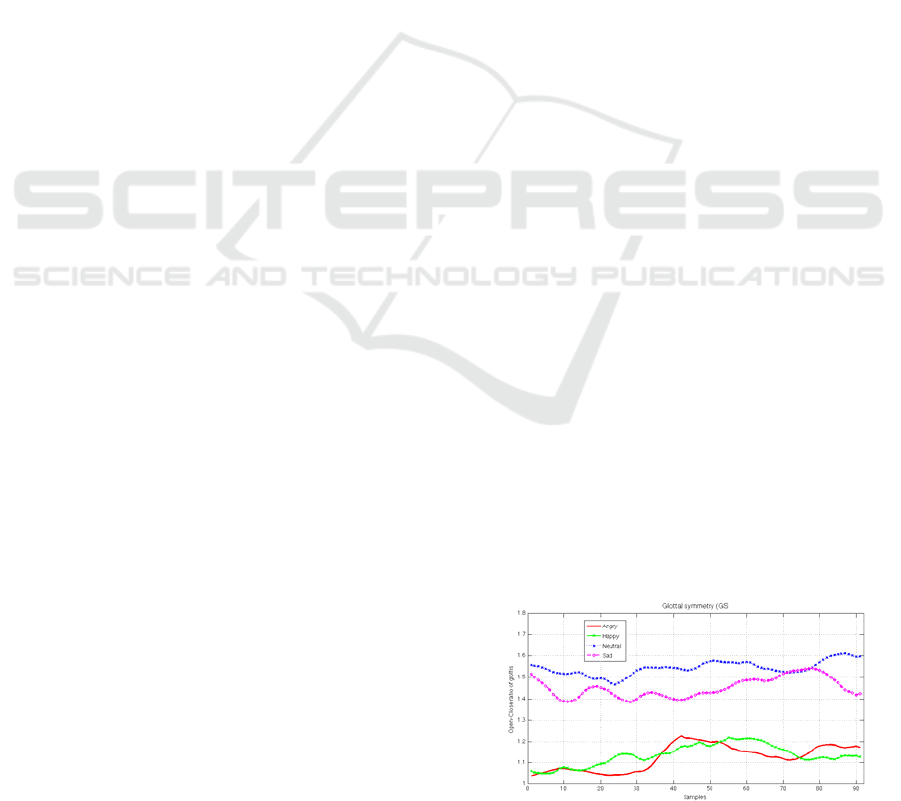
The results of our measurements are displayed in
Figures 2 through 6. Each figure shows one of the
four chosen emotions as follows: angry, happy,
neutral, and sad. Figure 2 represent all glottal
symmetries combined from all four emotions, where
a robust version of 'lowest' smoothing was used to
represent the curves. The smoothing assigns lower
weight to outliers in the regression used to make the
new representation and it assigns zero weight to all
data staying outside six mean absolute deviations. All
signals were extracted from speech using two
different corpora with different number of
participants and varying contextual connotation. The
parts of speech were irrelevant in this exercise as the
primary focus was only on the speech signal alone.
Both speech datasets represented the four emotions
with numerous observations, from different speaker
and different gender. There were short and long
sentences, so they were normalized as a general
emotion per utterance. The approach aimed to create
a system that was context, speaker and gender
independent. In the first corpus, the four emotions
were labelled in a real-world dialog. More than 2,250
utterances were labelled. Three different people
performed the labelling in order to capture the
common emotional validity of the utterances. Since
some emotions had larger representation count in this
speech corpus, and in order to make this a balanced
test we equalized the number of observations per
emotion based on the least represented emotional
state, hence making the observations for each of the
four emotional states to be equal to 300. There were
four male speakers in this set, so to make it gender
independent we used the second set, where there were
5 male and 5 female speakers used for each emotional
state. The second corpus was obtained be recording
the speakers in an anechoic chamber, while reading a
set of pre-specified utterances in the four emotional
states. In both cases, we dealt with acted speech. The
second set was shorter and was recorded in a
controlled environment, which gave us the
opportunity to add different noise conditions in the
future and expand the testing in real-world
environment. More detailed explanation of the
corpora is given in (Iliev, 2012).
As can be seen from the Figures 2-6, all four
emotional states vary in the feature domain chosen for
this exercise. When plotted together we can observe
that there is a clear separation between the more
active psychological states of happy, angry versus the
more calming and sedative ones of neutral, and sad.
This means that depending on the practical
implementation task we can develop a different
system, where rules can be extracted for areas of
different application as suggested in the literature
(Iliev, 2018), (Iliev, 2017), (Marinova, 2018),
(Stanchev, 2017).
Figure 2: Glottal symmetry for four emotional states.
KDIR 2018 - 10th International Conference on Knowledge Discovery and Information Retrieval
300
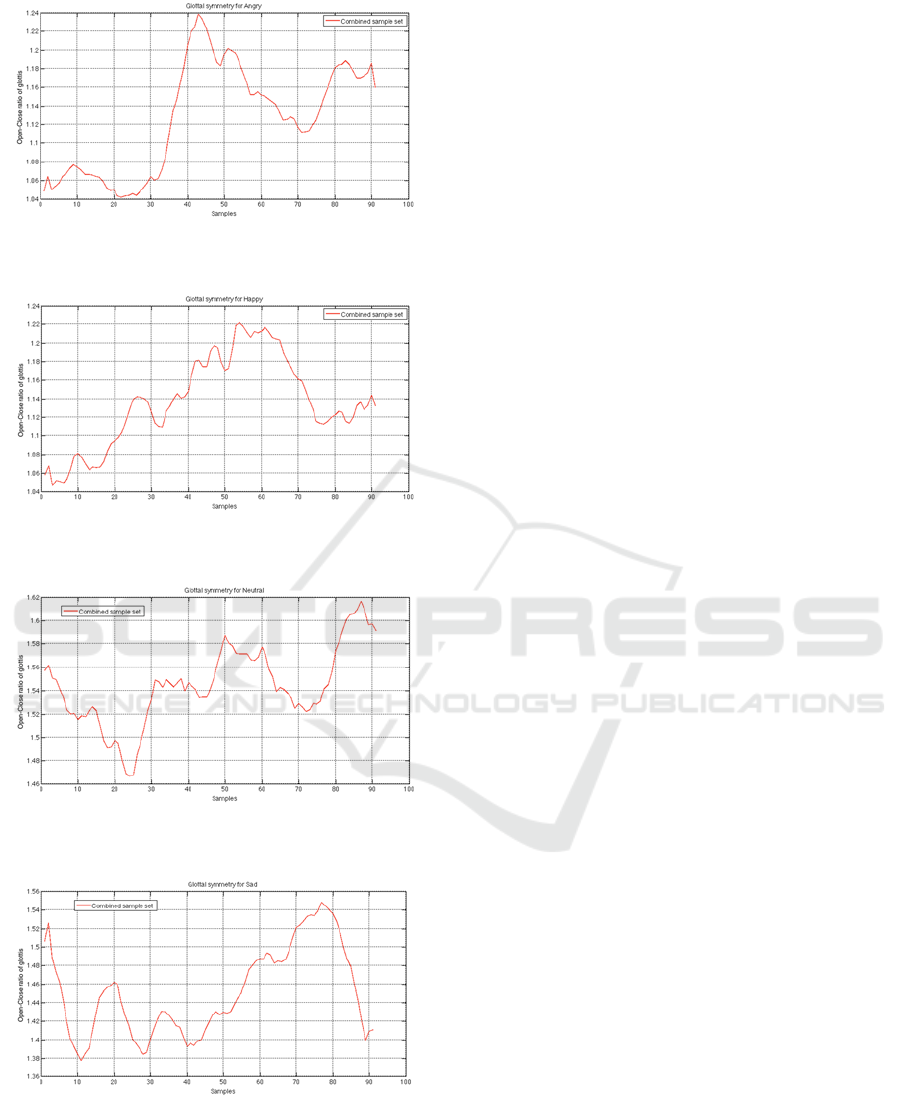
Figure 3: Glottal symmetry for Angry emotion, gender
independent.
Figure 4: Glottal symmetry for Happy emotion, gender
independent.
Figure 5: Glottal symmetry for Neutral emotion, gender
independent.
Figure 6: Glottal symmetry for Sad emotion, gender
independent.
6 CONCLUSIONS
After analysing the data collected from the
experiments, it can be concluded that the glottal
symmetry is robust and it contains emotional content,
which makes it an effective tool for performing in
various real-life applications. In addition, it was
confirmed that the glottal information is resilient
under various noisy conditions. The low frequency is
in the nature of the glottal signal and enhances its
ability to survive in harsh conditions from
heterogeneous noise and filtration.
A problem with the system may be to determine
the exact moments of the glottal events [opening,
closing] in the inverse filtering step, which has been
solved by using the appropriate group-delay (Iliev.
2012). This is especially important when the system
is tested for durability under noisy conditions.
Finally, these results prove that emotional
recognition of speech signals can be successfully
applied to any smart system based on cloud
computing services, media metadata description
services that may need personalization and even
recommendation based on speakers’ emotions.
Furthermore, it can be implemented in a gender-
separated manner when applicable. All of this can be
applied in a larger digital asset ecosystem setup where
data mining and data analytics play key roles and use
speech as important factor in extracting emotions.
ACKNOWLEDGEMENTS
This work is partly funded by the Bulgarian NSF
under the research project №DN02/06/15.12.2016
"Concepts and Models for Innovation Ecosystems of
Digital Cultural Assets", WP2 - Creating models and
tools for improved use, research and delivery of
digital cultural resources, WP3 - Designing a model
of a multifunctional digital culture ecosystem.
REFERENCES
Anagnostopoulos C., Iliou T., Giannoukos I., 2012.
Features and classifiers for emotion recognition from
speech: a survey from 2000 to 2011, Artif. Intell. Rev.,
vol. 43, no. 2, pp. 155–177.
Avetisyan H., Bruna O., Holub J., 2016. Overview of
existing algorithms for emotion classification.
Uncertainties in evaluations of accuracies, Journal of
Physics: Conference Series 772, 012039
doi:10.1088/1742-6596/772/1/012039.
Glottal Attributes Extracted from Speech with Application to Emotion Driven Smart Systems
301

Binali H., Wu C., Potdar V., 2010. Computational
Approaches for Emotion Detection in Text, 4-th IEEE
Int. Conf. Digit. Ecosyst. Technol., vol. 37, no. 5, pp.
498–527.
Breazeal C., Aryananda L., 2002. Recognition of affective
communicative intent in robot-directed speech, Auton.
Robots, vol. 12, no. 1, pp. 83–104.
Brooks M., Naylor P., Gudnason J., 2006. A Quantitative
Assessment of Group Delay Methods for Identifying
Glottal Closures in Voiced Speech. IEEE Transactions
on Audio, Speech and Language Processing, vol. 14,
no. 2, pp. 456-466.
Iliev, A., 2012. Emotion Recognition from Speech: Using
In-depth Analysis of Glottal and Prosodic Features,
Various Classifiers, Speech Corpora and Noise
Conditions, Lambert Academic Publishing, pp. 168.
Iliev, A., Stanchev, P., 2018. Information Retrieval and
Recommendation Using Emotion from Speech Signal,
in: 2018 IEEE Conference on Multimedia Information
Processing and Retrieval, Miami, FL, USA, April 10-
12, , pp. 222-225, DOI:10.1109/MIPR.2018.00054.
Iliev, A., Stanchev, P., 2017. Smart multifunctional digital
content ecosystem using emotion analysis of voice,
18th International Conference on Computer Systems
and Technologies CompSysTech’17, Ruse, Bulgaria –
June.22-24, ACM, ISBN 978-1-4503-5234-5, vol.
1369, pp.58-64.
Marinova, D., Iliev, A., Pavlov, R., Zlatkov, L., 2018.
Towards Increasing and Personalizing of User
Experience in the Digital Culture Ecosystem”,
International Journal of Applied Engineering
Research, ISSN 0973-4562, vol. 13, no 6, pp. 4227-
423.
McCallum A., Nigam K., 1998. A Comparison of Event
Models for Naive Bayes Text Classification,
AAAI/ICML-98 Work. Learn. Text Categ., pp. 41–48.
Moore E., Clements M., Peifer J., Weisser L., 2003.
Investigating the Role of Glottal Features in Classifying
Clinical Depression. 25-th Annual International
Conference of the IEEE EMBAS, pp. 2849-2852.
O’Shaughnessy D., 2000. Speech Communications –
Human and Machine. IEEE Press.
Plutchik R., 1980. Emotion: A psychoevolutionary
synthesis. Harpercollins College Division.
Pramod R., Vijayarajan V., 2017. Extraction of Emotions
from Speech - A Survey, International Journal of
Applied Engineering Research ISSN 0973-4562 vol.
12, no. 16, pp. 5760-5767.
Quatieri T., 2002. Discrete-Time Speech Signal Processing
Principles and Practice, Prentice Hall.
Rabiner L., Schafer R., 1978. Digital Processing of Speech
Signals, Prentice Hall.
Rothenberg M., 1973. A New Inverse-Filtering Technique
for Deriving the Glottal Air Flow Waveform during
Voicing. Journal of the Acoustical Society of America,
vol. 53, pp. l632-1645.
Schuller B., Rigoll G., Lang M., 2003. Hidden Markov
model-based speech emotion recognition, in 2003 IEEE
International Conference on Acoustics, Speech, and
Signal Processing, vol. 2, pp. II–1–4.
Slaney G., 2003. “Baby ears: are cognition system for
affective vocalizations,” Speech Commun., vol. 39, pp.
367–384.
Stanchev, P., Marinova, D., Iliev, A., 2017. Enhanced User
Experience and Behavioral Patterns for Digital Cultural
Ecosystems, The 9th International Conference on
Management of Digital EcoSystems (MEDES’17),
Bangkok, Thailand, 7-10. Nov., ACM, ISBN:978-1-
4503-4895-9, pp. 288-293.
Wong D., Markel J., Gray A, 1979. Least Squares Glottal
Inverse Filtering from the Acoustical Speech
Waveform. IEEE Transactions on Acoustics, Speech,
and Signal Processing, vol. ASSP-27, no. 4, pp. 350-
355.
Zhang Z., Coutinho E., Deng J., Schuller B., 2014.
Cooperative Learning and its Application to Emotion
Recognition from Speech, IEEE/ACM Trans. Audio,
Speech, Lang. Process., vol. 23, no. 1, pp. 1–1, 2014.
KDIR 2018 - 10th International Conference on Knowledge Discovery and Information Retrieval
302
