
Towards a Systematic Process-aware Behavioral Analysis for Security
Laura Genga and Nicola Zannone
Eindhoven University of Technology, Eindhoven, The Netherlands
Keywords:
Behavior Analysis, Process Mining.
Abstract:
Nowadays, security is a key concern for organizations. An increasingly popular solution to enhance security
in organizational settings is the adoption of anomaly detection systems. These systems raise an alert when
an abnormal behavior is detected, upon which proper measures have to be taken. A well-known drawback
of these solutions is that the underlying detection engine is a black box, i.e., the behavioral profiles used for
detections are encoded in some mathematical model that is challenging to understand for human analysts or, in
some cases, is not even accessible. Therefore, anomaly detection systems often fail in supporting analysts in
understanding what is happening in the system and how to respond to detected security threats. In this work,
we investigate the use of process analysis techniques to build behavioral models understandable by human
analysts. We also delineate a systematic methodology for process-aware behaviors analysis and discuss the
findings obtained by applying such a methodology to a real-world event log.
1 INTRODUCTION
The rapidly growing of security incidents and frauds
during the last years, often due to insider threats and
the lack of effective internal controls (Association of
Certified Fraud Examiners, 2018; Richardson, 2008),
has made security a key concern for organizations.
Several research efforts have been devoted both by
academics and practitioners to address such issues.
An increasingly popular solution to enhance the secu-
rity of an organization is represented by anomaly de-
tection systems (Patcha and Park, 2007). These sys-
tems aim to analyze users’ interactions with the sys-
tem in order to detect abnormal behaviors and raise
alerts when security threats are detected.
One of the main issues with these techniques is
that they model system behaviors as a black-box. In
particular, they build models of normal behavior that
are not accessible or, anyway, not easily understand-
able by human analysts. This hampers the compre-
hension of what is happening in the system and, thus,
makes it challenging to determine how to response to
the raised alerts (Costante et al., 2016).
In this paper, we investigate the potentiality of
data science, in particular of process analysis, tech-
niques for deriving white-box models of normal sys-
tem behavior, i.e. models that are actually accessible
by a human analyst, to support the detection and anal-
ysis of anomalous behaviors.
The definition of accurate behavioral models for
security is an undeveloped topic. Only a few work
have investigated this issue and, to date, a system-
atic methodology is still missing. The main aim of
this work is illustrating the benefits of applying pro-
cess analysis techniques to explore security-related
aspects, to stimulate future research in this direction.
We also propose a methodology for a systematic be-
havior analysis for security. As a proof of concept, we
exploit a real-world case study to show how existing
process analysis techniques can be employed to build
behavioral profiles tailored to the detection of secu-
rity flaws within organizational settings. We discuss
the main findings obtained from the event log at hand.
The remainder of the paper is organized as fol-
lows. Section 2 provides an overview of related work
on behavioral analysis for security. Section 3 delin-
eates the proposed methodology and Section 4 dis-
cusses the main findings derived from a real-life case
study. Finally, Section 5 draws conclusions and delin-
eates directions for future work.
2 BEHAVIORAL ANALYSIS FOR
SECURITY
Within the scope of this work, a behavior refers to
a set of activities performed by one or more entities
(either humans or software agents) on a given com-
putational system, usually tracked by some logging
460
Genga, L. and Zannone, N.
Towards a Systematic Process-aware Behavioral Analysis for Security.
DOI: 10.5220/0006944604600469
In Proceedings of the 15th International Joint Conference on e-Business and Telecommunications (ICETE 2018) - Volume 1: DCNET, ICE-B, OPTICS, SIGMAP and WINSYS, pages 460-469
ISBN: 978-989-758-319-3
Copyright © 2018 by SCITEPRESS – Science and Technology Publications, Lda. All rights reserved

mechanism (Cao, 2010). Behavioral Analysis aims to
explore event logs to gain insights on the system be-
havior, e.g., typical behavioral patterns. In the secu-
rity domain, behavioral analysis is often used to sup-
port anomaly detection. The goal of an anomaly de-
tection system is to identify system behaviors that de-
viate from what it is considered to be the desired or
normal behavior (Patcha and Park, 2007; Chandola
et al., 2009; Costante et al., 2016).
Anomaly detection systems involve a training
phase, where a model representing the normal system
behavior is learned with respect to features of inter-
ests (e.g., CPU usage, combination of users’ com-
mands), and a detection phase, where the learned
model is used to detect possible anomalies.
To build profiles of normal behavior, either su-
pervised or unsupervised techniques are usually em-
ployed. The former techniques build a classifier from
a labeled training dataset that explicitly distinguishes
normal and abnormal behavior (Shon et al., 2005; Lee
et al., 1998). On the other hand, unsupervised tech-
niques (semi-)automatically infer baseline behaviors,
which is assumed to represent the normal behavior. A
variety of techniques have been proposed to address
unsupervised anomaly detection, ranging from sim-
ple statistical observations (e.g., frequency) on the se-
lected features (Qu et al., 1998; Smaha, 1988) to data
mining techniques such as, e.g., clustering (Bolton
and Hand, 2001) or Markov chain (Ye et al., 2000).
A well-known drawback of classic anomaly de-
tection systems is that the system behavior is often
modeled as a black box; namely, the behavior is of-
ten encoded into a mathematical model that is either
not accessible or, anyway, too abstract and complex
to be easily understood by a human analyst (Etalle,
2017). Therefore, analysts are often not aware of what
is happening in the system. This poses some chal-
lenges in determining how to response upon an alert,
thus hampering the actionability of anomaly detection
systems, which is a crucial property to their applica-
tion in practice. In this work, we explore the poten-
tiality of process analysis techniques to infer white
box behavioral model, i.e., models able to represent
the end-to-end structure of the system behavior. To
this end, we adopt a process-oriented perspectives;
namely, we assume that activities supported by the
system are structured according to an underlying no-
tion of process, which poses constraints/guidelines on
the order in which activities should be executed, data
access and so on. In particular, we adopt a broad no-
tion of process, intended as a set of activities that have
to be performed in a given order to achieve a given
goal. Adopting a process-oriented perspective allows
us to map sets of activities to a specific process ex-
ecution. This introduces a level of abstraction that
provides a comprehensive overview of the system be-
havior and simplifies the understanding and analysis
of behavioral patterns.
The application of process analysis techniques for
security analysis is an under-investigated topic. A first
step in this direction has been taken in, e.g., (van der
Aalst and de Medeiros, 2005; Accorsi et al., 2013).
Those works propose to apply a process discovery
technique on an event log to infer a process model
representing the normal system behavior, i.e. the nor-
mal ordering relations existing among process activ-
ities. However, those works infer a single model of
normal behavior from the log. As shown in (Alizadeh
et al., 2018b), this can lead to misleading diagnos-
tics. Another stream of research (Adriansyah et al.,
2013; Alizadeh et al., 2018a; Genga et al., 2018) pro-
pose to detect security threats by identifying devia-
tions of the observed behavior from process specifica-
tions. However, these works typically assume that a
process model representing the normative behavior is
available, which is often not the case in real settings.
Overall, our literature review revealed the lack of
systematic approaches able to infer accurate models
of normal behavior. In the next section, we present
guidelines for a systematic behavioral analysis and
discuss the main challenges.
3 METHODOLOGY
In this section, we present a methodology for a sys-
tematic process-aware behavior analysis. The main
aims consist in (i) inferring work practices character-
izing the organization processes from the recorded be-
havior, and (ii) analyzing these practices to determine
which ones should be deemed representative of the
normal system behavior. To this end, first we need
to reconstruct behaviors according to the underlying
process; then, we have to select features that allows
identifying and grouping similar behaviors; finally,
we delve into the inferred practices to spot possible
security concerns. Next, we present each step in de-
tail.
Behavior Identification. The first step of the
methodology is to represent the logs recording the
observed system behavior in a format suitable for
the application of process analysis techniques. To
this end, the activities recorded in the log should
be grouped into process executions. Although sev-
eral organization IT systems support the generation
of this type of logs (e.g., Workflow Management Sys-
tems, Enterprise Resource Planning systems), many
Towards a Systematic Process-aware Behavioral Analysis for Security
461

logging systems are not process-aware; therefore, a
preprocessing phase might be needed to identify pro-
cess executions from the available logs. This pre-
processing phase can be further refined in two steps.
The first one is aimed to collect and properly inte-
grate process data possibly spread among several and
heterogeneous sources (e.g., Excel spreadsheets, or
database tables). To this end, Extract, Transform
and Load (ETL) methodologies and techniques de-
veloped within the data warehouse community can be
exploited (see, e.g., (Vassiliadis, 2009) for a survey on
the most commonly used ETL tools). The second one
is devoted to process identification. Logging systems
that are not driven by a notion of process provide a
simple stream of recorded activities, with no indica-
tion of which activities belong to the same process ex-
ecution. Therefore, the event log has to be processed
in order to identify and group together activities be-
longing to a single process execution. It is worth not-
ing that this challenge is far from trivial and several
research efforts have been devoted to cope with this
issue, e.g. (Ferreira and Gillblad, 2009; Walicki and
Ferreira, 2011).
The output of this step is an event log that com-
prises a collection of traces, each corresponding to
a specific process execution (also called case). Each
trace consists of a sequence of events, each recording
data related to the execution of a process activity.
Behavior Profiling. The second step of the method-
ology aims to build behavioral profiles from event
logs. This involves (i) a features selection phase,
where relevant features are identified based of the
security properties of interest, and (ii) a clustering
phase, in which behaviors similar with respect to the
selected feature set are grouped together.
As regards point (i), one can exploit both prop-
erties related to process executions (e.g., their dura-
tion) and properties related to single events (e.g., the
user who performed the corresponding activities). Al-
though this choice is strongly affected by the data
available in the event log, we can list four main gen-
eral properties that is worth considering for a security
analysis: the control-flow, which refers to the order
in which activities are performed during process exe-
cutions; the users, which refers to the distribution of
the workload among involved actors; the time, which
refers to temporal aspects of process executions (e.g.,
their durations); and, finally, the data, which refers
to any other information on the process and/or on the
process activities stored in the event log.
These dimensions are often taken into account by
process analysis techniques, and we argue that they
can provide meaningful insights that can be exploited
for the detection of security threats. As an example,
analyzing the control-flow one might detect violations
of security constraints (e.g., the skipping of some crit-
ical checking activities when assessing a loan appli-
cation); the analysis of users’ behaviors might point
out undesirable or risky practices (e.g., violations of
separation of duty constraints); the analysis of tempo-
ral aspects might reveal suspicious differences in the
completion time of process executions; and so on.
It is worth noting that feature selection is often an
incremental step, especially when little or no knowl-
edge on the underlying processes is available. In these
cases, one can proceed by selecting one dimension per
time and checking the obtained behaviors, then using
the obtained findings to further refine the elicited fea-
tures.
Once the relevant features have been identified,
behaviors clustering is performed to build behavioral
profiles, i.e. clusters of behaviors that are similar ac-
cording to the selected feature set. Behaviors clus-
tering requires determining suitable ranges for the set
of intervals of the selected features. Intervals can be
determined in several ways. A simple solution con-
sists in exploiting simple statistics, e.g. mean, me-
dian, quartiles, to manually determine the intervals;
while a more sophisticated ones consists in adopting
automatic trace clustering techniques (Hompes et al.,
2015; Song et al., 2008). The choice of the technique
depends on the set of features and on the process at
hand. For instance, if a single feature is used for clus-
tering, the use of simple statistics might be sufficient
to detect meaningful intervals; on the other hand, if
the combination of several properties is used, trace
clustering techniques offer a more effective alterna-
tive.
The output of this step consists in a set of behav-
ioral profiles, each representing a cluster of behaviors
similar with respect to a given feature set.
Behavior Analysis. The final step of the methodol-
ogy focuses on exploring the obtained behavioral pro-
files to determine which ones should be considered
representative of normal behavior and which ones
should not.
When no a-priori knowledge is available, a com-
mon practice to determine what behavior should be
considered as normal is to use statistical measures
(Alizadeh et al., 2018b). In fact, it is reasonable to
assume normal behavior to be the one occurring more
frequently in the event log. Therefore, at first one
might label as normal behavior the one correspond-
ing to the interval covering the standard deviations,
when the profiling is performed by means of statis-
tics on single features, or the one corresponding to
BASS 2018 - International Workshop on Behavioral Analysis for System Security
462

the largest cluster, when trace clustering techniques
are applied.
However, we argue that this simple labeling is not
enough to obtain a proper comprehension of the pro-
cess and further investigation should be performed.
For example, it might be the case that a behavior, con-
sidered normal with respect to a given feature, can ac-
tually raise security concerns from another perspec-
tive; or, on the opposite, behaviors that are less fre-
quent or, anyway, diverge from the normal distribu-
tion, do not reveal particular security concerns, so that
they could be labeled as normal as well.
To address this issue, as a general guideline, we
propose to analyze behavioral profiles in order to de-
termine which ones correspond to desirable working
practices and which ones do not. To this end, be-
sides analyzing behavioral models individually, we
also propose to compare the obtained behavioral pro-
files with each other. As shown in the next section,
this analysis indeed provides more in-depth under-
standing and insights of working practices.
4 CASE STUDY: BPI2012 EVENT
LOG
In this section, we present an application of the pro-
posed methodology to a real-life event log. We first
introduce the dataset; then, we present the findings
obtained by inferring and exploring behaviors from
the log.
4.1 Dataset
We used the event log recording the loan management
process of a Dutch Financial Institute, which was
made available for the 2012 BPI challenge (BPI Chal-
lenge 2012, 2012). The event log contains the events
recorded for three intertwined subprocesses: subpro-
cess A specifies how loan applications should be han-
dled, subprocess O describes how loan offers should
be handled, and subprocess W specifies how work
items are processed. For each activity, the log stores
its name, timestamp and the involved user. Moreover,
for each application the log provides the requested
amount. The first row of Table 1 shows some statistics
of the event log, namely the number of traces, activ-
ities and events, together with the minimum, maxi-
mum and mean number of events in each trace.
4.2 Behavior Identification
The BPI2012 log consists of traces grouping activities
belonging to the same process execution; thus, a pre-
Table 1: Statistics related to the entire set of traces and to
the traces corresponding to approved applications.
Behavior Cases Activities Events
Min
Events
Max
Events
Mean
Events
all 13087 36 262200 3 175 20
approved 2246 21 99925 22 163 44
processing step is not needed for this log. Neverthe-
less, analyzing this log, we observed a strong variabil-
ity among process traces. In particular, the log records
process executions related to approved applications,
declined applications, canceled applications, and run-
ning applications. It is reasonable to expect that traces
concerning the approval of applications differ signif-
icantly from traces concerning, e.g., the denial of ap-
plications. Such heterogeneity usually has a negative
effect on the results of process analysis techniques.
Among them, we decided to focus on a subset of
the traces, i.e. those related to approved applications.
This is because, from a security viewpoint, approved
applications are more critical than others, since se-
curity incidents in those process executions can re-
sult in a financial loss for the financial institute. Pro-
cess executions concerning the approval of applica-
tions are typically characterized by the occurrence of
activity A APPROVED and the absence of activities
A DECLINED, A CANCELED. We filtered the log
accordingly and obtained a new event log. The sec-
ond row of Table 1 shows statistics of the resulting
event log. There are 2246 approved applications, cor-
responding to approximately 17% of the total number
of applications.
4.3 Behavior Profiling
Behavioral profiles can be built with respect to the
dimensions discussed in Section 3. For the sake of
space, in this work we present the results for only one
dimension, namely the temporal duration of process
executions. We selected this feature since large dif-
ferences in the duration of process executions might
indicate differences in the conscientiousness applied
in the approval of application, which is in general un-
desirable.
From the event log we observed that the mean
time of approval is around 17 days; to delve more into
the temporal dimension, we plot histogram related
to applications completion times in days, reported in
Figure 1. The distribution shows that applications are
mainly closed before 40 days; analyzing the event log,
we observed that most of the applications are closed
within 10-30 days. However, there are some notable
outliers, some of which required much more time. It
is also worth noting that we even have a set of appli-
cations closed in less than one day.
Towards a Systematic Process-aware Behavioral Analysis for Security
463

Figure 1: Histograms of temporal duration of approved ap-
plications in logarithmic scale.
Table 2: Statistics of the event logs related to approved ap-
plications.
Behavior Cases Activities Events
Min
Events
Max
Events
Mean
Events
long 292 21 20059 26 163 69
normal 1877 21 77284 22 109 41
short 50 20 1855 22 70 37
instant 27 19 727 22 49 27
These differences in the duration of process exe-
cutions confirm that the temporal dimension is indeed
relevant for this dataset. If on the one hand these dif-
ferences might simply be due, for instance, to differ-
ent customers (e.g., the procedure is likely to be much
smoother and shorter for well-known customers than
for new ones); on the other hand, they might also be
due to shallow checking or even abuses. Since we are
considering a single feature, we exploited some ba-
sic statistics for behavior clustering. The mean dura-
tion time for approved applications is 16.8 days, with
a standard deviation of 9.75. Therefore, we marked
as normal behavior all applications approved in more
than six days and in less than 27 days. Applications
longer than 27 days are marked as long applications.
We partitioned shorter applications in two classes:
short applications, i.e. applications approved in more
than 1 day and in less than 6, and instant applications,
i.e. applications that were approved in few hours and
hence result of particular interest for the scope of our
analysis. Red lines in Figure 1 delimit the portion of
applications belonging to each class (e.g., the first line
delimits the portion related to instant applications, the
second line short applications and so on). Table 2
shows some statistics for the logs corresponding to
the classes of behaviors considered in our analysis.
Note that other statistics, as well as trace clustering
techniques, could been used as well to discriminate
behaviors.
4.4 Behavior Analysis
The last step of the methodology in Section 3 involves
a comparative analysis of the obtained behavioral pro-
files to support analysts in characterizing normal be-
haviors from abnormal ones. Next, we show the
results of the comparison considering control-flow,
time, users and loan amount as features.
Control Flow. The first feature we consider for the
comparison is the control-flow of the behavior clus-
ters. By comparing the control-flow we expect to re-
veal differences in whether and how activities are per-
formed within each cluster. In particular, we can de-
termine, for example, whether some checking activi-
ties tend to be delayed or completely skipped in some
cluster.
To determine the control-flow, we need to uncover
the process structure from the event log. To this end,
we employ process discovery techniques, which ana-
lyze the ordering relations among events stored in the
event log to infer a process model. Since our process
is rather complex and involves many different vari-
ants, we apply a heuristic technique that only high-
lights the most relevant process behaviors. More pre-
cisely, we use Disco
1
, a well-known tool for process
discovery.
Given an event log, Disco returns a process model
in which each node corresponds to a process activ-
ity and each edge represents an ordering relation be-
tween a pair of activities. Only activities and relations
whose frequency is above a user-defined threshold are
reported. For our analysis we used the default set-
tings. Figure 2 shows the process model returned by
Disco for long applications. The numbers inside the
boxes and above the edges show the maximum num-
ber of repetitions within a trace of the corresponding
activity/relation. On the edges it is also displayed, in
lighter black, the average time between the pair of ac-
tivities.
The discovered model highlights three main
phases of the process. The top one involves some
initial activities concerning the submission of the
application and the starting of the process; the central
part involves activities related to the check of the
application and to the creation and the negotiation
of an offer with the applicant; finally, the bottom
part comprises additional controls on the application,
e.g. fraud checking, together with the finalization of
the application. For the other types of applications
(Table 2), we found almost the same structure, with
some minor variations (e.g., some missing activities
1
https://fluxicon.com/disco/
BASS 2018 - International Workshop on Behavioral Analysis for System Security
464
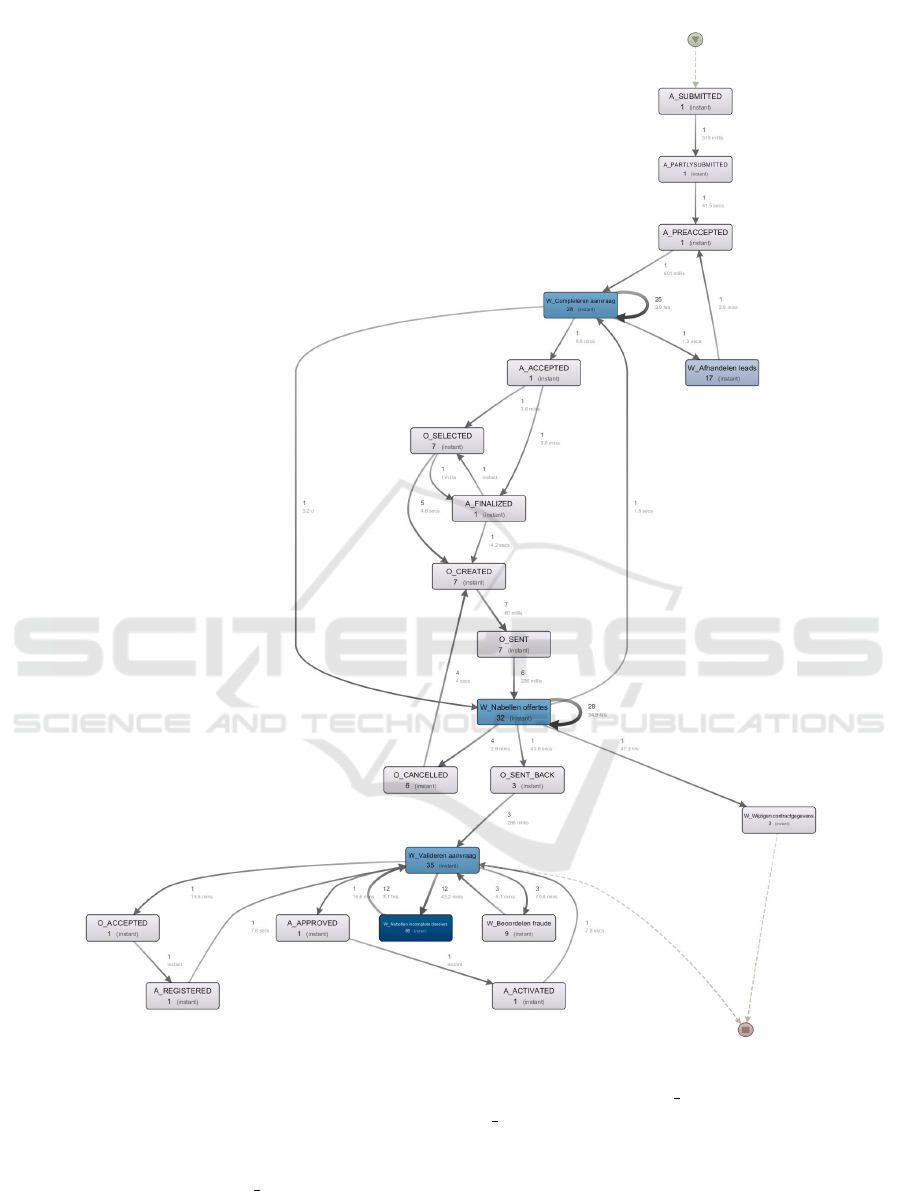
Figure 2: Activities flow of long applications.
in shorter applications). The main differences lie in
the number of times activities are repeated, especially
concerning activities related to application check,
and in the average times between pairs of activi-
ties. For example, activity W Completerenaanvrag
was repeated a maximum of 7 times within in-
stant applications, against a maximum of 28 for
normal applications. Moreover, the average time
between activities W Completerenaanvrag and
W Nabellenoffertes is less than two minutes, against
an average time of 3 days for the normal cases. This
implies that instant applications were characterized
by few rounds of checking and a very quick interac-
tion with the applicant.
Another interesting difference is that some
process activities have not been performed in
Towards a Systematic Process-aware Behavioral Analysis for Security
465
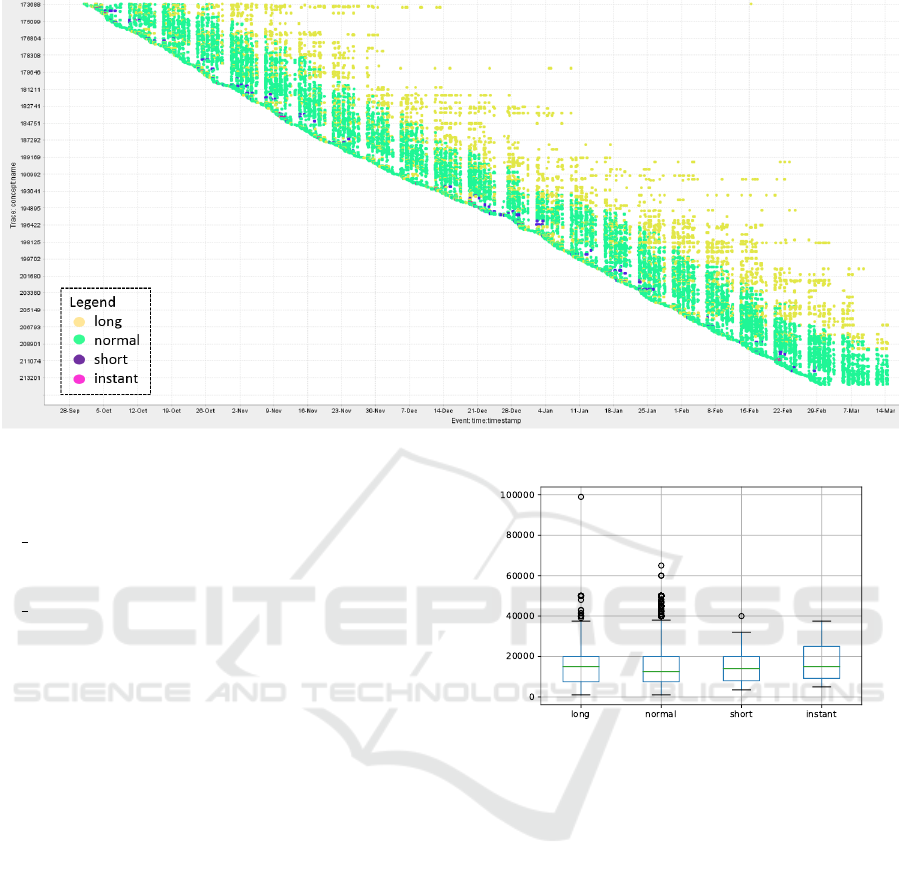
Figure 3: Workload distribution over time for approved applications.
shorter applications (i.e., short and instant).
In particular, in those applications activity
W Wi jzigencontractgegevens was not executed,
indicating that there were no changes made to the
contract after the approval. In addition, activity
W Beoordelenfraude was not performed in instant
applications, indicating that a check for possible
frauds was never performed for these applications.
Time. The second features we take into account for
our comparison is the temporal distribution of activi-
ties. In particular, we intend to analyze how activities
in different behavioral profiles are distributed among
working days and week-ends. Since the BPI2012 log
concerns a financial institute, we expect activities to
be executed only from Monday to Saturday; activ-
ities performed on Sunday would represent an un-
usual, possibly suspicious, behavior that needs to be
checked.
Figure 3 displays a dotted chart showing the activ-
ities performed within each process execution against
the corresponding days, thus allowing us to explore
process workload over time. The x-axis represents
the events’ timestamps, whereas the-y axis the trace
identifiers. Colors represent classes of behaviors.
We can observe that process activities of long and
normal applications are mainly grouped in bunches,
separated by inactivity periods. Checking the corre-
sponding timestamps, we observed that these inter-
ruptions correspond to week-ends. In this respect, it
is worth noting that, although the workload is much
less intense, many activities were also performed dur-
ing the week-end. We could not find a similar case
Figure 4: Distribution of the amount requested for each pro-
cess behavior.
for the short and instant applications. However, we
observed some regularities in instant applications, i.e.
they tended to occur in groups of three or four.
Amount. We also analyzed the distribution of the
requested amounts for each behavioral profile to de-
termine whether there exist a correlation between
them. It is reasonable to expect to find some corre-
lation between the requested amounts and the dura-
tion of the process since higher amount should require
more careful controls and negotiations with the appli-
cant. In general, the approval of applications request-
ing high amounts in short period of time could be un-
desirable and might deserve further investigations to
understand the reasons.
The results of the analysis are reported in Figure 4.
It is worth noting that the distribution of requested
amounts look roughly the same for the different be-
havioral profiles, with the exception of some high val-
BASS 2018 - International Workshop on Behavioral Analysis for System Security
466

ues that occur mostly in the normal and long appli-
cations (marked as outliers in the figure). Even more
surprisingly, it looks like instant applications involved
amounts overall higher than amounts requested in
other applications. Nonetheless, it is worth noting that
we have less cases for this type of applications, which
means that variations of even few cases have a larger
impact on the overall distribution.
To confirm that this difference is statistically not
significant, we also performed a hypothesis testing,
comparing the distribution of the amounts requested
in normal applications with the distribution of the
amount requested in the other classes of applications.
Since the distributions of amounts do not fit the nor-
mality assumption, we adopted a non-parametric test.
In particular, we used the WilcoxonMannWhitney
two-sample rank-sum test (Mann and Whitney, 1947),
which is a test commonly used when the assumptions
of t-test are not met.
Note that we have a sufficient number of samples
to perform this test for almost all pairs.
2
The only
exception is the comparison between the normal and
instant applications; nevertheless, we have 27 appli-
cations for the latter, so the results we obtain can be
still considered a good approximation.
For the testing between normal and long applica-
tions, we obtained a p-value of 0.28; between nor-
mal and short applications we obtained a p-value of
0.69; finally, between normal and instant applications
we obtained a p-value of 0.40. Since differences be-
tween distributions are typically considered of statis-
tically significance when the p-value is smaller than
0.1, the obtained values confirm that the differences
we observed for the amounts requested in the different
classes of applications are not statistically relevant.
Users. The process at hand involves several, and of-
ten iterated, activities related to the management and
checking of applications. Therefore, by analyzing the
workload distribution we can grasp some insights on
whether duties tend to be distributed among different
actors. Such information can help analysts in un-
derstanding whether the responsibilities are properly
distributed among users. As an example, one can
check whether critical activities (e.g., the approval
of an application) are performed by different users,
or, instead, few users performed most of the critical
activities. The latter is an undesirable situation since
it might indicate violations of separation of duty
constraints.
2
Common rule-of-thumb for the applicability of Wilcoxon-
Mann-Whitney test is to have at least 30 samples per
group.
Table 3: Workload distribution over users for approved ap-
plications.
Behavior Min Actors Max Actors Mean Actors
long 5 28 12.5
normal 3 20 7.3
short 3 10 5.3
instant 2 5 2.6
We analyzed the number of different users in-
volved in each process execution, computing the min-
imum, maximum and average number for each behav-
ioral profile. Results are reported in Table 3.
It is worth noting that different behavioral profiles
are characterized by a different workload distribution.
In particular, while longer applications seem to nor-
mally involve many different actors in their execu-
tions, much less actors are normally involved in the
approval of shorter applications. This is especially
evident for instant applications, in which two to five
employees always performed of all process activities.
5 DISCUSSION AND
CONCLUSION
In this work, we performed a preliminary exploration
of the potentialities of process-aware behaviors anal-
ysis for security. We adopted a process-oriented per-
spective to structure raw data recorded by logging
systems. By exploiting this representation, we de-
lineated a methodology to build accurate and under-
standable behavioral profiles that can assist analysts
in the understanding of the current work practices.
We applied the proposed methodology to a real-world
event log, providing some concrete examples of how
off-the-shelf process analysis techniques and tools
can be used to explore several security-related aspects
of process executions along different dimensions.
Despite our analysis showed that process-aware
behavioral analysis has great potentialities when ap-
plied to security, it presents a number of challenges.
Next, we list some of the most relevant ones:
• Data Collection & Preprocessing: Our analysis
assumes that it is possible to obtain an event log
grouping all activities related to the same process
execution. Although the log used in our case study
meets this demand, this is not always the case. In
many IT systems, log data might be spread along
several and heterogeneous data sources (e.g., Ex-
cel spreadsheets, databases). This requires re-
trieving all scattered data and merging them in a
proper format for the analysis. Even when events
have been reconstructed along with the relevant
information, additional challenges have to be face
Towards a Systematic Process-aware Behavioral Analysis for Security
467

to identify which events belong to the same pro-
cess execution (Alizadeh et al., 2018b). Solving
such challenges is far from being trivial.
• Features Selection: The choice of the features to
be considered depends on the application domain
and scope of the analysis. In particular, it requires
background knowledge of the underlying process
and prior knowledge of what to look for, which
is not always the case, especially in the security
context. On top of this, the analysis is constrained
by the information available in the log.
• Technique Choice: There is not a one-fit-all tech-
nique for all cases. The choice of the techniques
to be used for the analysis depends on the scope
of analysis and type of data. This requires expe-
rienced and highly skilled analysts, with a strong
background both in security and in data analysis
techniques.
More research efforts are necessary to explore and
systematize findings and results obtained so far and to
develop a more general framework. In future work,
we plan to investigate these issues. In particular, we
intend to further elaborate on the observations made
in this work to devise general guidelines to apply data
science to behavior analysis for security, taking into
account a larger range of techniques. At the same
time, we plan to perform an extensive experimental
evaluation on both synthetic and real-world logs.
ACKNOWLEDGMENTS
This work is partially supported by ITEA3 through
the APPSTACLE project (15017) and by ECSEL
through the SECREDAS project.
REFERENCES
Accorsi, R., Stocker, T., and M
¨
uller, G. (2013). On the ex-
ploitation of process mining for security audits: the
process discovery case. In Proceedings of Annual
ACM Symposium on Applied Computing, pages 1462–
1468. ACM.
Adriansyah, A., van Dongen, B. F., and Zannone, N. (2013).
Controlling break-the-glass through alignment. In
Proceedings of International Conference on Social
Computing, pages 606–611. IEEE.
Alizadeh, M., Lu, X., Fahland, D., Zannone, N., and van
der Aalst, W. M. P. (2018a). Linking data and process
perspectives for conformance analysis. Computers &
Security, 73:172–193.
Alizadeh, M., Peters, S., Etalle, S., and Zannone, N.
(2018b). Behavior Analysis in the Medical Sector:
Theory and Practice. In Proceedings of ACM/SIGAPP
Symposium On Applied Computing. ACM.
Association of Certified Fraud Examiners (2018). Report
to the Nations: 2018 Global study on occupational
fraud and abuse. http://www.acfe.com/report-to-the-
nations/2018/. Accessed: 2018-06-01.
Bolton, R. J. and Hand, D. J. (2001). Unsupervised profiling
methods for fraud detection. In Proceedings of Credit
Scoring and Credit Control, pages 235–255.
BPI Challenge 2012 (2012). Event log of a loan application
process. http://dx.doi.org/10.4121/uuid:3926db30-
f712-4394-aebc-75976070e91f.
Cao, L. (2010). In-depth behavior understanding and use:
The behavior informatics approach. Information Sci-
ences, 180(17):3067 – 3085. Including Special Sec-
tion on Virtual Agent and Organization Modeling:
Theory and Applications.
Chandola, V., Banerjee, A., and Kumar, V. (2009).
Anomaly detection: A survey. ACM Computing Sur-
veys, 41(3):15.
Costante, E., Fauri, D., Etalle, S., den Hartog, J., and Zan-
none, N. (2016). A hybrid framework for data loss
prevention and detection. In Proceedings of IEEE Se-
curity and Privacy Workshops, pages 324–333. IEEE.
Etalle, S. (2017). From intrusion detection to software de-
sign. In Computer Security, pages 1–10. Springer.
Ferreira, D. R. and Gillblad, D. (2009). Discovering pro-
cess models from unlabelled event logs. In Business
Process Management, pages 143–158. Springer.
Genga, L., Alizadeh, M., Potena, D., Diamantini, C., and
Zannone, N. (2018). Discovering anomalous frequent
patterns from partially ordered event logs. Journal of
Intelligent Information Systems.
Hompes, B., Buijs, J., van der Aalst, W., Dixit, P., and Buur-
man, J. (2015). Discovering deviating cases and pro-
cess variants using trace clustering. In Proceedings of
Benelux Conference on Artificial Intelligence, pages
5–6.
Lee, W., Stolfo, S. J., et al. (1998). Data mining approaches
for intrusion detection. In Proceedings of USENIX
Security Symposium, pages 79–93.
Mann, H. B. and Whitney, D. R. (1947). On a Test of
Whether one of Two Random Variables is Stochas-
tically Larger than the Other. Ann. Math. Statist.,
18(1):50–60.
Patcha, A. and Park, J.-M. (2007). An overview of
anomaly detection techniques: Existing solutions
and latest technological trends. Computer networks,
51(12):3448–3470.
Qu, D., Vetter, B. M., Wang, F., Narayan, R., Wu, S. F.,
Hou, Y., Gong, F., and Sargor, C. (1998). Statistical
anomaly detection for link-state routing protocols. In
Proceedings of International Conference on Network
Protocols, pages 62–70. IEEE.
Richardson, R. (2008). CSI Computer Crime and Security
Survey.
Shon, T., Kim, Y., Lee, C., and Moon, J. (2005). A ma-
chine learning framework for network anomaly detec-
tion using SVM and GA. In Proceedings from Annual
BASS 2018 - International Workshop on Behavioral Analysis for System Security
468

IEEE SMC Information Assurance Workshop, pages
176–183.
Smaha, S. E. (1988). Haystack: An intrusion detection sys-
tem. In Proceedings of Aerospace Computer Security
Applications Conference, pages 37–44. IEEE.
Song, M., G
¨
unther, C. W., and van der Aalst, W. M. (2008).
Trace clustering in process mining. In Business Pro-
cess Management, pages 109–120. Springer.
van der Aalst, W. M. and de Medeiros, A. K. A. (2005). Pro-
cess mining and security: Detecting anomalous pro-
cess executions and checking process conformance.
Electronic Notes in Theoretical Computer Science,
121:3–21.
Vassiliadis, P. (2009). A survey of extract–transform–load
technology. International Journal of Data Warehous-
ing and Mining, 5(3):1–27.
Walicki, M. and Ferreira, D. R. (2011). Sequence parti-
tioning for process mining with unlabeled event logs.
Data & Knowledge Engineering, 70(10):821 – 841.
Ye, N. et al. (2000). A markov chain model of tempo-
ral behavior for anomaly detection. In Proceedings
of IEEE Systems, Man, and Cybernetics Information
Assurance and Security Workshop, volume 166, page
169.
Towards a Systematic Process-aware Behavioral Analysis for Security
469
