
Contributions to the Detection of Unreliable Twitter Accounts through
Analysis of Content and Behaviour
Nuno Guimar
˜
aes
1
,
´
Alvaro Figueira
1
and Lu
´
ıs Torgo
1,2
1
CRACS / INESCTEC & University of Porto, Rua do Campo Alegre 1021/1055, Porto, Portugal
2
Faculty of Computer Science, Dalhousie University, Halifax, Canada
Keywords:
Automatic Detection, Unreliable Twitter Accounts, Text Mining, Sentiment Analysis, Machine Learning.
Abstract:
Misinformation propagation on social media has been significantly growing, reaching a major exposition in
the 2016 United States Presidential Election. Since then, the scientific community and major tech companies
have been working on the problem to avoid the propagation of misinformation. For this matter, research has
been focused on three major sub-fields: the identification of fake news through the analysis of unreliable posts,
the propagation patterns of posts in social media, and the detection of bots and spammers. However, few works
have tried to identify the characteristics of a post that shares unreliable content and the associated behaviour
of its account. This work presents four main contributions for this problem. First, we provide a methodology
to build a large knowledge database with tweets who disseminate misinformation links. Then, we answer
research questions on the data with the goal of bridging these problems to similar problem explored in the
literature. Next, we focus on accounts which are constantly propagating misinformation links. Finally, based
on the analysis conducted, we develop a model to detect social media accounts that spread unreliable content.
Using Decision Trees, we achieved 96% in the F1-score metric, which provides reliability on our approach.
1 INTRODUCTION
The exponential growth of users in social networks
such as Twitter and Facebook has contributed to their
ascent as the number one medium for information dis-
tribution and propagation. A recent study has shown
that, in 2017, 67% of adults consume some type of
news in social media, with 20% of the respondents
recurring often to social media for news consumption
(Gottfried and Shearer, 2017).
The ease of sharing content via social networks
combined with malicious users’ intents, created con-
ditions for the spread of misreported information and
rumours. However, it was not until 2016, during
the United States Presidential Elections that the term
”fake news” became trending and a recurrent topic. In
addition, it had provided a huge impact on the cam-
paign, with several social media accounts delibera-
tely disseminating false information via original posts
or by sharing links to false news sites (Lazer et al.,
2018).
Due to the major impact that fake news had, high
reputation companies such as Google and Facebook
started working to tackle the problem (Hern, 2017;
Hern, 2018). The scientific community has also been
active on the topic. As a matter of fact, Figure 1 shows
the number of hits per year in Google Scholar regar-
ding the term ”fake news” where we can observe a
constant growth on the number of publications on the
topic (there is a slight decay in 2018 but this is pro-
bably due to a large number of works that are still
being published). Particularly, in 2017, there was an
increase of approximately 7000 publications in com-
parison with the previous year.
Figure 1: Number of hits per year in Google Scholar for the
term ”fake news”.
Although ”fake news” has become a familiar term
after the 2016 elections and is normally associated
with political news, there are other domains of mis-
information that affect social media. Misinformation
92
Guimarães, N., Figueira, Á. and Torgo, L.
Contributions to the Detection of Unreliable Twitter Accounts through Analysis of Content and Behaviour.
DOI: 10.5220/0006932800920101
In Proceedings of the 10th International Joint Conference on Knowledge Discovery, Knowledge Engineering and Knowledge Management (IC3K 2018) - Volume 1: KDIR, pages 92-101
ISBN: 978-989-758-330-8
Copyright © 2018 by SCITEPRESS – Science and Technology Publications, Lda. All rights reserved

on health conditions or miraculous cures is also a con-
cerning problem, since this type of content is shared
more extensively than reliable information (Forster,
2018). Another example is extreme bias content
which relies on out of context information or opi-
nions distorted as facts (OpenSources, 2018). All
these types of content are disseminated through so-
cial networks, influencing users beliefs and their per-
ception of the truth. Therefore, not only is impor-
tant to determine which content is false but also what
accounts/sources to trust on social networks with re-
spect to the large set of misinformation that exists.
In the next section, we cover the related work on
fake news and misinformation. In Section 3, we pre-
sent the methodology to extract unreliable posts. In
Section 4 we perform an analysis on the content of
unreliable posts and users that propagate them. Then,
we create and evaluate a model to detect unreliable
accounts, and finally, we draw some conclusions and
provide some hypothesis for future work.
2 RELATED WORK
We divided the literature review into three subgroups:
misinformation propagation, detection of fake content
and spam/bot accounts detection.
2.1 Misinformation Propagation
We start by analyzing Shao’s paper that describes a
platform to track online misinformation (Shao et al.,
2016). In this paper, the authors crawl posts from so-
cial networks that contained links from fake content
and fact-checking websites. Then, they proceeded to
an analysis of the popularity and activity of users that
spread these URLs. One of the preliminary results
achieved is that users who disseminate fake news are
much more active and committed than the ones that
spread the articles to refute them. In other words,
there is a small set of top fake news accounts that ge-
nerate a large number of tweets regarding the topic,
while in the case of fact-checking it is more distri-
buted across the network. This work presents some
similarities with our approach. However, our goal is
to detect unreliable accounts and not to analyse fact-
checkers and users who disseminate fake news.
Another work, which presents an approach on
the network propagation of fake news, is described
in (Tambuscio et al., 2015) where the interplay bet-
ween believers of fake news and fact-checkers is ana-
lyzed. The presented model can be seen as a set
of states and transitions similar to the spreading of
a disease, where hoaxes (or fake news) are virus.
The same model characterizes the users dissemina-
ting fake news as the infected patients, although they
can ”recover” when confronted with a fact-checking
action. The main difference between the proposed
approach and traditional SIS (Susceptible-Infected-
Susceptible) and SIR (Susceptible-Infected-Recover)
models is the existence of two sub-states in infected
nodes: believers (the users that believe the hoax) and
fact-checkers (the users who debunk the hoax). The
authors test their approach in 3 different scenarios: a
random network, a scale-free network, and a real so-
cial network (using Facebook). According to the aut-
hors, one of the main results of this work is that a
minor activity regarding fact-checking can cancel a
hoax, even when users believe it with a high probabi-
lity.
2.2 Detection of Fake Content
In the study by Antoniadis (Antoniadis et al., 2015)
the authors try to identify misinformation on Twitter
during an event (hurricane Sandy). For that purpose,
they labelled a set of tweets into credible and mis-
information. Next, features were extracted from text
and social feedback. The best result was achieved (F-
measure = 78%) using a Bootstrap Aggregating Met-
hod. Two experiments are described in this paper. In
the first, social feedback features (number of retweets,
number of favourites...) were included. In the second,
by removing these features, the results decay approx-
imately 3%. The authors claim that the method is still
efficient in real time.
In the work of Tacchini et al.(Tacchini et al., 2017)
the authors state that ”users who liked a post” is a fe-
ature of major importance for fake content detection
and test their approach in two different models: Lo-
gistic Regression and an adaptation of a Boolean La-
bel Crowdsourcing (BLC) algorithm to work with a
training set. Using a small set of posts (15) for the
training set, the authors achieved an accuracy near
80%. In addition, even with users liking fake (hoax)
and true posts, the accuracy achieved can be higher
than 90% using only 10% of the dataset for training.
2.3 Spammers/Bots Accounts Detection
The majority of works conducted have tried to detect
spammers or bots in Twitter. The study in (Beneve-
nuto et al., 2010) presents a model to detect spammers
in Twitter. The authors relied on manual annotation
to build a dataset of approximately 1000 entries of
spammer and non-spammer users. Then, they deve-
loped attributes regarding content and user behaviour.
The model built achieved 70% accuracy in detecting
Contributions to the Detection of Unreliable Twitter Accounts through Analysis of Content and Behaviour
93

spammers and 96% in detecting non-spammers. Alt-
hough a similar approach, spammers are more easily
determined than unreliable accounts. According to
the authors ”Tweet spammers are driven by several
goals, such as to spread advertise to generate sales,
disseminate pornography, viruses, phishing, or sim-
ply just to compromise system reputation”. There-
fore, spammer accounts represent a subgroup of all
unreliable accounts that we are trying to detect.
A similar work (Castillo et al., 2011) provides a
model to detect credibility in Twitter events. The
authors start by building and annotating a dataset of
tweets (via Crowd-sourcing) regarding specific tren-
ding topics. Then, they use 4 different sets of features
(Message, User, Topic, and Propagation) and a De-
cision Tree model to achieve an accuracy of 86% in
a balanced dataset. Despite the fact this paper has
tackled a different problem, some features presented
may also have an impact on the detection of unreliable
accounts.
Other works have also analyzed and tried to detect
bot accounts. For example, the work in (Chu et al.,
2012) presents an analysis of three different type of
accounts: humans, bots, and cyborgs. The authors
built a balanced dataset of 6000 users manually an-
notated. Next, they created a system for user classi-
fication with 4 different components (entropy measu-
res, spam detection, account properties, and decision
maker). This system achieves an average accuracy
of 96% with the ”Human” class being the more cor-
rectly classified. In another work, (Dickerson et al.,
2014) the authors present a framework to distinguish
between human and bot accounts. In addition, the pa-
per highlights the importance of sentiment features in
such task.
Although the presented studies provide accurate
systems to distinguish human accounts from bots and
spammers, unreliable accounts are not guaranteed to
be composed, in totality, of these two classes. In fact,
human accounts may also spread unreliable posts due
to their strong political beliefs or incapacity to dis-
tinguish reliable and unreliable content since that, on
average, 50% of users who have seen a piece of fake
content, prior to the U.S. 2016 election, believed it
(Allcott and Gentzkow, 2017).
3 METHODOLOGY
In literature, misinformation, fake news, and rumours
have being defined differently. Our main goal in this
work is to explore characteristics that are common to
unreliable content in general. We define unreliable
content more loosely than the current literature, which
focuses on more specific problems such as fake news
or clickbait. In this work we consider content to be
unreliable if, given a tweet with an external URL, one
of the following statements is true:
• the content provided in the URL is verifiable to be
false
• the content provided in the URL represents clear
favouritism on one side of the political spectrum
and/or disrespects the other using hate language
• the content provided in the URL is intended to ge-
nerate web traffic to profit from advertising. For
example, having an interesting but misleading he-
adline or social media thumbnail.
With the goal of collecting a large number of
tweets that propagate links from web pages that are
known to publish unreliable content, we used Open-
Sources (OpenSources, 2018). OpenSources is a
resource for assessing online information sources.
Users can submit suggestions of websites to be inser-
ted. However, submissions are carefully revised by
the project researchers before inclusion. The classifi-
cation for each site ranges from credible news sour-
ces to misleading and outright fake websites. For
this study, we are interested in sites that are label-
led as ”bias”,”fake”,”fake news”, ”hate”,”junksci”
1
,
”rumour”,”conspiracy”,”clickbait”, and ”unreliable”.
Table 1 presents the number of websites distributed by
category at the time of the analysis (November 2017).
Table 1: Distribution of websites per dubious class.
Classification Number of websites
Bias 133
Hate 29
JunkSci 32
Fake 236
Fake News 1
Clickbait 32
Unreliable 56
Total 522
For each web page on the previously mentioned
categories, we used the URL as a query in the Twit-
ter Search API. Consequently, the tweets returned in-
clude the URL (or sub-domains/pages) queried. For
each URL, a maximum number of 100 tweets were
extracted. This limit was established considering the
API rate limit and the number of websites in Open-
Sources. However, in some websites, we have obser-
ved that this limit was not reached.
The extraction procedure is executed daily and the
information retrieved is stored in a non-relational da-
tabase built for the effect. All the information provi-
1
”junksci” is an acronym for junk science
KDIR 2018 - 10th International Conference on Knowledge Discovery and Information Retrieval
94

ded by the Search API is stored. In addition, senti-
ment analysis and named entity recognition (NER) is
computed in each tweet. For sentiment analysis, we
use Vader (Hutto and Gilbert, 2014) rule-based appro-
ach to determine the negative and positive sentiment
values for each tweet. Regarding the NER compo-
nent, we used NLTK (Loper and Bird, 2002) to detect
3 types of entities: location, organization, and per-
sons.
In order to understand and identify common pro-
perties on tweets propagating unreliable content, an
analysis on the retrieved data was conducted and is
presented in the following section.
4 EXPLORATORY ANALYSIS
4.1 Content Analysis
In this analysis, we established a time window of ap-
proximately two months with tweets ranging from
March, 15 to May, 4 of 2018. The total number of
tweets retrieved in this period of time was 499530.
Regarding the data characteristics, we formulate three
research questions (RQ) that are important in order to
establish useful indicators on unreliable tweets, with
the ultimate goal of better detecting unreliable ac-
counts.
• RQ 1: Do Unreliable Tweets Follow Traditio-
nal Media Outlets in Terms of the Entities that
they Mention? The authors in (Vargo et al., 2017)
have concluded that traditional online media out-
lets appear to be responsible for fake news agenda
since the content of traditional media news make
users more attentive to all content regarding that
subject online. With this RQ we want to analyze
if that is also the case on tweets. In addition, we
also inspect the frequency of entities per post on
both unreliable and traditional news media outlet
tweets.
• RQ 2: Which Hashtags are Used to Engage
with Users? Hashtags are commonly used by
users to aggregate tweets regarding the same to-
pic. We study which are the commonly used
hashtags on unreliable tweets and how they differ
from traditional news media.
• RQ 3: Does the Sentiment Differ between
Unreliable Tweets and Tweets from Reputed
Sources? One important factor suggested by the
authors in (dos Reis et al., 2015) is that a news
headline is more attractive if its sentiment is ex-
treme. The same analysis was later conducted
with ”fake news” (Souppouris, 2016) with the
conclusion that this type of content presents more
negative sentiment than mainstream news outlets.
Therefore, it is important to analyze if such beha-
viour is also noticed in unreliable tweets.
In addition, we also formulate an extra question
regarding characteristics of unreliable accounts:
• RQ 4: Can we Trust Verified Accounts? Twit-
ter has signalled with verified badges that a cer-
tain account of public interest is authentic. (Help,
2018). However, this does not directly imply that
we can trust the content posted. In fact, there have
been cases of verified accounts that propagated
misinformation (Weisman, 2018). Therefore, it is
important to analyze the percentage of verified ac-
counts that spread unreliable news content, since
they are likely to have more engagement and ret-
weets.
Regarding RQ 1 we compare the most mentioned
entities in dubious tweets and in posts from traditio-
nal news media outlets. Consequently, we extract a
dataset of tweets from the same interval used in unre-
liable tweets. We started by manually selecting a set
of mainstream news outlets. We restrained our rese-
arch to those who write in the English language and
whose impact and popularity are relevant in the Uni-
ted States and the United Kingdom (since they are two
of the most influential countries in the world (Haynie,
2015)). Therefore, we weighed on the number of fol-
lowers of news accounts as well as how trustworthy
they are for the general audience in the US (Nichols,
2016) and UK (BBC, 2015). The news media outlets
selected are presented in Table 2:
Table 2: Selected News Media Outlets.
The Guardian CNN BBC
The Economist Wall Street Journal ABC
CBS News Washington Post NBC News
Reuters Sky News Fox News
Next, we extracted the top 50 entities for each
category (persons, locations and organizations) for
each dataset (reliable and unreliable tweets). The re-
sults achieved show that 36% of locations and persons
identified and 42% of the organizations are the same
in both datasets. This means that not only there are
a lot of similar entities but also that these occur fre-
quently on both datasets (since we are restraining our
analysis to the top 50 entities of each category). In
addition, on average, the number of entities of unreli-
able tweets is far superior than on news media outlets
accounts. Table 3 illustrates the average entities per
tweet on both datasets.
Therefore, the constant presence of entities in
tweets must provide useful information regarding its
Contributions to the Detection of Unreliable Twitter Accounts through Analysis of Content and Behaviour
95
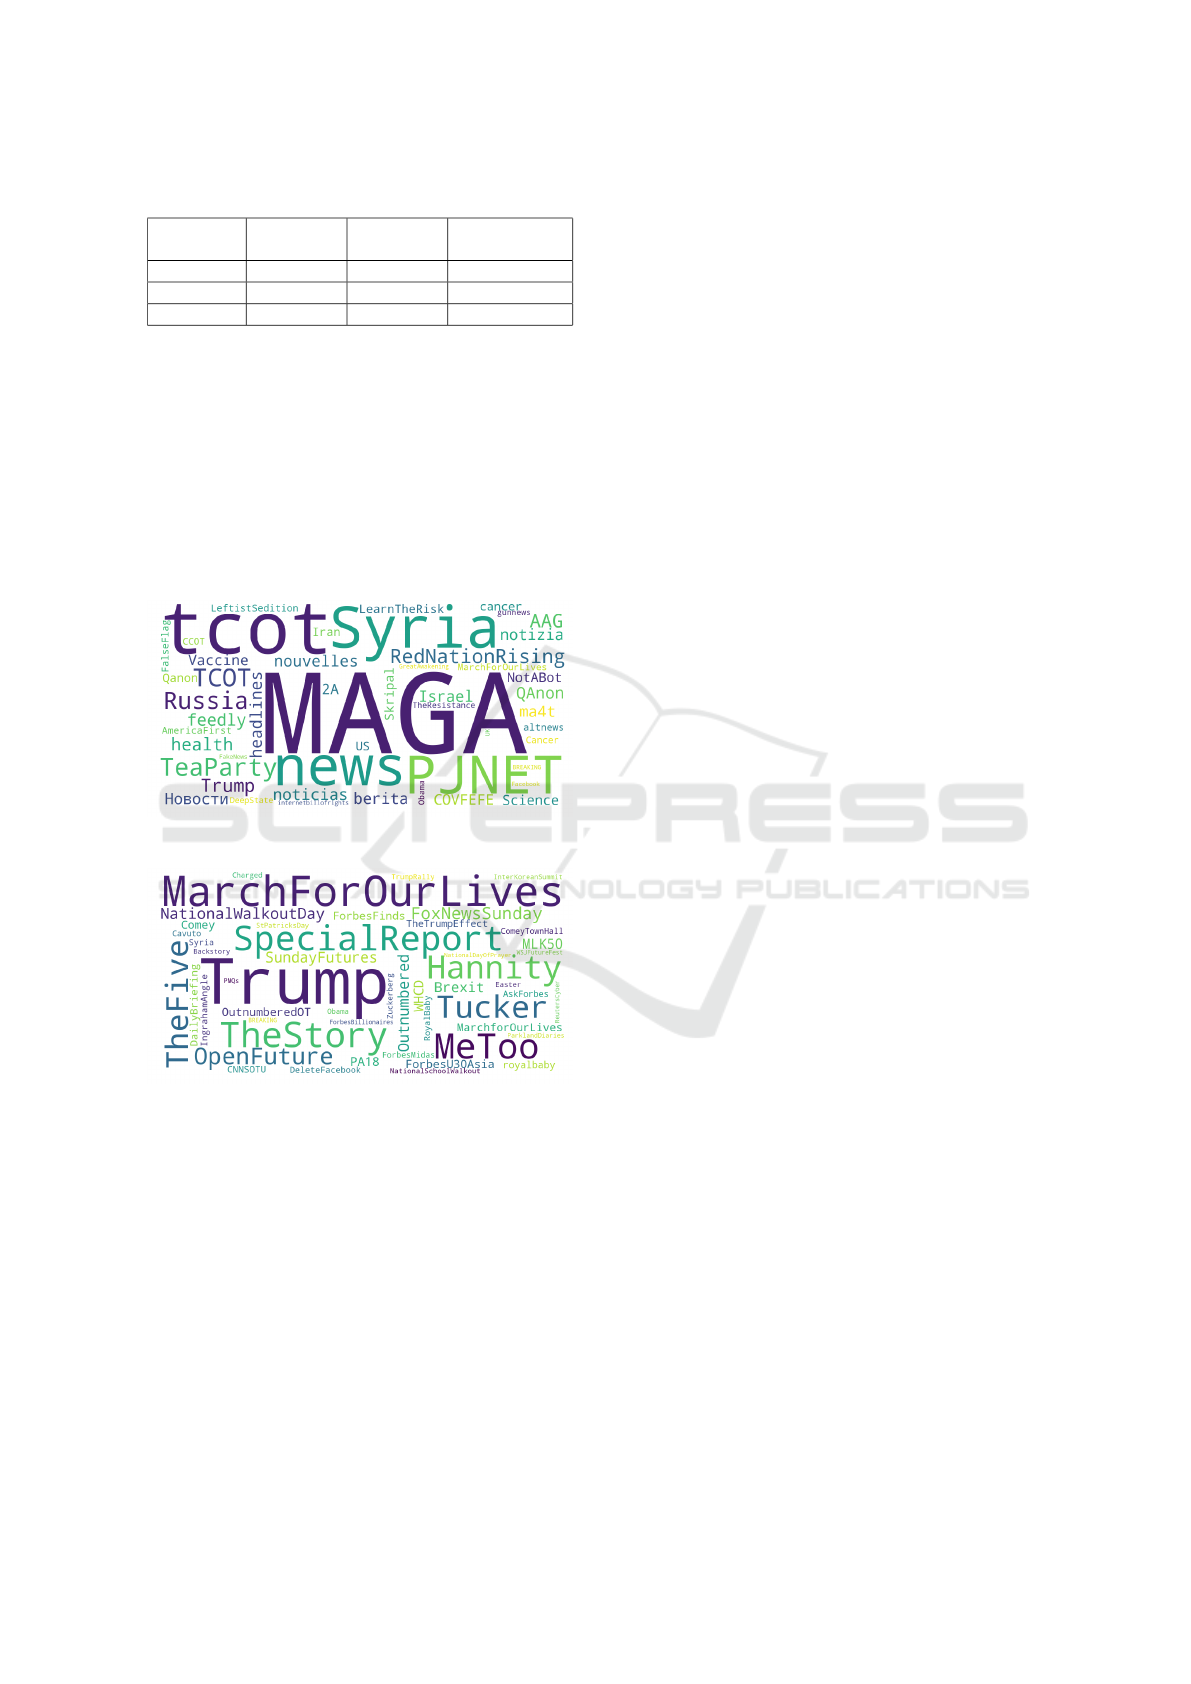
Table 3: Entities per tweet on unreliable and reliable data.
Entities
Locations
(per tweet)
Persons
(per tweet)
Organizations
(per tweet)
Unreliable 0.007 0.90 1.20
Reliable 0.002 0.16 0.60
Difference + 0.005 + 0.74 + 0.6
reliability. However, it is also important to point out
some limitations of these results. First, current state
of the art systems have some difficulty to detect enti-
ties on short text and even more when they do not fol-
low common syntax rules (such as the case of tweets).
Therefore, although tweets from credible sources tend
to be syntactically well written, tweets from common
users are more free-form. Consequently, the detection
of entities can result in a low accuracy when compa-
red to larger text corpus.
(a) Hashtag wordcloud from unreliable tweets
(b) Hashtag wordcloud from news media outlet tweets
Figure 2: Hashtag Wordcloud for reliable and unreliable
tweets.
Regarding RQ2 we inspected the 50 most used
hashtags for each dataset (news media outlet tweets
and unreliable tweets). Figure 2 represents each data-
set wordcloud where the font size corresponds to the
number of occurrences of the hashtag in the data (the
larger the font, the larger the number of occurrences).
Some interesting information is provided. First, in
unreliable tweets, the majority of words can be as-
sociated with the political domain. Some examples
include MAGA (acronym for the slogan ”Make Ame-
rica Great Again”), TeaParty and Trump. Another
interesting word is PJNET which stands for Patriot
Journalist Network, Twitter group which was respon-
sible for coordinating tweets and propagating false in-
formation through the network (Klein, 2017). There
is also the mention of other Twitter groups such as
TCOT and Red Nation Rising. In addition (and as ex-
pected) some hashtags refer to some topics that were
trending in the news such as Trump, Syria, Skripal,
Israel and Russia. Therefore, we can conclude that
there is a mixture of hashtags regarding relevant to-
pics, with Twitter-specific groups and propaganda.
We can hypothesize that, in one hand, these hashtags
lead to user engagement by using interesting and re-
levant topics and in other hand, try to associate the
content with a specific group or page in an attempt to
achieve a larger audience for those specific accounts.
The hashtag wordcloud for the news media outlet
accounts has more emphasis on words corresponding
to entities (such as Trump, Hannity, Syria and Co-
mey) and topics associated with events or movements
(MeToo, MarchForOurLives, NationalWalkoutDay).
However, there is also the presence of self-reference
hashtags (i.e. that promote the news media outlet
where the tweets were extracted). For example CNN-
SOTU (a news program from CNN), TheFive, and
The Story (both FoxNews shows). Hence, and similar
to the unreliable tweets wordcloud, there is a mixture
of news events related hashtags and self-promotion
for news media outlets accounts.
However, when comparing the frequency of
hashtags per post, they largely differ. The average
hashtag per tweet is 0.05 for the traditional news
media outlets. This means that this type of tweets
does not often contain hashtags. In another hand,
the average hashtag per tweet in unreliable posts is
0.42 which means that, on average, there is a hashtag
for every two tweets. This difference can provide ef-
fective indicators on the task of identifying unreliable
accounts.
To answer RQ3 once again we reuse the credible
tweet news sources dataset used for RQ1 and RQ2.
Figure 3 presents the average sentiment strength
of tweets by day on both reliable and unreliable sour-
ces. It is clear that negative sentiment is predominant
across all the interval of time studied. Positive sen-
timent varies between 0.06 and 0.085, whether nega-
tive sentiment has its lowest value at approximately
0.105. In addition, the negative sentiment is stron-
ger on unreliable tweets than on tweets from reliable
sources. This pattern is observable across the majo-
rity of the days from the selected time period. Hence,
sentiment analysis provides clear indicators that the
text of tweets that share unreliable links follow the
same principle for appealing users. Furthermore, in
agreement with what was concluded in (Souppouris,
KDIR 2018 - 10th International Conference on Knowledge Discovery and Information Retrieval
96
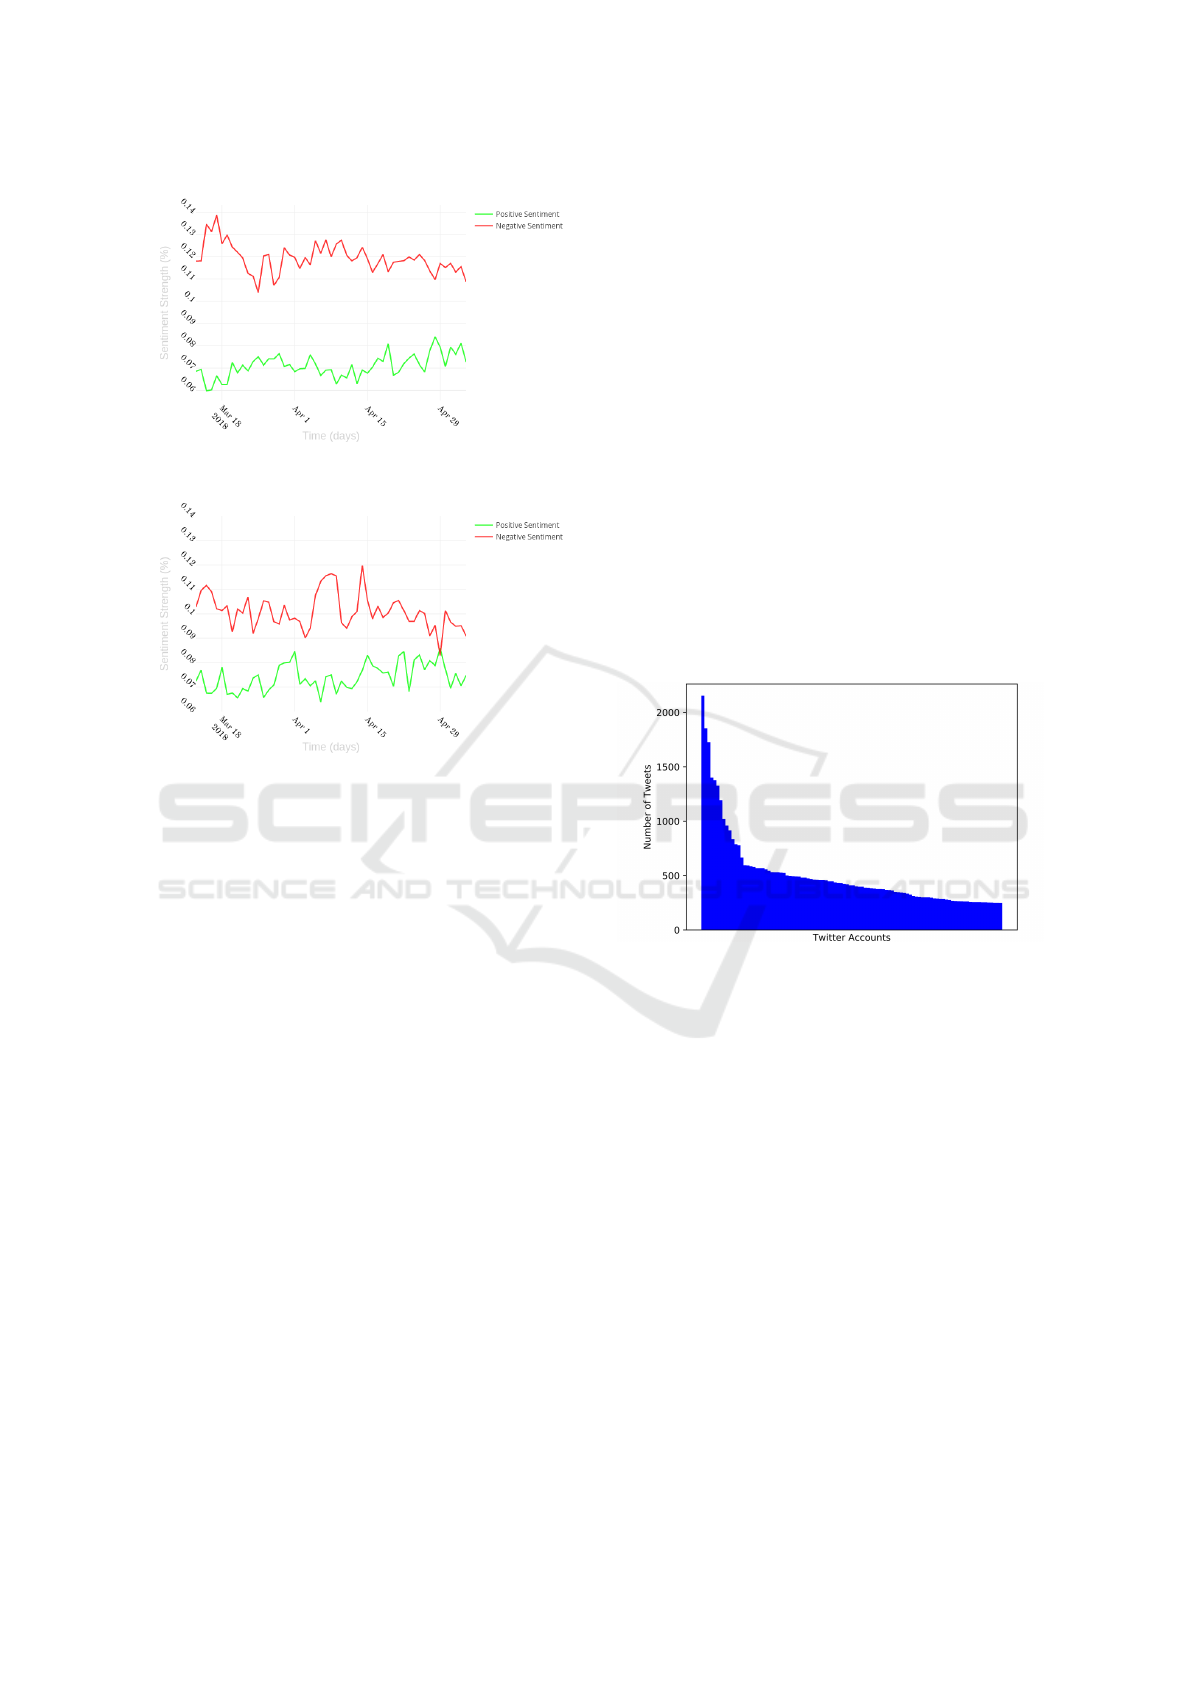
(a) Sentiment on unreliable tweets 1
(b) Sentiment on reliable tweets
Figure 3: Comparison of sentiment through time in reliable
and unreliable tweets.
2016), the negative sentiment seems to have a small
decay with time. This provides some enlightenment
on the behaviour of this content. However, further
analysis must be conducted to gain some confidence
in these results.
Finally, RQ 4 refers to the verification of ac-
counts. More specifically to understand the ratio of
verified accounts that spread misinformation (i.e. are
unreliable). In order to do it, we sampled 72000 user
accounts from the dataset and extract their verified
status. The number of accounts that had tweeted un-
reliable links in this sample is 407 (0.6%) which is
a significantly low percentage. This provides impor-
tant insight that verified accounts are much less likely
to diffuse unreliable information. Nevertheless, it is
important to highlight that these type of accounts also
represent a small percentage of all Twitter users, since
only 226K of 330 million users (Statista, 2018) are
verified (according to the official ”Verified” account
which follows all verified users (Twitter, 2018b)).
4.2 Unreliable Users Analysis
Not only is important to have an overview analysis
of tweets that propagate dubious content, but also to
make an in-depth analysis of accounts that more fre-
quently propagate it. Thus, and considering the pre-
viously mentioned interval of time, we plot the num-
ber of tweets that propagate dubious content per ac-
count. However, to avoid a very long tail plot, we
only included accounts that posted more than 200 du-
bious tweets. Figure 4 presents the accounts ordered
by number of tweets. There is some important in-
formation to retain from this analysis. First, in the
course of 50 days, there are accounts who have pos-
ted more than 1500 tweets with dubious websites that
were captured by our extraction methodology. It is
important to emphasize that this number can be hig-
her since the Twitter Search API only captures a small
percentage of the total number of tweets matching the
query parameters (Twitter, 2018a). This means that,
on average, there are accounts that post over 30 tweets
a day containing dubious links. In addition, there are
28 accounts that tweeted more than 500 times with
the most frequent account to post a total of (at least)
2154 tweets.
Figure 4: Number of dubious tweets per account.
To make a more detailed study of the users that are
continuously propagating dubious content, we pro-
ceed to extract the last tweets for each one of the ten
more frequent accounts. Consequently, for each user,
we extracted the more recent tweets from their time-
line. For each account, at least 3200 tweets were re-
trieved (the maximum allowed by the API). However,
before the extraction procedure began, one user ac-
count has been suspended, which restrain our analysis
to 9 users.
First, we conducted an analysis of the post fre-
quency of the top users to understand if there is a
common pattern. Figure 5 presents the ”tweeting”
distribution of the last 3200 tweets for each account
per day. In other words, for a day x we divide the
total number of posts for each accounts by the total
number of posts for that day.
The main conclusion is that post frequency is not
similar in these accounts. For example, account 7 pos-
ted the last 3200 tweets at a low rate across 5 months.
Contributions to the Detection of Unreliable Twitter Accounts through Analysis of Content and Behaviour
97

This is illustrated by the 100% presence on the most
distant dates. In another hand, the 3241 more recent
tweets from account 3 were posted in a 2 day period
(consequently, it appears with a large distribution at
the end of the plot) . Thus, pattern frequency in the
latest posts is on both ends with accounts presenting
a constant number of posts per day and others pre-
senting a difference of approximately 500 tweets be-
tween two days (account 3). In addition, through a
more detail analysis, we conclude that account 4,5,
and 7 are with a great probability associated with
websites used for the extraction methodology since
they share very similar names.
The second analysis refers to the extended net-
work of mentions in each tweet. Analyzing each men-
tioned user (on the latest tweets for the top accounts)
we can figure out if they had already spread dubious
content (by performing a query in our database). Un-
like the current state of the art, the goal is not to study
the neighbour accounts by the following/follow me-
tric but according to the number of ”mentions” of un-
reliable accounts. Figure 6 illustrates the connection
between top users and other users through tweet men-
tions. Duplicate mentions are removed. The nodes
represented in blue are the top users (2 users did not
have any mention to other users on their tweets). No-
des in orange are the accounts which no information
was present in the database and whose accounts are
not verified. Nodes in red are users that have already
post dubious links where the larger the node, the more
dubious tweets were found on the database. The veri-
fied accounts were excluded since they are not likely
to disseminate dubious content (as it was analyzed in
RQ4).
Figure 5: Last tweets of the most frequent accounts.
Two of the accounts mention a slightly larger
number of unknown users while the others mention,
in their majority, users already flagged in our data-
base. The number of mentions also differs signifi-
cantly. In the last 3200 tweets, some top users had
over 200 mentions while other only 2. Curiously, the
accounts that are associated with websites from Open-
Sources also behave differently since one of the ac-
counts does not have user mentions in the latest tweets
while the other is the one that has the most. However,
almost all nodes (except one which only mentions two
users) are linked to dubious users.
Figure 6: Graph representing mentions from top accounts.
5 MODEL CREATION
There are two components which play an important
role in building a high accuracy model in machine le-
arning: the learning data (i.e. ground-truth) and featu-
res extracted from it. Regarding the assessment of es-
tablishing a ground truth and build a scalable dataset
without human annotation, we consider the top 200
accounts who spread unreliable links from our data-
base. It is important to mention that we are no longer
restricted to the subset used for data analysis but to
all the database (from 22 February 2018 to 18 of May
2018). Regarding the reliable class and considering
the negligible percentage of verified accounts that was
captured in our analysis (RQ 4), we can assume with
a certain degree of confidence that these accounts are
reliable. In addition, since our main goal is to detect
reliable and unreliable accounts, only using news me-
dia outlet accounts (like the ones in Section 4) would
probably skew the learning step of our models. Thus,
we argue that verified accounts capture a larger set of
different accounts, ranging from celebrities, compa-
nies to news media outlets. Consequently, this would
allow the model to better discriminate unreliable ac-
counts from all others.
Therefore, we extract 200 verified accounts rand-
omly selected from the Twitter Verified account
(Twitter, 2018b).
With respect to the features, there were some con-
straints due to the limitations of our dataset. First,
since the goal of our model is not being able to distin-
guish between unreliable and verified accounts, this
type of meta-data can’t be used. In addition, the
number of followers and following is also an impor-
tant discriminating characteristic between verified ac-
counts and others since verified accounts are normally
accounts of public interest (Help, 2018). Hence, we
focus on determining posting patterns and the charac-
KDIR 2018 - 10th International Conference on Knowledge Discovery and Information Retrieval
98

teristics of the content of the posts where verified ac-
counts behaviour is more likely to the common user.
The set of features extracted were:
• Posting Patterns: we extracted features based on
the frequency of tweets posted by day. Due to
the analysis conducted, unreliable accounts post
in a higher frequency and unusual patterns, while
the majority of users ”tweet” less than one time
a day (Sysmonos, 2009). Thus we computed the
average and standard deviation of posts by day for
each user.
• Sentiment Patterns: The difference of sentiment
between unreliable and news media accounts (stu-
died in the previous section) is the basis for these
features. In addition, sentiment features have also
provided significant importance in related tasks
(Dickerson et al., 2014). Therefore, we extracted
the average positive and negative sentiment for the
tweets of each account using Vader sentiment sy-
stem (Hutto and Gilbert, 2014).
• Hashtags and Mentions Patterns: The number
of hashtags and mentions have already been poin-
ted out as a differentiating factor from normal
user accounts and spammers (McCord and Chuah,
2011; Benevenuto et al., 2010). Accordingly, we
complemented our feature set with this indicator
since spammers are a subgroup and fit our defini-
tion of unreliable accounts. We also do not diffe-
rentiate mentions that have been verified and that
are present in our database (unreliable) since we
are using this principle to determine our ground-
truth. For this reason, the inclusion of such featu-
res would skew our analysis.
• Entities Pattern: It is our assumption that entities
are an important factor for building a model capa-
ble of detecting unreliable accounts, since a large
portion of posts on social media are regarding ir-
relevant information and chat between users (Fi-
gueira et al., 2016; Castillo et al., 2011). In addi-
tion, the analysis conducted in RQ1 provided evi-
dence on the different number of entities in tradi-
tional news outlets and unreliable tweets. Conse-
quently, the frequency of the different type of en-
tities may present decisive indicators for differen-
tiating unreliable accounts from all others. Thus,
we built 3 numeric features regarding the average
of entities detected by tweet in 3 different catego-
ries: persons, locations and organizations.
To extract the set of features we repeated the pro-
cess from Section 4.2 and extract the most recent
tweets for each account of our dataset.
5.1 Evaluation
We split our data into train and test sets in an 80% and
20% ratio, respectively. We used three machine lear-
ning algorithms to perform our experimental evalua-
tion: Decision Trees (J48), Naive-Bayes and Support
Vector Machines (SVM). Decision Trees used a confi-
dence factor of 25%. The kernel chosen for the SVM
was a radial basis function (RBF) with a gamma value
of 0.083 and a cost of 1.0. The tests were conducted
using WEKA (Hall et al., 2009). Regarding the evalu-
ation metrics, we focused on the weighted precision,
recall, and F1-measure. The results are presented in
Table 4
Table 4: Performance of the models evaluated.
Model Precision (%) Recall (%) F1-Measure (%)
Naive Bayes 91.2 91.1 91.1
Decision Tree 96.2 96.2 96.2
SVM 93.5 92.4 92.4
The results achieved in the evaluation procedure
provide some reliability on our approach to the pro-
blem. Decision trees accomplish the best result
(96.2% in F1-measure) while Naive Bayes has the lo-
west performance of the three models tested. When
analyzing the performance on individual classes, De-
cision Trees maintain the highest F1-measure score
(96.4 % in the reliable accounts class and 96.0% in
the unreliable).
There are some limitations that must be mentio-
ned. First, the automatic annotation may not repre-
sent the totality of Twitter users. However, due to
the analysis conducted in Section 4 and the informa-
tion provided in (Help, 2018), this type of accounts
seems like a good ground-truth data for users that do
not spread unreliable content and has the advantage
of scaling the dataset without human intervention. In
addition, the manual annotation of Twitter accounts
would be an exhaustive and enduring task, since an-
notators would have to analyze content post by post
and verify its veracity. Second, the size of the dataset
is also not ideal. However, we wanted in a first stage
to capture characteristics of accounts which are fre-
quently spreading unreliable content. Therefore, we
strict our number of accounts to the top 200 of our
database, since we do not want to capture accounts
which spread dubious links in a very small quantity.
Nonetheless, since our methodology is constantly up-
dating and populating our database, the number of
users with significantly large tweets will increase and
in future work we explore how a large number of en-
tries influence these results.
Contributions to the Detection of Unreliable Twitter Accounts through Analysis of Content and Behaviour
99

6 CONCLUSION AND FUTURE
WORK
In this work, we tackled the problem of detecting
unreliable accounts in Twitter. In order to do it,
we designed an extraction methodology that retrieved
tweets in large quantities based on OpenSources.
With the data retrieved, we performed a content
and behaviour analysis to understand characteristics
of tweets and accounts that spread unreliable informa-
tion. The main findings are 1) the different strength
in negative sentiment and the contrasting inclusion of
hashtags and entities in unreliable and reliable posts
2) the negligible number of verified accounts that are
spreading unreliable tweets and 3) high variations on
the number of posts per day in unreliable accounts.
Based on the analysis, we built a small dataset
to determine the effectiveness of a supervised model
to detect unreliable accounts. However, since we do
not want to differentiate traditional news media out-
let accounts from unreliable ones, we used verified
accounts as our ground truth for the ”reliable” class
since 1) the large majority does not include unreliable
content and 2) they capture a larger set of different
accounts (for example celebrities, politicians, compa-
nies and news outlets).
Combining the data with some features derived
from the analysis and related literature, we built three
different models. The performance obtained is above
90 % on all metrics considered, with Decision Trees
achieving the best results. This provides some confi-
dence on the method proposed and that unreliable ac-
counts can be distinguished based on the pattern and
content published.
However, there are still some limitations in the
current study that we propose for future work. First,
extend our list of features (with the remaining data
from Section 4), without skewing the model. We in-
tend to use Crowdsourcing platforms to facilitate the
task of building a human-annotated dataset. Then,
with a significantly larger dataset of reliable and un-
reliable accounts, we can use features such as the ve-
rified status and number of followers/following.
With a new dataset, we can also include features
derived from our database without incurring into buil-
ding a skewed model. For example, if the account had
tweets with unreliable content captured by our metho-
dology. In addition, we also wish to analyze how the
performance varies over time. I.e., to evaluate if the
used features become more important as the size of
the database grows.
ACKNOWLEDGEMENTS
Nuno Guimar
˜
aes thanks the Fundac¸
˜
ao para a Ci
ˆ
encia
e Tecnologia (FCT), Portugal for the Ph.D. Grant
(SFRH/BD/129708/2017). This work is partially
funded by the ERDF through the COMPETE 2020
Programme within project POCI-01-0145-FEDER-
006961, and by National Funds through the FCT as
part of project UID/EEA/50014/2013.
REFERENCES
Allcott, H. and Gentzkow, M. (2017). Social media and
fake news in the 2016 election. Working Paper 23089,
National Bureau of Economic Research.
Antoniadis, S., Litou, I., and Kalogeraki, V. (2015). A Mo-
del for Identifying Misinformation in Online Social
Networks. In Proceedings of the Confederated Inter-
national Conferences: CoopIS, ODBASE, and C&TC
2015, Rhodes, Greece, October 26-30, 2015., volume
9415, pages 473–482.
BBC (2015). Public perceptions of the impartiality and trus-
tworthiness of the bbc. Acessed: 2017-05-31.
Benevenuto, F., Magno, G., Rodrigues, T., and Almeida, V.
(2010). Detecting spammers on twitter. Collabora-
tion, electronic messaging, anti-abuse and spam con-
ference (CEAS), 6:12.
Castillo, C., Mendoza, M., and Poblete, B. (2011). Infor-
mation Credibility on Twitter. In Proceedings of the
20th international conference on World wide web.
Chu, Z., Gianvecchio, S., Wang, H., and Jajodia, S. (2012).
Detecting automation of Twitter accounts: Are you a
human, bot, or cyborg? IEEE Transactions on Depen-
dable and Secure Computing, 9(6):811–824.
Dickerson, J. P., Kagan, V., and Subrahmanian, V. S. (2014).
Using sentiment to detect bots on Twitter: Are humans
more opinionated than bots? In ASONAM 2014 - Pro-
ceedings of the 2014 IEEE/ACM International Confe-
rence on Advances in Social Networks Analysis and
Mining, pages 620–627.
dos Reis, J. C., Benevenuto, F., de Melo, P. O. S. V., Prates,
R. O., Kwak, H., and An, J. (2015). Breaking the
news: First impressions matter on online news. CoRR,
abs/1503.07921.
Figueira, A., Sandim, M., and Fortuna, P. (2016). An
Approach to Relevancy Detection: Contributions to
the Automatic Detection of Relevance in Social Net-
works, pages 89–99. Springer International Publis-
hing, Cham.
Forster, K. (2018). Revealed: How dangerous fake health
news conquered facebook. https://www.independent.
co.uk/life-style/health-and-families/health-news/
fake-news-health-facebook-cruel-damaging-social-
media-mike-adams-natural-health-ranger-conspiracy-
a7498201.html. Acessed: 2018-05-22.
Gottfried, B. Y. J. and Shearer, E. (2017). News Use Across
Social Media Platforms 2017. Pew Research Center,
KDIR 2018 - 10th International Conference on Knowledge Discovery and Information Retrieval
100

Sept 2017(News Use Across Social Media Platforms
2017):17.
Hall, M., Frank, E., Holmes, G., Pfahringer, B., Reute-
mann, P., and Witten, I. H. (2009). The weka data
mining software: An update. SIGKDD Explor. Newsl.,
11(1):10–18.
Haynie, D. (2015). The u.s. and u.k. are the world’s most
influential countries, survey finds. www.usnews.com/
news/ best-countries/ best-international-influence.
Acessed: 2016-05-23.
Help, T. (2018). About verified accounts. https://help.
twitter.com/en/managing-your-account/about-twitter-
verified-accounts. Acessed: 2018-05-14.
Hern, A. (2017). Google acts against fake news on search
engine. https://www.theguardian.com/technology/
2017/apr/25/google-launches-major-offensive-
against-fake-news. Accessed: 2018-04-13.
Hern, A. (2018). New facebook controls aim to re-
gulate political ads and fight fake news. https://
www.theguardian.com/technology/2018/apr/06/
facebook-launches-controls-regulate-ads-publishers.
Accessed: 2018-04-13.
Hutto, C. J. and Gilbert, E. (2014). Vader: A parsimonious
rule-based model for sentiment analysis of social me-
dia text. In Adar, E., Resnick, P., Choudhury, M. D.,
Hogan, B., and Oh, A. H., editors, ICWSM. The AAAI
Press.
Klein, R. (2017). An army of sophisticated bots is
influencing the debate around education. https://
www.huffingtonpost.com/entry/common-core-
debate-bots us 58bc8bf3e4b0d2821b4ee059. Aces-
sed: 2018-05-07.
Lazer, D. M. J., Baum, M. A., Benkler, Y., Berinsky, A. J.,
Greenhill, K. M., Menczer, F., Metzger, M. J., Nyhan,
B., Pennycook, G., Rothschild, D., Schudson, M., Slo-
man, S. A., Sunstein, C. R., Thorson, E. A., Watts,
D. J., and Zittrain, J. L. (2018). The science of fake
news. Science, 359(6380):1094–1096.
Loper, E. and Bird, S. (2002). Nltk: The natural language
toolkit. In Proceedings of the ACL-02 Workshop on
Effective Tools and Methodologies for Teaching Na-
tural Language Processing and Computational Lin-
guistics - Volume 1, ETMTNLP ’02, pages 63–70,
Stroudsburg, PA, USA. Association for Computatio-
nal Linguistics.
McCord, M. and Chuah, M. (2011). Spam Detection on
Twitter Using Traditional Classifiers. In Calero, J.
M. A., Yang, L. T., M
´
armol, F. G., Garc
´
ıa Villalba,
L. J., Li, A. X., and Wang, Y., editors, Autonomic and
Trusted Computing, pages 175–186, Berlin, Heidel-
berg. Springer Berlin Heidelberg.
Nichols, L. (2016). Poll: Majority find major media out-
lets credible. https://morningconsult.com/2016/12/
07/poll-majority-find-major-media-outlets-credible/.
Acessed: 2017-05-31.
OpenSources (2018). Opensources - professionally curated
lists of online sources, available free for public use.
http:// www.opensources.co/. Acessed: 2018-05-03.
Shao, C., Ciampaglia, G. L., Flammini, A., and Menczer,
F. (2016). Hoaxy: A Platform for Tracking Online
Misinformation. In Proceedings of the 25th Internati-
onal Conference Companion on World Wide Web, pa-
ges 745–750.
Souppouris, A. (2016). Clickbait, fake news and the power
of feeling. https://www.engadget.com/2016/11/
21/clickbait-fake-news-and-the-power-of-feeling/.
Accessed: 2018-05-07.
Statista (2018). Most popular social networks wor-
ldwide as of april 2018, ranked by number of
active users (in millions). https://www.statista.com/
statistics/272014/global-social-networks-ranked-by-
number-of-users/. Acessed: 2018-05-17.
Sysmonos (2009). An in-depth look at the most active
twitter user data. https://sysomos.com/inside-twitter/
most-active-twitter-user-data/. Acessed: 2018-05-17.
Tacchini, E., Ballarin, G., Della Vedova, M. L., Moret,
S., and de Alfaro, L. (2017). Some Like it Hoax:
Automated Fake News Detection in Social Networks.
ArXiv e-prints.
Tambuscio, M., Ruffo, G., Flammini, A., and Menczer, F.
(2015). Fact-checking effect on viral hoaxes: A mo-
del of misinformation spread in social networks. In
Proceedings of the 24th International Conference on
World Wide Web, WWW ’15 Companion, pages 977–
982, New York, NY, USA. ACM.
Twitter (2018a). Twitter - search api. https://developer.
twitter.com/en/docs/tweets/search/api-reference/
get-search-tweets. [Accessed: 2018-05-07].
Twitter (2018b). Twitter verified. https://twitter.com/
verified. Acessed: 2018-05-17.
Vargo, C. J., Guo, L., and Amazeen, M. A. (2017). The
agenda-setting power of fake news: A big data analy-
sis of the online media landscape from 2014 to 2016.
New Media & Society, page 146144481771208.
Weisman, J. (2018). Anti-semitism is rising. why
aren’t american jews speaking up? https://
www.nytimes.com/2018/03/17/sunday-review/anti-
semitism-american-jews.html. [Accessed: 2018-05-
07].
Contributions to the Detection of Unreliable Twitter Accounts through Analysis of Content and Behaviour
101
