
Integrated Protocol for Objective Pain Assessment
Maria Ghita
1,2
, Mihaela Ghita
1,2
, Clara Ionescu
1,2,3
and Dana Copot
1,2
1
Ghent University, Research Group of Dynamical Systems and Control, Technologiepark 914, Ghent 9052, Belgium
2
Core Lab EEDT, Flanders Make, Belgium
3
Technical University of Cluj Napoca, Department of Automatic Control, Memorandumului Street no 28, Cluj, Romania
Keywords: Non-Invasive Pain Measurement, Medical Devices, Residual Pain, Memory Effect, Nociceptor Stimulation,
Mechanical Pain, Measurement Protocol, Skin Impedance, Bioimpedance.
Abstract: In the absence of any standardized objective aid for measuring pain levels in human body, a manifold of
subjective tools have been developed to monitor chronic pain patients and intra-/post-operative analgesic
drug management. However, due to the subjective nature of the evaluation methods and tools, pain remains
a challenging phenomenon to be characterised for objective assessment and monitoring. In this paper we
briefly describe a protocol and methodology for non-invasive evaluation of pain as result of nociceptor
stimulation via skin impedance measurements. Both time-frequency domain analysis is performed,
providing interesting observations.
1 INTRODUCTION
Clinical literature, as well as biomedical engineering
literature, have identified the need of a non-invasive
medical device to measure the pain level in an
objective manner for patients. Pain is very important
phenomena in medicine and biology that includes
physiological, sensory, affective, cognitive,
behavioural and sociocultural aspects (Copot, 2018).
The subjective perception of pain is hard to quantify
and the most commonly used measures of pain
intensity are subjective methods, such as: numerical
rating scale (NRS), visual analogue scale (VAS) and
verbal rating scale (VRS) (Shieh, et al., 2018). All
tools currently available have a number of
limitations: i) they are not based on a mathematical;
ii) do not deliver an objective evaluation index, iii)
require the intervention by medical staff, iv) not
responsive to postoperative efforts of the patient, v)
not suitable for time-frequency domain dynamic
analysis, vi) do not provide continuous monitoring
and vii) they are often not reliable in all
measurement conditions (Shieh, et al., 2018).
Despite all those limitations, the perception of pain
is assessed in conscious awake patients from their
personal feedback information. The NRS is the most
commonly used pain scale, and patients are asked to
rate their pain level on a 0–10 scale.
Recommendations on pain management
strategies are based on the index provided by those
ratings and/or on caregiver’s opinion when patients
are not conscious or awake (e.g. infants, children,
anesthetized or delirious patients). Evaluating the
postoperative pain in intensive care units is a
necessary part of the overall treatment plan (Czaplik,
et al., 2012). According with recent studies, pain is
identified by the American Pain Society (APS) as
the fifth vital indicator in diseases and diagnosis
chart along with temperature, blood pressure, pulse
and respiration rates (Shieh, et al., 2018; Yang, et
al., 2017; Merboth and Barnason, 2000; McCaffery
and Pasero, 1997).
Ideally, a pain detection and evaluation device
should be non-invasive, applicable on any individual
and monitor changes in real time and in correlation
with the administered medication. To meet the
requirements of an objective pain assessment, the
concept of a continuous pain measurement by means
of non-invasive skin impedance measurements
enables clinicians to provide personalized and
effective pain management.
The scope of this paper, is to present and discuss
such a system. The ANSPEC-PRO prototype has
been validated in awake participants with self-
induced nociceptor excitation (Copot and Ionescu, in
print). Currently, it undergoes a clinical trial on post-
operatory awake patients in ICU at Ghent University
Hospital, Belgium (B670201734377).
Apart from the studies related to correlations to
NRS and other features enabled by such a device, it
Ghita, M., Ghita, M., Ionescu, C. and Copot, D.
Integrated Protocol for Objective Pain Assessment.
DOI: 10.5220/0006895300870092
In Proceedings of the 5th International Conference on Physiological Computing Systems (PhyCS 2018), pages 87-92
ISBN: 978-989-758-329-2
Copyright © 2018 by SCITEPRESS – Science and Technology Publications, Lda. All rights reserved
87

is interesting to investigate memory of pain as part
of extracellular tissue dynamics and latency in
perception process. This gives an in-depth
information that could explain changes in thresholds
for pain management decision makers, such as in
chronic pain patients.
The paper is organized as follows. The available
measurement tools are briefly described in the
second section, along with the prototype developed
at Ghent University in our lab. Section 3 describes
the protocol and methodology proposed to be
followed in this study. The results are given in the
fourth section along with a short discussion of their
usefulness and limitations. A conclusion section
summarizes the main outcome of this work and
points to further steps.
2 AVAILABLE DEVICES
2.1 Commercial Devices
Objective tools developed for pain measurement
during consciousness and unconsciousness of the
patients in intensive care units (ICU) are one of the
main subject for further research. None of the
commercial devices can accurately measure pain
levels, despite the efforts to demonstrate the validity
and reliability of tested data. The following devices
for pain assessment have been developed in the last
fifteen years.
Med-Storm Pain Monitor is a medical device
intended to determine a patients’ sensitivity to pain
(http://www.med-storm.com/). The system uses real-
time data measurements to measure pain/nociceptive
stimuli and awakening during anaesthesia, intensive
care, in adults, children and infants. Hence, the
exosomatic electrodermal activity is measured in
terms of conductance. After different studies, there
was developed a standard index (not-standardized
method): The Skin Conductance Algesimeter index,
which is represented by the skin conductance
responses (SCR) per second. The company has
already delivered and sold the equipment for clinical
research projects or for diagnostic purposes, but is
not used by critical care clinicians because Med-
Storm Pain Monitor is not considered proper to be a
substitute for the medical stuff judgement and it
cannot be liable for the results obtained using it
(www.med-storm.com). This device is not suitable
for awake patients, nor for chronic pain patients.
AlgiScan monitors depth of analgesia in sedated
and unconsciousness patients using pupillary reflex
dilation (PRD). This method has been studied for the
evaluation of the level of sensibility to nociception
and in the prediction of the haemodynamic reactions
to nociceptive stimuli in volunteers and surgical
patients (www.medica.de). The pilot studies relate
that in anesthetized patients the pupil increase in size
due to an incision/tetanic electrical simulation,
measurements that can be highlighted by AlgiScan
device which indicates a pain pupillary index (PPI).
However, further research is required in order to use
AlgiScan as a standardised “objective “device for
pain measurement. This device is not suitable for
awake patients (discomfort due to blocked eyelid).
MEDASENSE is based on changes in
physiological parameters (heart rate, temperature,
skin conductance level and more) affected by pain
and analgesic medications. The technology
combines a non-invasive, finger-mounted probe for
collecting the physical data with artificial
intelligence algorithms that convert the data into a
Nociception Level Index (NOL). The pain-related
index is between 0 (no pain) and 100 (extreme pain).
This device is not available in Europe.
2.2 ANSPEC-PRO Prototype
ANSPEC – PRO device is a prototype developed
with the scope of continuously monitoring the pain
in patients who are conscious or not, by
measurements of changes in skin impedance
(Juchem and Ionescu, in review). An overview is
given in Figure 1.
Figure 1: ANSPEC-PRO prototype and afferent compo-
nents of the system.
The elements of the ANSPEC – PRO device are
listed here below.
- Disposable standard electrodes – are
interfacing the skin and the device and are
temporarily attached in the palm of the hand. This is
a three-electrode system, two current-carrying
electrodes and one pick-up electrode, which picks up
the voltage without carrying any currents for no
PhyCS 2018 - 5th International Conference on Physiological Computing Systems
88

polarization. The electrodes are disposable (single
use only).
- Data-acquisition circuit – essentially consists
of a power supply for the electrodes and interfaces
the microprocessor of the device with the signals
acquired by the electrodes. A carefully designed
voltage signal is sent to excite a part of the skin
using a National Instruments (Texas, USA) device
(cRIO9074 with NI9201- and NI9263-slots). The
current induced in the circuit by this voltage is
related to the bio-impedance of the human skin. A
voltage buffer limits the supplied current to +/-
20mA, well below the maximum allowed for in vivo
studies (5A).
- DELL Laptop computer – is used for capture,
save and display measured data in real time; is
interconnected through Ethernet with the data-
acquisition circuit. The laptop is a standard laptop
with the operating system Windows 7 Enterprise 64-
bit and a INTEL® Core ™ i7-6600U CPU@2.80
GHz processor.
- User interface – is developed in LabView.
In short, ANSPEC-PRO device is a non-invasive
method for continuously measurements of changes
in skin impedance caused by an applied stimulus
(pain). The changes in skin impedance reflect
changes in the extracellular fluid matrix composition
which facilitates the electro-chemical channel
communication for pain signalling pathway.
Electrical variability in the electrical carrier
throughout the signalling pathway, originated by
mechanical nociceptor stimulation, affect the
response of the skin related in impedance values.
The device measures the current i(t) coming from
the skin. Also, it acquires the measured signal v(t)
with a 15KHz sampling frequency, f
s,
and sends it to
an analogue output port, using zero-order hold
protocol for digital signal processing (Copot, 2018).
As part of the signal conditioning step, the current is
transformed to a voltage, using a transimpedance
amplifier (TIA), which can be then interpreted by
the algorithms, as in the Figure 2.
Figure 2: Block diagram with the skin impedance Z(s,k) as
black box system.
The bio-electrical-impedance is the Laplace
transform equivalent model Z(s), with s=d/dt the
Laplace operator, of the ratio of the Laplace
transformed voltage V(s) and current I(s) signals.
The impedance can be evaluated using spectral
identification methods, and further parametric model
identification as given in (Ionescu and De Keyser,
2003). The impedance is further evaluated using
moving averaged windows over time, such that it
depicts a both time- and frequency- domain
variability index Z(s,k), with k denoting the
discretized time (Pintelon and Schoukens, 2012).
3 PROTOCOL AND
METHODOLOGY
3.1 Hypothesis
In this paper, we discuss the two major hypothesis
for our study:
1. that a latency exist which implies a minimum
time elapsed for nociception stimulation to fade
under the threshold for pain pathway to be open
– if measurement time between nociception
stimulation time intervals is not adequately
chosen, one gets residual pain/memory effect.
The clinical implication of this is over-dosing.
2. that the impedance of extracellular fluid
changes is not dependent on sensor location.
The clinical relevance of this hypothesis is that
the location of the electrodes may be chosen
freely and does not affect the impedance values.
Both hypotheses are made under the further
assumption that no other device/sensor/monitor is
present on the patient/volunteer at the time of
testing.
3.2 Protocol
The participants were the authors of this paper. The
biometric information of two volunteers are:
Volunteer #1 – weight 70 kg, height 1.80 cm,
age 24 years, female
Volunteer #2 – weight 66 kg, height 1.79 cm,
age 24 years, female.
The volunteers approved with the protocol and
procedures prior to data collection. Both participants
were eligible and reliable for this study, especially
because their biometric data are similar and it is
expected to have virtually no effect on results.
Subjects are clinically healthy, awake and without
prior pain or related medications.
The protocol has been designed for 36 minutes
and was conducted indoors, as follows.
Integrated Protocol for Objective Pain Assessment
89

Case A: participants were asked to sit on a chair
and act normally without affecting the sensors
attached to the left hand. Data acquisition starts with
a reference range of
- 2 minutes when no pain is applied (NP1).
The activity continues with pain/no pain
alternation:
- 1 minute nociceptor stimulation applied
with a clip on the right hand (P1),
- 1 minute no pain applied (NP2),
- 1 minute nociceptor stimulation applied
with a clip on the left hand – same location
with the sensors (P2),
- 1 minute no pain applied (NP3),
- 1 minute nociceptor stimulation applied
with a clip on the right ear – totally
different location with the sensors (P3),
- 2 minutes no pain applied (NP4).
The total period of time for following the
procedure in Case A is 9 minutes.
Case B: participants were asked to take the same
sitting position as in case A. The measuring session
starts (NP1) and ends (NP2) also with a period of 2
minutes when no pain is applied to have a reference
for the measurements.
Between the reference range of measurements,
the procedure has been realised continuously:
- 1 minute nociceptor stimulation applied
with a clip on the right hand (P1),
- 1 minute nociceptor stimulation applied
with a clip on the left hand – same location
with the sensors (P2),
- 1 minute nociceptor stimulation applied
with a clip on the right ear – totally
different location with the sensors (P3).
The total period of time for following the
procedure in Case B is 7 minutes.
The time interval elapsed between the two cases
for measurement on the same individual was 20
minutes.
In order to investigate the existence of a memory
effect of pain or residual pain, the protocol
procedures enables to observe differences in data
between Case A and Case B (sensors placement is
on the left hand, pain location is maintained: right
hand (P1), left hand (P2), right ear (P3)).
3.3 Analysis Tools
The recorded data were post-processes and analysed
in MATLAB (The MathWorks, Inc. USA) version
R2017b (9.3).
Figure 3: Electrical Scheme Analogy.
The system has 2 inputs: the multisine excitation
signal U(s) and the nociceptor stimulus N(s):
(
)
()
=()
(
)
()
(1)
with V(s) and I(s) the measured signals. Define now
the vectors:
=
, and
=
(2)
containing the cross-power spectra
(
)
between
two distinct signals and auto-power-spectra
(
)
of a signal. It follows that:
(
)
=
(
)
(
)
(3)
If the nociceptor stimulation signal is not
correlated with the multisine excitation signal, then
the impedance can be directly estimated from (3).
Every 60 sec, the impedance is calculated and
plotted against frequency, by means of its real and
imaginary parts. The complex impedance is then
normalized and analysed per interval of pain (P) or
no pain (NP), as the response of the nociceptor
excitations.
The variability within individual is observed
with ANOVA method, using absolute individual
impedance values. Boxplot analysis is the procedure
used for determining whether variation in the
response variable arises within the same individual,
for both protocols.
One way anova has been used to compare among
the group of values. The function ANOVA1 has
been used in Matlab which returns box plots of the
observations in data y, by group. Box plots provide a
visual comparison of the group location parameters.
If y is a vector, then the plot shows one box for each
value of group. If y is a matrix then the plot shows
one box for each column of y. On each box, the
central mark is the median and the edges of the box
are the 25th and 75th percentiles (1st and 3rd
quantiles). The whiskers extend to the most extreme
PhyCS 2018 - 5th International Conference on Physiological Computing Systems
90
data points that are not considered outliers. The
outliers are plotted individually. The interval
endpoints are the extremes of the notches. The
extremes correspond to:
q2±1.57(q3–q1)
√
(4)
where q2 is the median (50th percentile), q1 and q3
are the 25th and 75th percentiles, respectively, and n
is the number of observations (excludes NaN
values).
Confidence intervals have been calculated at
95\%, and significant differences defined for p-
values<0.05. The function TTest in Matlab has been
used.
4 RESULTS
4.1 Bio-electrical-impedance as
Function of Frequency
The frequency response of the bio-electrical-
impedance for every protocol interval in Case A is
depicted in Figure 4, using experimental data from
volunteer #1.
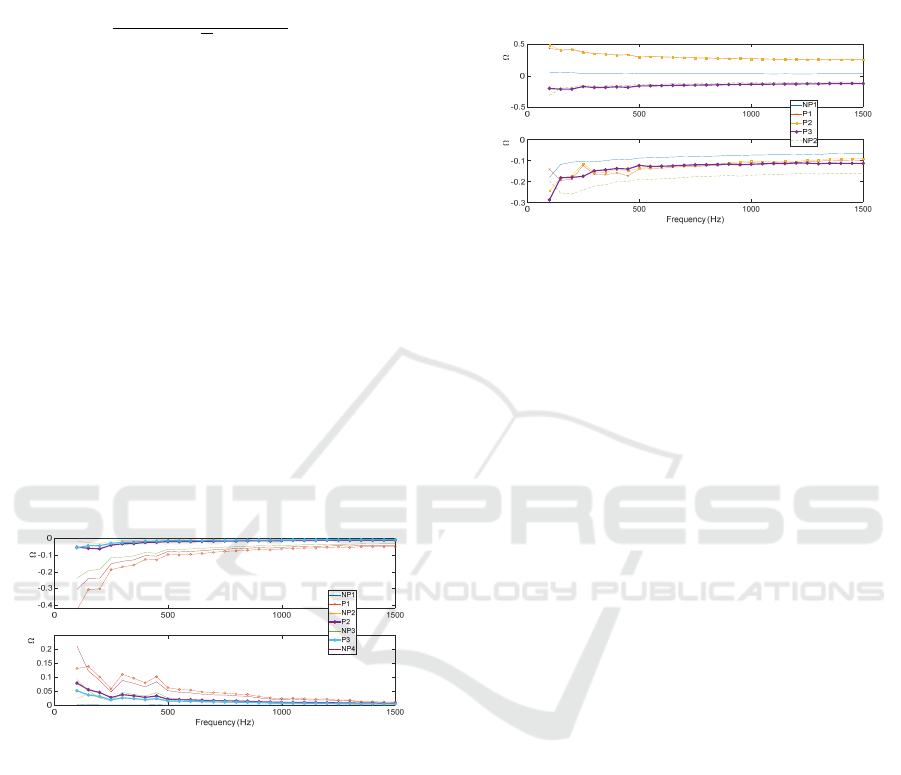
Figure 4: Individual frequency response of the normalized
impedance, evaluated for “pain”/”no pain applied”
intervals for case A.
It is observed that the bold lines that denote the
second (P2) and third (P3) pain interval responses
overlap the corresponding non-pain intervals: NP2
and NP3. This suggests that NP2 and NP3 indicate
the presence of pain latency (i.e. memory pain).
Hence, even in absence of nociceptor stimulation,
the impedance indicates presence of pain pathways
because of the pain memory effect. Also, since the
nociceptor stimulus is applied in different locations
and still detected with our non-invasive
measurement device, we conclude that the device is
sensitive to any stimulation through the
physiological pathway of pain.
At this point, the first hypothesis of our study is
demonstrated.
In the protocol for Case B, the pain is applied
continuously to different places on the volunteer #1
and the responses are evaluated per interval, as
depicted in Figure 5.
Figure 5: Individual frequency response of the normalized
impedance, evaluated for “pain”/”no pain applied”
intervals for case B.
From the three locations of the nociceptor
stimulation tested, it can be seen that the first two
pain responses (P1 and P2) seem to give the same
result. This relates to the left and right hand,
respectively. The third one (P3) suggests some
differences (the bold line with circle marks) – on the
ear. Further analysis will clarify whether or not the
location on the ear provides biased results due to
electrical activity of other nearby sources (e.g.
brain).
Therefore, the bio-impedance is sensitive to any
nociceptor stimulation location. While the
impedance has different values for each interval, the
amplitude value cannot be correlated to the stimuli
location.
The second hypothesis of our study is also
demonstrated.
4.2 Variability within Individual
From the two protocols analysed above, the
variability within the same individual is described by
means of boxplot in Figure 6. Instead of complex
(real and imaginary parts), we now introduced the
absolute values of the impedance |Z| obtained for
each nociceptor stimulation interval.
For the first pain interval (P1), there are no
statistical significant differences within individual
per protocol (p<0.7). By contrast, the second (P2)
and third (P3) pain interval, significantly differences
are observed (p<0.05). Despite the fact that all
nociceptor stimulation amplitudes are equal, the P2
and P3 data are clearly higher in amplitude for case
B than for case A. This is due to overlapping of
electrochemical ions channel activity in case B,
Real Part ( )
Imaginary Part ( )
Real Part ( )Imaginary Part ( )
Integrated Protocol for Objective Pain Assessment
91

since in the proposed protocol the no-pain intervals
are not performed.
Figure 6: Absolute values of frequency response complex
impedance in one individual per protocol (Case A and
Case B). Each figure depicts boxplot analysis in all pain
intervals during both protocols.
5 CONCLUSIONS
This work describes the first steps towards a novel
non-invasive pain detection, evaluation and
monitoring in chronic pain patients. Ideally, the
same index would be valid also for analgesic drug
dose management in general anaesthesia. The
protocol and biosignal processing methodology
proposed here lead to results to support the claim
that latency of pain pathway exists (i.e. memory
pain). Additionally, the tests indicated the technical
soundness of the measurements, by accurate
detection of nociceptor stimulation intervals through
skin impedance evaluation. The location of
nociceptor stimulation has no effect to the the
accuracy of the device.
The evaluation of the ANSPEC-PRO prototype
in clinical environment for patients experiencing
post-operative pain is currently ongoing. Major
challenges are expected by evaluating a “pain index”
that can be correlated with patient information, in
order to make ANSPEC -PRO clinically useful.
ACKNOWLEDGEMENTS
The authors appreciate the support given by Martine
Neckebroek for the useful discussions and Jasper
Juchem for the technical assistance.
This work has been financially supported by
Flanders research centre grant nr 1501517N and
G026514N.
REFERENCES
Copot, D., 2018. PhD thesis "Fractional calculus based
methods and models to evaluate diffusion in human
body", Ghent University.
Copot, D., Ionescu, C., 2018. Prototype and Methodology
for Non-Invasive Nociception Stimulation and Related
Pain Assessment in Awake Individuals accepted to
IEEE Transactions on Biomedical Engineering
Czaplik, M., Hubner, C., Kony, M., Kaliciak, J., Kezze, F.,
Leonhardt, S., Rossaint, R., 2012. Acute pain therapy
in postanesthesia care unit directed by skin
conductance: a randomized controlled trial. PLoS
ONE, July, Volume 7, Issue 7, e41758.
Ionescu, C. M. and Keyser, R. D., 2003. A novel
parametric model for the human respiratory system.
Proc. of the IASTED International Conference on
Modelling and simulation, Acta Press, pp. 246-251.
Juchem, J., Ionescu, C., Bioimpedance Measurement
Device for Nociceptor Stimulation Detection,
submitted to IEEE Trans on Biomed Circ and Syst
McCaffery, M. and Pasero, C. L., 1997. Pain ratings: The
fifth vital sign. The American Journal of Nurses,
Volume 97, pp. 15-16.
Merboth, M. K. and Barnason, S., 2000. Managing pain:
The fifth vital sign. Nursing Clinics of North America,
Volume 35, pp. 375-383.
Pintelon, R. and Schoukens, J., 2012. System
Identification: A Frequency Domain Approach, Wiley-
IEEE Press. New Jersey, 2nd Edition.
Shieh, J.-S., Dai, C.-Y., Wen, Y.-R., Sun, W.-Z., 2018. A
novel fuzzy pain demand index derived from patient-
controlled analgesia for postoperative pain. IEEE
Transactions on Biomedical Engineering, January,
Volume 54, Issue 12, pp. 2123-2132.
Yang, G., Jiang, M., Ouyang, W., Ji, G., Rahmani, A.,
Liljeberg, P., Tenhunen, H., 2017. IoT-based remote
pain monitoring system: from device to cloud
platform. IEEE Journal of Biomedical and Health
Informatics, DOI: 10.1109/JBHI.2017.2776351.
PhyCS 2018 - 5th International Conference on Physiological Computing Systems
92
