
Training and Re-using Human Experience: A Recommender for More
Accurate Cost Estimates in Project Planning
Christian Rudolf von Rohr
1,2
, Hans Friedrich Witschel
1
and Andreas Martin
1
1
FHNW University of Applied Sciences and Arts Northwestern Switzerland, CH-4600 Olten, Switzerland
2
Agentur Frontal AG, Willisau, Switzerland
Keywords:
Effort Estimation, Experience Management, Case-based Reasoning, Machine Learning.
Abstract:
In many industries, companies deliver customised solutions to their (business) customers within projects. Es-
timating the human effort involved in such projects is a difficult task and underestimating efforts can lead to
non-billable hours, i.e. financial loss on the side of the solution provider. Previous work in this area has fo-
cused on automatic estimation of the cost of software projects and has largely ignored the interaction between
automated estimation support and human project leads.
Our main hypothesis is that an adequate design of such interaction will increase the acceptance of automa-
tically derived estimates and that it will allow for a fruitful combination of data-driven insights and human
experience. We therefore build a recommender that is applicable beyond software projects and that suggests
job positions to be added to projects and estimated effort of such positions. The recommender is based on the
analysis of similar cases (case-based reasoning), “explains” derived similarities and allows human intervention
to manually adjust the outcomes. Our experiments show that recommendations were considered helpful and
that the ability of the system to explain and adjust these recommendations was heavily used and increased the
trust in the system. We conjecture that the interaction of project leads with the system will help to further
improve the accuracy of recommendations and the support of human learning in the future.
1 INTRODUCTION
In industries such as consulting, design or software
development, companies deliver non-standardised,
custom solutions to their customers within projects.
Before a project starts, the solution provider usually
creates an offer in which the required (human) effort
is estimated.
On the one hand, this offer needs to be competitive
and avoid any unnecessary cost for the customer, on
the other hand, significantly underestimating the ef-
fort leads to non-billable hours and thus financial loss
on the side of the provider. Of course, at the outset of
a project, there is a high uncertainty regarding project
risks, involved staff etc., which can lead to deviations
between estimated and actual effort by a factor of up
to four, as an early survey on software development
projects by Boehm (1984) has shown.
However, project leaders can learn and improve
their estimates based on experiences from past pro-
jects: as they lead projects through various phases,
they see how certain patterns emerge and can learn
e.g. to better judge the complexity of recurring tasks.
In some areas, such patterns and experiences have
been collected and published for common reference
(Jorgensen, 2005).
Since project leaders usually only see a fraction
of a company’s projects and since tasks, estimates
and actual costs are often formally captured in infor-
mation systems, automating the estimation based on
such historical project data has attracted researchers’
interest (Chulani et al., 1999), also and especially in
the area of machine learning (see e.g. (
ˇ
Stolfa et al.,
2013)).
There are indications that humans tend not to fully
trust automatically derived estimates, especially when
it is impossible to trace them – as would be the
case for e.g. a regression based on a neural network
(Leung, 2002). Accordingly, analogy-based estima-
tion (ABE) has been shown to be an effective esti-
mation method (Ruhe et al., 2003) since it mimicks
human problem solving based on analogies between
projects and hence gives the humans a better under-
standing of the result.
As we will discuss in Section 2, there is a great
wealth of work in the area of effort estimation for
52
Rohr, C., Witschel, H. and Martin, A.
Training and Re-using Human Experience: A Recommender for More Accurate Cost Estimates in Project Planning.
DOI: 10.5220/0006893200520062
In Proceedings of the 10th International Joint Conference on Knowledge Discovery, Knowledge Engineering and Knowledge Management (IC3K 2018) - Volume 3: KMIS, pages 52-62
ISBN: 978-989-758-330-8
Copyright © 2018 by SCITEPRESS – Science and Technology Publications, Lda. All rights reserved

software development. In our work, we aim at a more
general method that is able to estimate efforts in ar-
bitrary domains. To achieve this, we make a second
and more important contribution: we explicitly ad-
dress the interaction between automated components
and a human project lead. This interaction will make
it possible to benefit and learn from human experience
without modeling it formally in advance. As we will
show, it will furthermore increase both the acceptance
of the estimations and their quality.
The remainder of this paper is structured as fol-
lows: Section 2 gives an overview of related work in
the area of effort estimation. In Section 3, we des-
cribe the methodology of our research, before propo-
sing our semi-automated effort estimation approach
in Section 4. Section 5 summarises the results of our
evaluation and Section 6 the conclusions drawn from
it.
2 RELATED WORK
Effort estimation is an essential prior step in projects
to satisfy tight constraints in terms of limited resour-
ces. A successful project with a valid effort estimation
involves planning and decision-making since time and
money is usually limited.
As Boehm (1984) identified, estimating is diffi-
cult because resource investments in system analysis
and demand planning have to be defined at the be-
ginning of a software project and decisions about the
test volume and the priority of product improvements
can only be made in later project phases. Moløkken-
Østvold and Jørgensen (2003) analysed data sets from
companies in the software industry to see why effort
estimation projects failed, with the result that 60-80%
of the analysed projects were above the budget and
lasted longer than the proposed schedule.
2.1 Methods for Effort Estimation
As observed in the study by Moores and Edwards
(1992), expert-based estimation by a comparison of
similar past projects was identified as the most fre-
quently used method for cost estimation. Besides,
Boehm et al. (2000) summarised six categories of es-
timation approaches in software development cost es-
timation:
• Model-based approaches mostly involve a pro-
prietary algorithmic model, where the effort pre-
diction is often based on ”off-the-shelf” formulas.
• Expert-based knowledge of previous/known pro-
jects that are most commonly used in companies,
which can be supported by experience manage-
ment approaches such as Case-Based Reasoning
(CBR).
• Learning-oriented approaches are focusing on
learning from explicit knowledge such as Artifi-
cial Neural Networks (ANNs) or CBR as well.
• Dynamic-based methods try to consider changes
such as the effort or cost factors change, during
the project lifetime in projects, in their predicti-
ons.
• Regression-based techniques – as an especially
important form of machine learning approaches –
are a favourite way of building models, such as
Ordinary Least Squares (OLS), which is a well-
suited technique when much data is available.
• Composite techniques are the sixth category in
the list by incorporating several of the mentioned
techniques such as a combination of regression-
based techniques with model-based and learning-
oriented methods.
For this paper, composite techniques integrating
expert-based effort estimation and learning- oriented
approaches were identified as the most appropriate as
they allow involvement of an expert to gain trust and
also permit a high level of transparency to make mea-
ningful recommendations.
2.2 Case-based Reasoning
Case-based reasoning (CBR) can be seen as ”reaso-
ning by remembering” (Leake, 1996, p. 2) or ”re-
asoning from reminding” (Madhusudan et al., 2004)
and as a technically independent methodology (Wat-
son, 1999) for humans and information systems (Mar-
tin and Hinkelmann, 2018). ”Case-based reasoning
is both [...] the ways people use cases to solve pro-
blems and the ways we can make machines use them”
(Kolodner, 1993, p. 27). Bergmann et al. (2009) re-
gard CBR as a sub-field of artificial intelligence with
its roots in cognitive science, machine learning and
knowledge-based systems. ”CBR uses the knowledge
of previously experienced cases to propose a solution
to a problem” (Martin and Hinkelmann, 2018, p. 48).
The general CBR methodology can be explained
using the four R’s of the CBR cycle of Aamodt and
Plaza (1994), which are as follows (Martin et al.,
2016, p. 3-4):
1. Retrieve the most similar case(s) from the case
base (knowledge repository).
2. Reuse the lesson from the retrieved case(s) as the
suggested solution for the new situation.
Training and Re-using Human Experience: A Recommender for More Accurate Cost Estimates in Project Planning
53

3. Revise the new case after evaluating it in the new
situation (problem).
4. Retain useful experience for future reuse.
The Retrieve step within CBR requires a similarity
model to compare case characterisations based on the
vocabulary containing specific features (Martin and
Hinkelmann, 2018). Similar, the reuse of CBR requi-
res an adaptation model to provide an adequate adap-
tation of a previous solution to the current situation
(Martin and Hinkelmann, 2018).
2.3 Analogy-based Estimation
In the field of effort estimation, CBR has been widely
used for solving problems encountered by project ma-
nagers in the area of software engineering. Analogy-
Based Estimation (ABE) is, therefore, a form of CBR
(also known in effort estimation as Estimation By
Analogy (EBA)). The idea behind ABE is to compare
a project, the current situation, with similar historical
projects from the case base.
Thus, the effort of the target project is determined
as a function of the known efforts of its similar pro-
jects (Li et al., 2007; Shepperd and Schofield, 1997).
Four components are included in ABE: (1) a histo-
rical data-set, (2) a similarity function, (3) retrieval
rules and (4) a solution function.
Based on Ruhe et al. (2003), ABE performed best
in 60% of the cases, compared to purely expert-based
(without considering CBR) and model-based effort
estimation. ABE has many advantages such as a bet-
ter acceptance of results by users (Leung, 2002; Wal-
kerden and Jeffery, 1999), the ability to deal with
poorly understood domains (Walkerden and Jeffery,
1999), the applicability in the very early phase of
projects (Leung, 2002) and minimisation of outliers
(Walkerden and Jeffery, 1999).
Because of their transparency and ability to ex-
plain estimates, CBR/ABE were identified as the most
promising basic approach for this research. However,
there are two gaps that we wish to close: firstly, these
approaches have not been applied systematically to
effort estimation in areas other than software deve-
lopment. Secondly, besides explanation of estimates,
we explore the possibility of interaction, allowing hu-
mans to contribute their own experience to improve
the estimates of the machine.
3 METHODOLOGY
Design science research (DSR, Vaishnavi and Kue-
chler (2004)) was used as the main method of this
study. Conducting DSR in two iterations allowed to
evaluate early a generic hypothesis and refine the sy-
stem for the final realisation.
Starting with the awareness phase, the problem
was observed and validated from primary data, a fo-
cus group and structured observations (Shaughnessy
et al., 2012):
• The data analysis was performed on a data base
of projects, containing both estimates and actual
efforts and allowed to study the problem of non-
billable hours from primary data.
• Eight experienced project leaders participated in
the focus group. Participants were tasked to in-
dividually estimate two fictitious project cases to
bring up and discuss problems in effort estimation
and non-billable hours. Further, problems expe-
rienced in past projects were brought up and dis-
cussed by participants, along with problems co-
ming from the prior data analysis.
• To understand the procedure and problems in the
offer creation process (including the effort esti-
mation), four project leaders were observed du-
ring offer creation of two historical cases. These
structured observations helped to understand
the process better and to know exactly where to
provide support for the estimator.
The outcome was then analysed and a generic
hypothesis was formed. Taking account of data ana-
lysis outcome and findings from the focus group, the
goal of the suggestion phase was to find meaningful
data (e.g. features) that could be used for the system
(Section 4.3).
Based on those findings, a prototype targeting re-
cognised problems was built and a formative evalua-
tion was performed with qualitative research methods,
involving estimators to test the prototype and to get
feedback for the second iteration.
Within the second iteration, findings from the for-
mative evaluation in iteration 1 were used to refine
the system. During the second iteration, the final sy-
stem was planned and built. At the end, a summative
evaluation was performed, where project leads were
involved to perform the entire process of offer crea-
tion with the help of the system and to observe their
acceptance of recommendations.
4 SUPPORT FEATURES FOR
EFFORT ESTIMATION
The main goal of our research is to support effort
estimation by combining expert-based with learning-
KMIS 2018 - 10th International Conference on Knowledge Management and Information Sharing
54

oriented methods. Learning-oriented are often accu-
rate in predicting effort from sample data, whereas the
final decisions are usually made by humans. Deci-
sion makers therefore need to fully trust data coming
from learning-oriented methods. This means that they
need to receive actionable recommendations and un-
derstand how they were derived.
ABE as a special form of CBR supports practi-
tioners in the effort estimation process in a familiar
way. During the RETRIEVE stage, project leaders
search for similar cases, whereas in the REUSE and
REVISE stages, similar cases can be used to derive
and improve the estimate for the problem case.
This paper presents a system that supports practiti-
oners in these stages. First, data used for experiments
is described in Section 4.2. Section 4.3 explains con-
ducted experiments used for the feature selection. Fi-
nally, Section 4.4 outlines the similarity function used
in the RETRIEVE stage to find similar cases as a
starting-point, and also to learn recommendations that
are suggested. In Section 4.5 we introduce three ty-
pes of recommendations that are learned from similar
projects’ data. Project leaders are asked to adapt re-
commendations or study recommendation details to
amend proposed values.
4.1 Estimation Process and Need for
Recommendations
From the structured observations that we performed
with four project leads (see Section 3), we constructed
a list of activities that project leads perform when
planning a new project. In the following, we present
activities observed at least twice, in a form that shows
its analogy to the CBR cycle. The numbers in brac-
kets behind each activity indicate how many of the 4
test persons performed it.
1. Get informed: study the customer briefing (4/4),
identify required services (4/4), break down requi-
rements into work packages (4/4)
2. Retrieve: search for project drafts (4/4), search
projects of same client (3/4), search for projects
having the same keywords in title and tasks (4/4),
ask other projects about similar past projects (3/4)
3. Reuse: copy information from matching draft
project (4/4) or similar projects where applicable
(4/4), start empty project if nothing similar is avai-
lable (3/4)
4. Revise: enter basic project data (4/4), add posi-
tions that the customer did not mention, but
that are required by experience (2/4), remove
or set as optional non-required positions (2/4),
check estimated and actual effort and adjust
estimated effort accordingly (2/4), adjust po-
sitions that are influenced by other positions
(e.g. project management (2/4), adjust by stra-
tegy, e.g. lower effort to win a project (4/4), as-
sume higher effort for a new customer (3/4) or
a customer known to be demanding (3/4), meet
the budget (2/4)
evaluate offer by asking another project lead
(4/4), consider total amount for further adjust-
ments (2/4), submit offer to customer (4/4), call
customer (3/4), adjust offer after interaction with
customer (4/4)
The CBR cycle is very clearly reflected in the ob-
served behaviour and many actitivies are performed
by all project leads.
We have highlighted in bold font those activities
where our system will hook in to support the process.
In summary, the support will need to address four is-
sues: 1) finding similar projects, 2) identifying additi-
onal positions, 3) adjusting efforts based on experien-
ces and 4) finding an expert to review the offer.
For issue 1), the observed strategies of the project
leads (searching by customer, title and task keywords)
have guided our implementation. Similarly, project
leads’ strategies for issue 3) helped us to derive featu-
res and strategies for automatic effort estimation (e.g.
new and demanding customers etc.)
4.2 Data Preprocessing and Analysis
A comprehensive data set including over 13’000 con-
ducted projects from the past 8 years was used for
this study. As preparation for the experiments and the
final system, project data was analysed and prepro-
cessed. During the preprocessing, the following steps
were performed:
• Outlier removal: removing projects with an un-
realistic actual/estimated effort ratio coming from
cross-subsidisation
• Feature creation: generating new features by cal-
culating values from attributes. The new features
will be described in Section 4.3 below.
• Text processing: stemming, stop-word removal
and term frequency - inverse document frequency
(TFIDF, Joachims (1996)) calculation for textual
features
Finally, 7’946 projects remained for the following
feature selection and usage for the recommendation
system.
Related to the project data, job data was available
that allowed for more detailed insights regarding es-
timated effort and effort outcome. Projects consist of
Training and Re-using Human Experience: A Recommender for More Accurate Cost Estimates in Project Planning
55

multiple jobs, which were estimated by project lea-
ders and effort was reported by workers.
For example, a project Corporate Design might
consist of the jobs Concept, Logo Design, Business
Cards, etc. As effort estimation is performed at the
level of jobs, recommendations need to be stated at
that level to be directly applicable.
4.3 Feature Selection
To allow the system to work for various industries,
only data attributes that are domain unspecific were
considered in the feature selection. In the prior pre-
processing part, several features were suggested. To
prohibit the final system from over-fitting due to too
many features, most meaningful features were se-
lected based on project leads’ strategies (see Section
4.1. These features were evaluated by comparing the
output of different regression-based feature weighting
algorithms (CfsSubsetEval, ReliefAttributeEval) and
decision tree (M5P, REPTree) output.
The experiment was set up so that all features
were used to learn the regression for effort estimation,
whereas actual effort outcome was used as solution.
The accuracy of the decision trees could be compared
to the baseline (Zero-R) values performing a 10-fold
cross validation.
Table 1: Effort prediction accuracy (10-fold cross-
validation).
Zero-R M5P REPTree
Mean absolute error (MAE) 918.51 205.16 340.63
Root mean squared error (RMSE) 2156.45 670.77 1273.75
Table 1 shows, that learned trees had in average a
three times lower error rate compared to the baseline.
Highest ranked features are presented in Table 2.
Table 2: Results of feature selection.
Rank Feature Type
1 project-size numeric
2 contact nominal
3 customer nominal
4 year numeric
5 terms numeric
6 project-leader nominal
7 job-type numeric
8 standard-degree numeric
9 job-amount numeric
10 divison nominal
11 new-customer boolean
12 customer-
contacts
numeric
As effective effort is predicted, the project-size
(historical estimated costs) allows for a good starting
point to predict effort. Results show further, that cus-
tomer and contact are key factors in prediction, whe-
reas contact even ranges in one case above customer.
Remarkably, despite CfsSubsetEval considering re-
dundancy of features, both features seem meaningful
in combination. We can interpret this by acknowled-
ging that certain customers are more demanding than
others, and that this depends also largely on the con-
crete person who represents the customer.
Interestingly, the year when the project was con-
ducted is present in all results. Over the years, pricing
seem to have changed and thus is considered in the
regression calculation to predict effort. Job type and
project leader were not selected by all but the majo-
rity (3/4) of algorithms.
Terms were available as word-vectors and therefore
each as a separate feature. Many of the terms were
considered by the regression algorithms. However,
the top terms differed in all cases. Thus, for our
prototype, the most valuable terms (calculated by
TFIDF) in the system were considered. Lastly, the
degree of project standardisation was listed in 3/4 out-
comes, but scored rather low.
In the final system, the highest ranked six features
from Table 2 were used for the effort prediction. They
also represent the problem characterisation of cases
that are used in the Retrieve phase of CBR for the
similarity calculation, as described in the next section.
The solution of each case consists in the set of jobs
included in the project planning, together with their
respective actual effort.
4.4 Similarity Function
The similarity function is the component in ABE re-
sponsible for finding similar cases for the new pro-
blem case. For this study, the similarity function is
used first in the RETRIEVE stage to serve with pro-
jects to use as starting-point and as well in the REUSE
and REVISE stages to predict efforts based on regres-
sion models learned from similar projects.
Thereby, the feature importance of features can
be different compared to the ranks for the effort
prediction shown in Table 2. In the similarity
function, feature importance is controlled with dis-
tinctive weight factors used in the similarity formula
shown in Equation 1.
KMIS 2018 - 10th International Conference on Knowledge Management and Information Sharing
56
Sim(p, p
0
) =
n
∑
i=1
w
i
∗ SimScore( f , f
0
)
SimScore( f , f
0
) =
1 − z(| f
i
− f
0
i
|) if f
i
and f
0
i
are numerical or ordinal
1 if f
i
and f
0
i
are nominal and f
i
= f
0 if f
i
and f
0
i
are nominal and f
i
6= f
z(BM25( f , f
0
)) if textual, BM25 similarity score
1 − z(|ln( f / f
0
)|) for project-size
(1)
Here, z(·) refers to the minmax normalisation as
explained below.
As of Table 2, highest ranked six features were
used. Additionally, the feature customer-contacts was
chosen as problem recognition has shown that the cu-
stomer complexity was seen as a major problem by
estimators. From a CBR perspective, these features
characterise the problem of each case, whereas the es-
timation of effort for the jobs represents the solution.
For the different types, the similarity is calculated.
In case of numerical features, Manhattan distance is
used to calculate absolute distance. A special case is
shown in Equation 1 for the project-size. As simila-
rity measure for bigger projects should have a broa-
der range, the power-law distribution is converted to a
log-normal distribution by applying ln function.
The nominal features contact, customer and project-
leader receive a similarity score 1 for identical or 0
if not. Terms used in the feature selection were split
into two different features:
1. title-terms consisting of main project keywords
2. job-terms including terms that describe containing
work packages
The similarity score for textual features is calcu-
lated by applying BM25 algorithm (Robertson et al.,
1995) on the preprocessed terms.
Every SimScore is Min-Max-Normalized to have
an equal base, ranging from 0 to 1 (Equation 2).
z(x
i
) =
x
i
− min(x)
max(x) − min(x)
(2)
Distinctive feature weights w
i
in the similarity
function were then assessed to improve case retrieval.
To achieve this, feedback of project leaders was
gathered and optimum weights evaluated using an
Evolutionary Algorithm (EA). Two project leaders
from different domains rated in total five projects:
for each of the 5 projects, 100 similar projects were
shown, retrieved using the similarity function from
Equation 1 with all weights being equal. Resulting
answers (similarity = 1, 0, null) and feature scores of
similar cases were then used to distinguish optimum
feature weights by maximising Mean Average Preci-
sion (MAP) over all presented projects with the evo-
lutionary algorithm.
Table 3 contains calculated feature weights in des-
cending importance, including weight value finally
used for the similarity function:
Table 3: Feature weights in descending order of importance
for similarity function.
feature weight
title-terms 0.93789
customer 0.81036
customer-
contacts
0.77200
job-terms 0.57435
project-size 0.44832
contact 0.14102
year 0.06006
project-leader 0.00000
The number of customers’ contact persons, which
did not perform well for the effort prediction, re-
sulted in a very high importance for the similarity
function. Surprisingly, the feature project-leader re-
ceived a weight of 0.0 and was therefore ignored in
the similarity function.
4.5 Recommendations
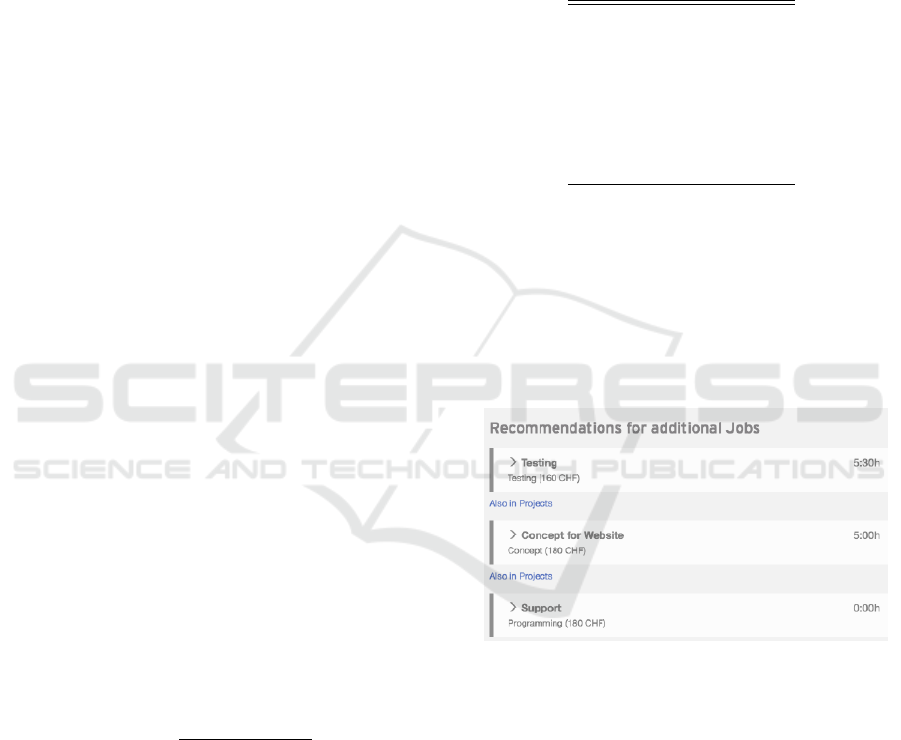
Figure 1: A screenshot of a R-1 recommendation.
As the final output of the recommender system, the
estimator receives actionable recommendations for
the defined problem case. Three recommendations
were proposed, based on findings of the problem re-
cognition in the awareness phase:
R-1 Propose Jobs for Addition:
Jobs from retrieved similar projects that are not
existing in the new case are proposed to the esti-
mator for addition, see Figure 1. Further, effort
is predicted based on found similar jobs. Esti-
mators receive links to related similar projects,
to review where those jobs were used (see the
link labeled “Also in projects” in Figure 1). This
allows the estimator to study similar projects to
Training and Re-using Human Experience: A Recommender for More Accurate Cost Estimates in Project Planning
57

Figure 2: A screenshot of a R-2 recommendation.
decide if the recommended job is appropriate for
the new case.
This recommendation was brought up, to (1)
support estimators in not forgetting jobs that are
necessary and to avoid the situation where they
could possibly not be billed later on and (2) to
create consistent data so projects are compara-
ble easier to learn from. Observations and the
focus group in the awareness phase had shown,
that these two problems are main drivers that can
lead to non-billable hours.
R-2 Propose Effort Adjustments:
Jobs from retrieved similar projects are mapped
to existing jobs of the new case to predict effort
for each new job. This mapping is accomplis-
hed by comparing terms and job-type. Features
presented in Section 4.3 and effort outcome of
mapped similar jobs are then used to predict ef-
fort for each job in the new case.
For effort prediction, Support Vector Regression
(SVR) was used. SVR was reported in studies to
outperform alternative algorithms such as linear
regression and radial basis functions neural net-
works (RBFNS) at effort estimation in software
projects (Oliveira, 2006; Garc
´
ıa-Floriano et al.,
2018). In addition to the predicted effort, the sy-
stem shows similar jobs and related projects that
allow the estimator to study historical effort out-
comes, see Figure 2. This recommendation can
support estimators having lack of experience for
that case (experience with customer, domain or
type of work), but also to learn from prior con-
ducted projects in general.
R-3 Propose Reviewers:
Most frequent project leaders from retrieved si-
milar projects are proposed as possible 4-eye re-
viewers.
4-eye reviews were found in the awareness phase
to be often conducted in companies, whereas not
institutionalised. This can help to gain know-
ledge of project leaders with different experien-
ces and/or skill-sets (e.g. knowing customer,
domain, type of work or soft skills).
Along with the interaction possibilities to review
and accept these recommendations, two supplemen-
tary interactions are offered.
A project-size slider allows the estimator to ap-
proximately define an overall project budget. As the
system works iteratively and retrieved projects are
re-evaluated on any change in jobs (effort change,
add/remove jobs), predicted efforts could be volatile.
This could confuse estimators and reduce trust in the
system. The project-size slider therefore stabilises
stated recommendations.
Further, the estimator may identify retrieved pro-
jects as not similar to the new problem case. The
second interaction possibility therefore allows to ig-
nore such projects for all recommendation computa-
tions (see the links labeled “ignore project” in Figure
2). Again, being able to control the input that the sy-
stem uses e.g. for regression should increase the trust
in the outcome and the quality of the result (assuming
that humans are effective in excluding non-relevant /
non-similar projects).
5 EVALUATION
5.1 Experimental Setup
The aim of our evaluation was to gain qualitative in-
sights – under realistic circumstances – into how pro-
ject leads would react to the automatically provided
recommendations. That is, we wanted to a) under-
stand reasons for adaptation or non-acceptance of re-
commendations and b) the accuracy of the resulting
cost estimates.
KMIS 2018 - 10th International Conference on Knowledge Management and Information Sharing
58

We conducted our field experiment in a company
that offers mainly two types of services, namely a)
design (of e.g. logos, corporate identities etc.) and b)
creation of web solutions. In the following, we will
call the corresponding divisions “design” and “on-
line”. For our experiment, we selected one senior and
one junior project lead from each division to reflect
the influence of various experience level on estima-
tion outcomes.
We then chose two historical projects, one from
each division. To study also the influence of project
complexity, we chose a rather standard project for the
online division and a more non-standard project in the
design area. The projects were ones that had been
conducted by the senior participants some years ago
– in order to conceal this fact, the attributes custo-
mer name, contact person and address were replaced
with fake values. However, we did provide informa-
tion about cost overruns caused by the respective cus-
tomer in earlier projects. Of course, the fact that pro-
jects were real means that both the historical effort es-
timates and the actually required efforts were known
in advance.
Table 4: Summary of test cases in terms of involved project
leads (PLs) and area / complexity of the presented project.
Test case PL Area complexity
1 junior design design non-standard
2 senior design design non-standard
3 junior online online standard
4 senior online online standard
Table 4 summarises the characteristics of our 4
test cases.
For each test case, we performed a structured ob-
servation as follows:
• The test person (TP) received information about
the case in a written form, describing the custo-
mer’s needs and main characteristics.
• The TP was then encouraged to enter some search
criteria to find similar historical projects. It was
then left up to the TP whether to choose a retrie-
ved historical project and adapt it or whether to
create a new empty project.
• TPs interacted with the new effort estimation sy-
stem, receiving recommendations. They were
able to accept, adapt or reject recommendations
and to e.g. mark certain projects from which re-
commendations were derived as irrelevant (see 4).
The behaviour of TPs in this phase was closely
observed; when necessary, the researcher asked
questions to understand choices or unexpected be-
haviour.
• When TPs stated that they were satisfied with the
derived estimates, a final interview was conducted
with more general questions about how they per-
ceived the help of the system.
Final estimates of TPs were compared to both the
historical estimates and the actual outcomes, using
the popular regression metrics mean absolute error
(MAE) and root mean squared error (RMSE). In ad-
dition, we also report the absolute total difference be-
tween actual and estimated effort. MAE and RMSE
use the squares of deviations – errors cannot cancel
each other out and large errors tend to have more
weight. Thus, they focus on the abilty of the whole sy-
stem to make accurate estimates on the level of jobs.
On the other hand, the absolute difference allows us
to gain insight into the absolute deviation and whether
it was positive (effort estimated too low) or negative
for the whole project.
5.2 Results and Discussion
In the following, we first present our qualitative fin-
dings from observing test persons’ reactions to the
various recommendations. We then summarise the ar-
chived accuracy of cost estimates.
We first observed that one test person (TP) from
the design area decided to create an empty project af-
ter the retrieval phase: he was not able to find a suf-
ficiently similar historical project to start from. All
other TPs did find a historical project and decided to
use it as a basis for the new one.
Table 5: Summary of test persons’ reactions to recommen-
dation R-1, comprising the starting point for the creation of
a new project as well as the number of job recommendations
accepted and the number of jobs in the final offer.
Test case starting point #jobs added final #jobs
1 empty project 2 4
2 similar project 3 4
3 similar project 1 9
4 similar project 1 9
Regarding the acceptance of R-1 recommendati-
ons, Table 5 shows that the less standardised design
project (see Section 5.1) led to the acceptance of more
recommendations (2 and 3 out of 4). In test case 1,
these were added to the empty project. In test case 2,
it turned out that many positions of the chosen similar
project were irrelevant and had to be removed, be-
fore the R-1 recommendations were added. Hence, it
might have been easier for TP2 to start from an empty
project, too.
For the more standard online project, the similar
projects chosen as a starting point contained already
most of the needed positions, which made R-1 recom-
mendations less relevant. However, both TPs confir-
med that the one position they added was meaningful
Training and Re-using Human Experience: A Recommender for More Accurate Cost Estimates in Project Planning
59

and hence having R-1 recommendations makes sense
also for this case.
A problem that we observed a few times was that
R-1 recommendations were considered irrelevant be-
cause of their wording and/or scope. For instance,
some project leads of historical projects had combi-
ned two tasks (say, e.g., A and B) in one job which
others had split into two. Thus, when e.g. a project
already contained a job for task A, the TPs would he-
sitate to accept a recommendation to add a job com-
bining A and B.
Another observation was that participants (espe-
cially the junior ones) did make use a few times of
the possibility to mark a whole project as irrelevant
to prevent R-1 recommendations based on it. They
remarked that this helped them to get better recom-
mendations.
Regarding the acceptance of R-2 recommendati-
ons, Table 6 shows, for each test case, for how many
of the job positions the test persons received a re-
commendation and how often they accepted, modified
or ignored that recommendation. In cases where no
recommendation was made, the system did not find
enough similar jobs in the case base.
Table 6: Summary of test persons’ reactions to recommen-
dation R-2: for how many job positions did test persons
accept, modify or ignore the recommendations? How often
did they not receive a recommendation?
Test case accepted modified ignored no
recom-
menda-
tion
1 1 1 0 2
2 1 1 0 2
3 0 4 3 2
4 1 4 2 2
We can see that TPs either considered the propo-
sed effort adaptations correct and followed the recom-
mendation. Or, they were not convinced – usually,
they would then look at the details, i.e. the jobs from
similar projects, to understand the recommendation
better. Often, they would conclude that only a subset
of these jobs were actually relevant and would thus
compute a final estimation as a rough average from
this subset. Hence, a feature to exclude irrelevant
items also on the job level was found to be missing.
In comparatively few cases (and only for the online
case), recommendations were completely ignored.
In most cases, the derived estimates followed the
tendency of the initial recommendation. For the de-
sign case, these tendencies turned out to be correct for
2 out of 2 recommendations, for the online case, the
tendency was correct for 5 out of 7 recommendations.
Three additional observations were made:
• Changed Jobs: The definition of some job types
had changed over time, sometimes based on ex-
plicitly communicated rules, leading to significant
adjustment of efforts. In such cases, jobs execu-
ted according to the outdated rules led to wrong
estimates. The most viable solution would be to
remove these jobs from the case base.
• Lack of Trust: we observed that estimators of-
ten adjusted recommendations because they did
not trust the system – and this often led to lower
accuracy. TPs stated that they expected trust to in-
crease when working with the system for a longer
time.
• Information Overload: while TPs were effective
in assessing the relevance of similar jobs, they
were sometimes overwhelmed by the high num-
ber of them. Since they saw that some proposed
jobs were irrelevant, they felt the need to assess
all jobs, which was sometimes too tedious. Ob-
viously, this could also be mitigated by building
more trust.
Overall, TPs found R-2 recommendations very
helpful and transparent. The possibility to gain in-
sights into the estimations of other project leads was
mentioned as a particularly positive side effect of that
transparency. Another observed advantage of trans-
parency was the fact that TPs took the time to study
similar jobs and thus did not rush to estimations wit-
hout giving them thorough consideration. Thus, trans-
parency can be argued to support human learning.
R-3 recommendations were hardly found very in-
teresting – TPs stated that they’d know quite well
whom to ask for a review. This is not surprising given
the small size of the analysed company.
Overall, i.e. across all recommendations and
tasks, we could observe that junior project leads
relied more heavily on system recommendations and
invested more time to study similar projects and jobs
to derive their estimates. They also interacted more
e.g. to remove non-similar projects and thus improve
the accuracy of system estimates.
Finally, we discuss the deviations of estimations
from the actual effort, as presented in Table 7. For
each test case, we have defined the estimates that were
originally derived (i.e. without the help of our tool) as
a baseline.
We can observe that improvements were rather
clear in the online case whereas the design case results
are inconclusive as to whether the new approach will
help to improve estimates. Making such conclusions
is anyway hardly possible with such a small sample,
KMIS 2018 - 10th International Conference on Knowledge Management and Information Sharing
60

Table 7: Summary of test persons’ estimates and their deviation from the actual effort incurred in the original project. The
baseline refers to the effort estimation that was done without tool support before the project started. Improvements over the
baseline are marked in bold.
Test case Estimated effort Total deviation MAE RMSE
1 (junior design) 40 -13 3.375 5.715
2 (senior design) 32 -21 5.250 10.132
Baseline design 41 -12 3.625 6.654
3 (junior online) 148 13 4.944 7.038
4 (senior online) 212 -14 6.333 7.741
Baseline online 81.5 -53.5 6.833 10.446
given also the fact that the deviations between all es-
timates are substantial.
What we could observe qualitatively though, but
what also shows up in the data of Table 7, is the ten-
dency of junior project leads to interact more with the
system and to trust more in it. Specifically, they in-
vested the time to remove dissimilar projects to gain
a better basis for automatically derived recommenda-
tions. In test case 3, this helped to estimate effort for
two large job positions more accurately. Senior pro-
ject leads, on the other hand, were the ones who ex-
pressed their lack of trust and hence relied less on the
system. Overall, they achieved a lower accuracy in
both cases (although the difference is rather small for
the online case).
We can thus carefully conclude that an “appropri-
ate” use of the system – which involves making use of
the possibility to examine and adapt similar projects
and jobs and then trusting the resulting recommenda-
tions – will improve estimates in the long run. Ho-
wever, this needs to be investigated more closely in
future work.
6 CONCLUSIONS
In this work, we have introduced a novel paradigm
for supporting project leads in effort estimation. Our
method supports the whole offer creation process: it
helps to find similar past projects to use as a basis for
a new project, it recommends additional jobs, helps to
adjust effort estimations of chosen jobs and suggests
knowledgeable colleagues as reviewers. The system
explains every recommendation by giving insight into
the characteristics of the underlying similar projects
and the jobs they contain. It also allows users to give
feedback by removing projects that are considered ir-
relevant. Thus, project leads can better understand
and influence the automatically derived recommenda-
tions or even just use the provided information for ma-
king their own estimates.
Our evaluation has shown that besides component
c), all recommendations were considered very helpful
by the test persons. Although they were not always
accepted, the offered explanations were heavily used
and especially junior project leads also used the pos-
sibility to remove irrelevant projects.
We were also able to conclude that, with an ap-
propriate level of trust in the system and by using
its feedback features, effort estimation is likely to be-
come more accurate and human learning will be better
supported.
We also found a few problems that deserve more
investigation in future work: for instance, we found
that recommendations of additional jobs could be pro-
blematic because of their scope overlapping with the
scope of already chosen jobs. Obviously synonyms
and ambiguous terms are a challenge for title-based
similarity estimation, which should be addressed in
the future. Furthermore, although the provided expla-
nations were considered helpful, their number someti-
mes resulted in a slight information overload – one
may have to invent a smarter way of arranging them.
Another desirable feature would be the possibility to
remove irrelevant items also on the job level. Finally,
another issue that we consciously excluded from our
study, but which deserves attention in the future is the
role that the different possible expertise levels of pro-
ject members may play in deriving accurate estimates.
Overall, we found that, even despite the system’s
transparency, especially senior project leads exhibited
a lack of trust in the system (which resulted in less
accurate estimates), but stated that this might grow
over time. Therefore, a more long-term evaluation of
productive use of the system shall be performed in the
future.
REFERENCES
Aamodt, A. and Plaza, E. (1994). Case-based reasoning:
Foundational issues, methodological variations, and
system approaches. AI communications, 7(1):39–59.
Bergmann, R., Althoff, K.-D. K., Minor, M., Reichle, M.,
and Bach, K. (2009). Case-Based Reasoning - In-
troduction and Recent Developments. K
¨
unstliche In-
telligenz: Special Issue on Case-Based Reasoning,
23(1):5–11.
Boehm, B., Abts, C., and Chulani, S. (2000). Software de-
Training and Re-using Human Experience: A Recommender for More Accurate Cost Estimates in Project Planning
61

velopment cost estimation approachesA survey. An-
nals of Software Engineering, 10(1-4):177–205.
Boehm, B. W. (1984). Software Engineering Econo-
mics. IEEE Transactions on Software Engineering,
SE-10(1):4–21.
Chulani, S., Boehm, B. W., and Steece, B. (1999). Baye-
sian Analysis of Empirical Software Engineering Cost
Models. IEEE Transactions on Software Engineering,
25(4):573–583.
Garc
´
ıa-Floriano, A., L
´
opez-Mart
´
ın, C., Y
´
a
˜
nez-M
´
arquez, C.,
and Abran, A. (2018). Support vector regression for
predicting software enhancement effort. Information
and Software Technology, 97:99–109.
Joachims, T. (1996). A Probabilistic Analysis of the Roc-
chio Algorithm with TFIDF for Text Categorization.
Technical report, Carnegie-mellon univ pittsburgh pa
dept of computer science.
Jorgensen, M. (2005). Practical guidelines for expert-
judgment-based software effort estimation. IEEE soft-
ware, 22(3):57–63.
Kolodner, J. L. (1993). Case-based reasoning. Morgan
Kaufmann Publishers, San Mateo, CA.
Leake, D. B. (1996). CBR in Context: The Present and Fu-
ture. In Leake, D. B., editor, Case-Based Reasoning:
Experiences, Lessons, and Future Directions, pages
1–35. AAAI Press/MIT Press, Menlo Park.
Leung, H. (2002). Estimating maintenance effort by ana-
logy. Empirical Software Engineering, 7(2):157–175.
Li, J., Ruhe, G., Al-Emran, A., and Richter, M. M. (2007).
A flexible method for software effort estimation by
analogy. Empirical Software Engineering, 12(1):65–
106.
Madhusudan, T., Zhao, J., and Marshall, B. (2004). A
case-based reasoning framework for workflow mo-
del management. Data & Knowledge Engineering,
50(1):87–115.
Martin, A., Emmenegger, S., Hinkelmann, K., and
Th
¨
onssen, B. (2016). A viewpoint-based case-based
reasoning approach utilising an enterprise architecture
ontology for experience management. Enterprise In-
formation Systems, pages 1–25.
Martin, A. and Hinkelmann, K. (2018). Case-Based Reaso-
ning for Process Experience, pages 47–63. Springer
International Publishing, Cham.
Moløkken-Østvold, K. and Jørgensen, M. (2003). A review
of software surveys on software effort estimation. In
Empirical Software Engineering, 2003. ISESE 2003.
Proceedings. 2003 International Symposium on, num-
ber 1325, pages 223–230. IEEE.
Moores, T. T. and Edwards, J. S. (1992). Could large UK
corporations and computing companies use software
cost estimating tools? - A survey. European Journal
of Information Systems, 1(5):311–320.
Oliveira, A. L. (2006). Estimation of software project ef-
fort with support vector regression. Neurocomputing,
69(13-15):1749–1753.
Robertson, S. E., Walker, S., Jones, S., Hancock-Beaulieu,
M. M., Gatford, M., and Others (1995). Okapi at
TREC-3. Nist Special Publication Sp, 109:109.
Ruhe, M., Jeffery, R., and Wieczorek, I. (2003). Cost esti-
mation for web applications. In Software Engineering,
2003. Proceedings. 25th International Conference on,
volume 6, pages 285–294. IEEE.
Shaughnessy, J. J., Zechmeister, E. B., and Zechmeister,
J. S. (2012). Research Methods in Psychology.
Shepperd, M. and Schofield, C. (1997). Estimating software
project effort using analogies. IEEE Transactions on
software engineering, 23(11):736–743.
ˇ
Stolfa, J., Kob
ˇ
ersk\‘y, O., Kr
¨
omer, P.,
ˇ
Stolfa, S., Kopka,
M., and Sn
´
a
ˇ
sel, V. (2013). Comparison of fuzzy ru-
les and SVM approach to the value estimation of the
use case parameters. In IFSA World Congress and NA-
FIPS Annual Meeting (IFSA/NAFIPS), 2013 Joint, vo-
lume 237, pages 789–794. IEEE.
Vaishnavi, V. and Kuechler, B. (2004). Design Science Re-
search in Information Systems Overview of Design
Science Research. Ais, page 45.
Walkerden, F. and Jeffery, R. (1999). An empirical study of
analogy-based software effort estimation. Empirical
software engineering, 4(2):135–158.
Watson, I. (1999). Case-based reasoning is a methodology
not a technology. Knowledge-Based Systems, 12(5-
6):303–308.
KMIS 2018 - 10th International Conference on Knowledge Management and Information Sharing
62
