
Evaluation Platform for Artificial Intelligence Algorithms
Zoltan Czako, Gheorghe Sebestyen and Anca Hangan
Department of Computer Science, Technical University of Cluj-Napoca, Romania
Keywords:
Artificial Intelligence Algorithms, Evaluation Platform, Methodology.
Abstract:
Currently, artificial intelligence (AI) algorithms have been receiving a lot of attention from researchers as well
as from commercial product developers. Hundreds of different AI algorithms aiming different kind of real-life
problems have qualitatively different results, based on the nature of data, the nature of the problems and based
on the context in which they are used. Choosing the most appropriate algorithm to solve a particular problem
is not a trivial task. The goal of our research is to create a platform, which can be used in the early stage of
problem solving. With this platform, the user could be able to quickly train, test and evaluate several artificial
intelligence algorithms and also they will be able to find out which is the algorithm that performs best for a
specific problem. Moreover, this platform will help developers to tune the parameters of the chosen algorithm
in order to get better results on their problem. We will demonstrate our approach by running different types
of algorithms initially in the case of breast cancer sample dataset and after that we will use the platform for
solving an anomaly detection problem.
1 INTRODUCTION
In the last decade, because of some new data acquisi-
tion technologies (e.g. sensor networks, IoT, Industry
4.0) and the wide spread of Internet-based applica-
tions, huge amount of data is becoming available. Ef-
ficient and higher level processing of such "big data"
requires intelligent algorithms, not just for academic
purposes, but also for real software products. More
and more companies are trying to use artificial in-
telligence to solve complex problems, which earlier
required a human expert. The hardest thing in en-
terprise applications using artificial intelligence is to
estimate the time needed to create a minimum viable
product. The difficulty of the estimation arise from
the fact that before starting the project it is very hard
to know exactly which of the algorithms will be the
best match for that particular problem and for that par-
ticular dataset.
Algorithms can have very different and surpris-
ing results based on the nature of the problem and
the nature of the training data. A good approach to
overcome this difficulty is to get a small part of the
dataset, implement multiple artificial intelligence re-
lated algorithms and benchmark those algorithms us-
ing the small sample dataset. This can be a very time
consuming process and usually for enterprise prod-
ucts you don’t have such time. Our intention is to
create a platform which can be used to test multiple
algorithms and evaluate them using appropriate met-
rics, this way reducing the time to production.
Another problem which usually occur is the tidi-
ness of data. Raw data can have multiple problems
(e.g. noise, sample misses, etc.), which occur be-
cause of bugs in the data collecting process. Prepro-
cessing of the data can be a challenging task, which
may require multiple subsequent tasks; therefore our
platform contains a set of preprocessing algorithms
which can be applied by a domain specialist, with-
out specific programming knowledge. The data can
also be visualized in multiple way (2D-3D charts, his-
tograms, FFT, etc.), which can help spotting problems
within the raw data. Another important aspect of AI
algorithms is that someone can combine multiple al-
gorithms to improve the quality of the results. In order
to combine different algorithms the platform should
offer the possibility to pipeline the partial results in a
reconfigurable manner.
As a practical result, in the following sections we
will describe our platform, which can be used to eval-
uate different AI techniques with different types of
datasets, configuring the most effective pipeline in
different contexts. We will show results obtained with
different algorithms with and without preprocessing,
showing in this way the effectiveness of the prepro-
cessing step. We will tune and evaluate multiple algo-
Czako, Z., Sebestyen, G. and Hangan, A.
Evaluation Platform for Artificial Intelligence Algorithms.
DOI: 10.5220/0006888900390046
In Proceedings of the 10th International Joint Conference on Computational Intelligence (IJCCI 2018), pages 39-46
ISBN: 978-989-758-327-8
Copyright © 2018 by SCITEPRESS – Science and Technology Publications, Lda. All rights reserved
39

rithms and the results will be compared. So the pur-
pose of this article is to describe a platform that allows
a user to select, tune and pipeline multiple AI algo-
rithms as well as preprocessing and displaying tasks.
All these operations may be done without writing any
code and without programming skills. This tool is
very useful in the early stage of a project when the
feasibility of a given approach must be measured or
decided. The tool will give an estimate of the qual-
ity level that may be obtain using different AI algo-
rithms. This will reduce the time to production and
it will increase the chance for a successful implemen-
tation. Furthermore, we will introduce a step-by-step
process for choosing the right sequence of algorithms.
The rest of the paper is organized as follows. Sec-
tion 2 shows a brief description of related works. Sec-
tion 3 contains the theoretical classification of differ-
ent algorithms and the decision tree which can be used
to choose the proper algorithm for a given problem.
The architecture of the platform is described in Sec-
tion 4. Experiments can be found in Section 5 and
Section 6 concludes the article.
2 RELATED WORK
Choosing the best algorithm for a specific problem
domain, taking into consideration multiple factors
(e.g. the type of the data involved, the nature of the
problem etc.) is a general problem in developing in-
telligent products. There are multiple articles which
are trying to classify AI algorithms, based on different
points of view.
In (Dasgupta and Nath, 2016) we can find a typical
classification of machine learn algorithms, based on
the nature of the training data as follows:
- supervised, if the training data is labeled;
- unsupervised, if there are no labels;
- semi-supervised, if some of the class labels are
missing.
The problem with this classification is the fact that
it considers only the nature of the training data, with-
out taking in consideration the context of the problem.
This approach reduces the searching space, but each
class has too many algorithms to be considered, tested
and evaluated. Other articles describes specific prob-
lems, but only in the context of classification (Ilias
et al., 2007), regression (Gulden and Nese, 2013) or
only in case of one specific algorithm. There are lots
of articles focusing on a specific problem and only
one specific algorithm to resolve that problem. For
example, in the case of anomaly detection, there are
a plenty of articles discussing different scenarios and
comparing results of different algorithms.
In (Zareapoor et al., 2012) the authors make a
comprehensive evaluation of the most popular algo-
rithms used in the context of credit card fraud detec-
tion. This article contains a brief description of al-
gorithms like Bayesian Networks, Neural Networks,
SVM, etc. and at the end of the article there is a ta-
ble comparing the results, using metrics like accuracy,
speed and cost. Other types of articles has a differ-
ent approach, creating a survey of all the algorithms
which can be used for a specific problem.
In (Varun et al., 2009) there is a survey of all the
algorithms which can be used to effectively detect
anomalies. This article doesn’t narrow down its view
to only supervised or only unsupervised algorithms.
On the contrary, the authors describe an extensive list
of algorithms, which can be used in a larger context,
in anomaly detection. There are plenty of research pa-
pers comparing two or more different algorithms, as
in (Juan et al., 2004) (Murad et al., 2013) (Agrawal
and Agrawal, 2016) (Gupta et al., 2014).
The papers mentioned above were trying to help
engineers in finding the best algorithm for specific
problems, but none of them managed to create a step-
by-step process, a useful methodology on how to
choose the right algorithm for any type of problem
and any type of dataset. In this paper we will pro-
pose a step-by-step methodology that can be applied
to choose an algorithm. Moreover we will present our
platform, which can be used in order to evaluate the
chosen algorithms.
3 THE PROPOSED
METHODOLOGY FOR
CHOOSING AI ALGORITHMS
There are no universally good or bad algorithms, each
algorithm is specific to a context, a problem or a type
of dataset. This idea was demonstrated by David H.
Wolpert and William G. Macready in (Wolpert and
Macready, 1997) in the so called "No Free Lunch
Theorems for Optimization". The NFLT are a set of
mathematical proofs and general framework that ex-
plores the connection between general-purpose algo-
rithms that are considered “black-box” and the prob-
lems they solve. This states that any algorithm that
searches for an optimal cost or fitness solution is not
universally superior to any other algorithm. Wolpert
and Macready wrote in their paper that "If an algo-
rithm performs better than random search on some
class of problems then it must perform worse than
random search on the remaining problems."
In the real world, we need to decide on engineer-
IJCCI 2018 - 10th International Joint Conference on Computational Intelligence
40
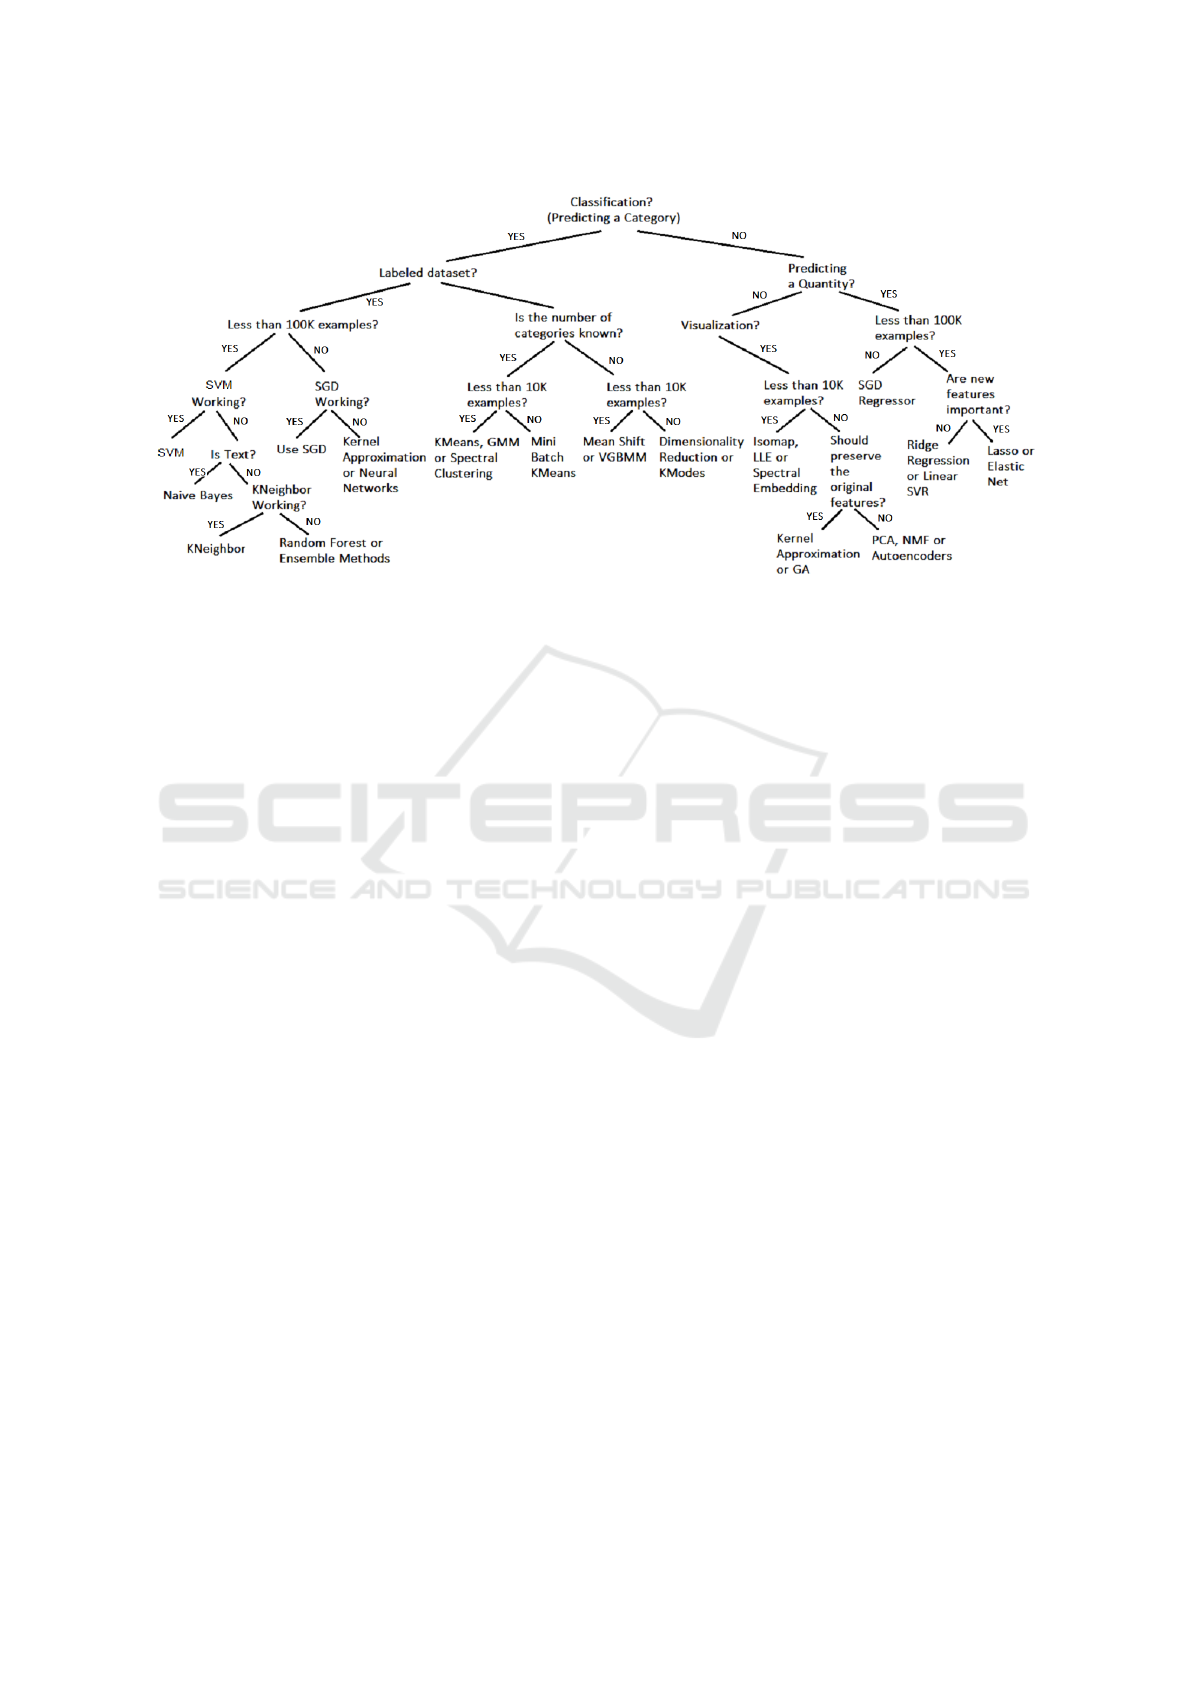
Figure 1: Algorithm Selection Decision Tree.
ing solutions to build practical models that solve real
problems. For certain pattern recognition problems,
we tend to find that certain algorithms perform better
than others which is a consequence of the algorithm's
fitness or cost function fit to the particular problem.
For our particular given problem, in order to find the
best algorithm, NFLT should remind us that we need
to focus on the particular problem at hand, the as-
sumptions, the priors (extra information), the data and
the cost.
What the NFLT is trying to tell us is, we are gener-
ally not going to find off the shelf algorithms that fits
perfectly to our data. We have to architect the algo-
rithm to better fit the data. This means that there are
no universally applicable algorithms, so in order to
find optimized solutions, we must have a methodol-
ogy to architect our model. Figure 1 shows a decision
tree to help engineers in choosing the right algorithm
based on the problem context and the nature of the
data.
Based on Figure 1 the first step in choosing the
appropriate AI algorithm is to determine the nature of
the problem, establish the goal, what do we want to
obtain. Based on this, the algorithms can be grouped
in three categories: Classification, Clustering, Predic-
tion or Visualization (or Dimensionality Reduction).
After defining the nature of the problem, the next step
is to focus on the nature of the training data. In this
case we should ask questions about the dimension of
the available training data, whether the dataset has la-
bels or not or questions about the importance of the
features, can we transform the features to get more
relevant ones or should we keep the original features.
Answering these questions can spectacularly reduce
the search space, in some cases resulting in only one
algorithm, this way making the developer’s job much
easier. These questions are very important, because
for example, if we don’t have enough examples in the
training set (Less than 100K), then Neural Networks
can have poor results and linear SVC can do a better
job. As another example, if the features are important,
so we should preserve the original values, then PCA is
not a good choice, because this algorithm modifies the
features, using orthogonal transformation, so a better
choice would be Kernel Approximation or GA.
4 ARCHITECTURE OF OUR
PLATFORM
The platform developed by our team is meant to offer
a pragmatic tool for specialists involved in some kind
of artificial intelligence related projects. This tool is
not meant as a final solution but as a starting point
in the process of finding the best method that fits the
quality and efficiency criteria of a given application
domain. Therefore the platform contains those basic
functionalities that allows a specialist to collect, pro-
cess with AI algorithms and visualize data. Although
the platform was meant for general use, most of our
experiments were performed in the area of anomaly
and outlier detection in big datasets. Here are the
functionalities we considered necessary for such a
platform:
• Data harvesting tools - that allows acquisition of
data from a variety of datasets having different
formats (Excel, CSV, ARFF) or from different
physical sources (sensor networks, smart devices,
IoT); a special treatment is given to real-time data
Evaluation Platform for Artificial Intelligence Algorithms
41
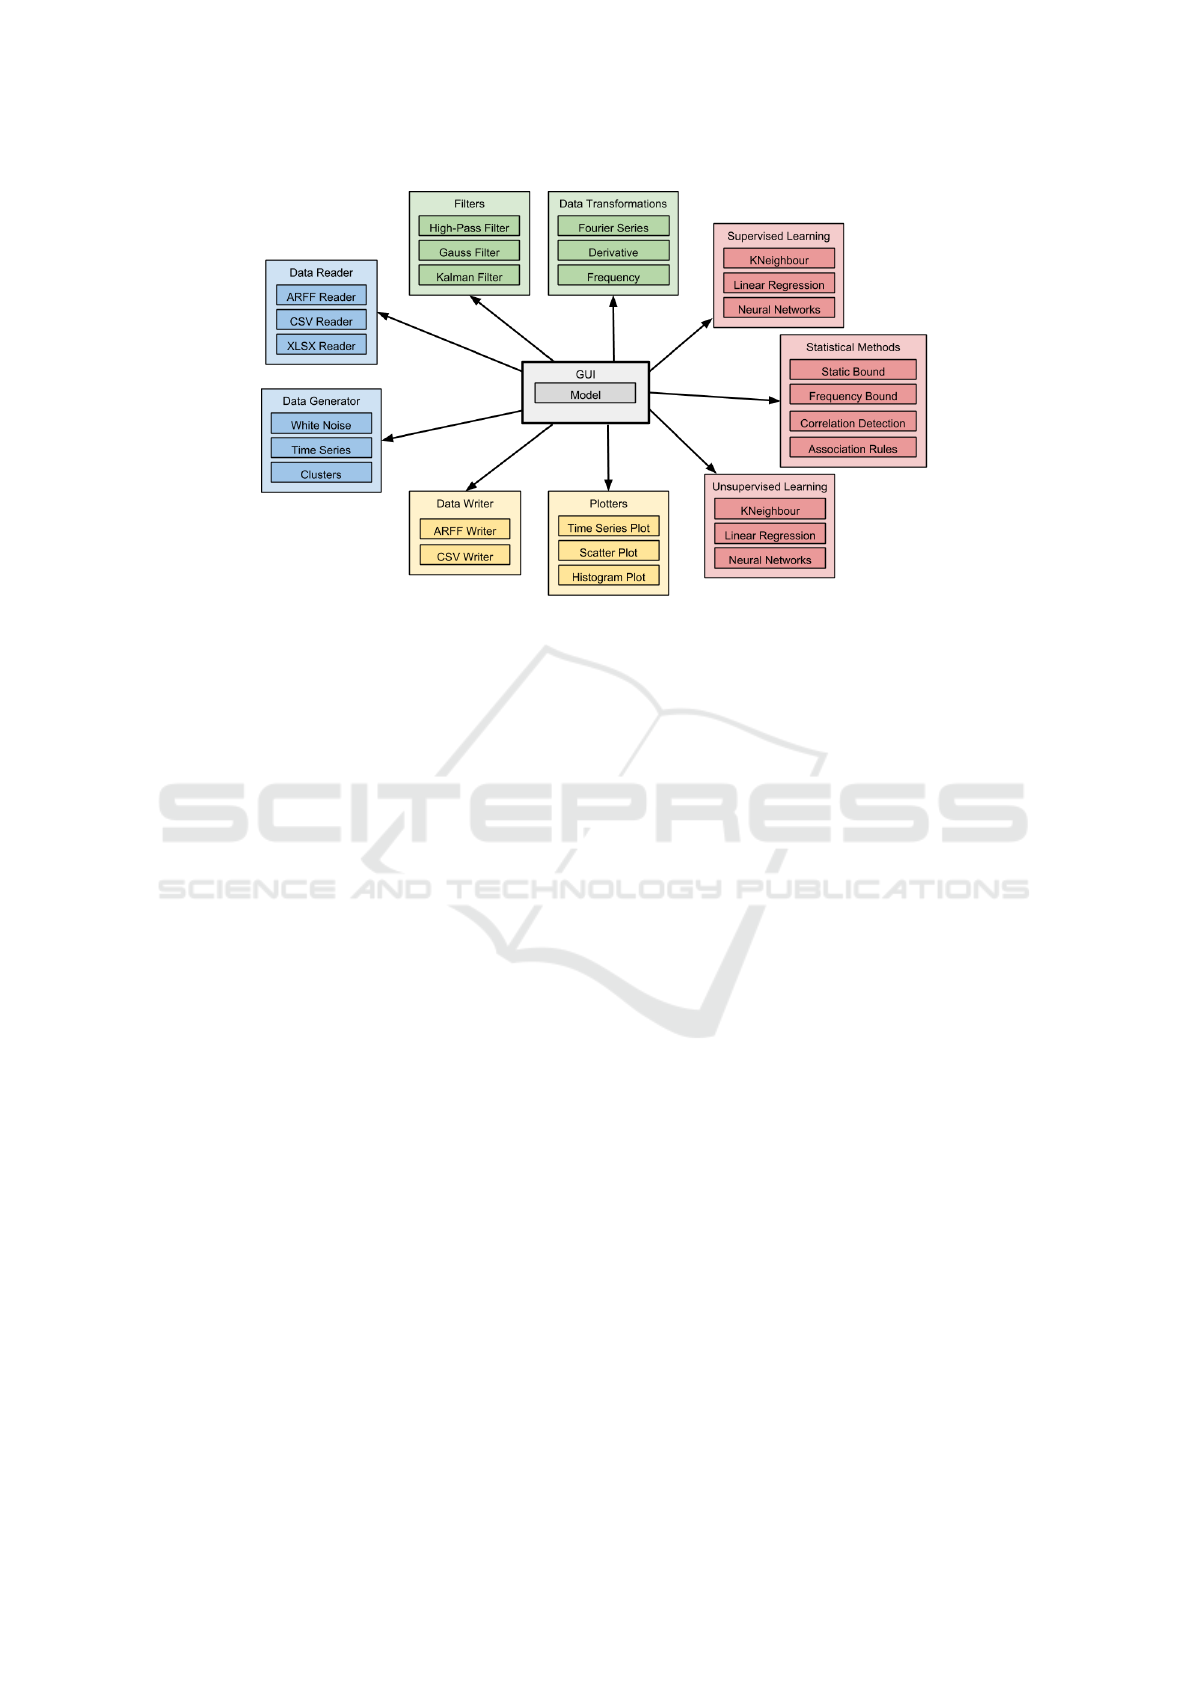
Figure 2: Application Diagram.
collections and datasets containing anomalies;
• Data preprocessing tools - instruments meant to
transform the raw data into a noise free and nor-
malized data; typical methods included in this cat-
egory are: parameterized filters, transforms (e.g.
FFT, wavelet) or histograms; there are also meth-
ods for determining some statistical parameters of
the input data such as: min-max, median value,
standard deviation, etc.
• Artificial Intelligence algorithms - a wide group
of methods that try to cover the most representa-
tive nodes of the presented taxonomy; our goal
is to offer a rich set of possibilities from were to
choose and compare; the open nature of the plat-
form allows new methods to be added to the ex-
isting library; methods can be tested without pro-
gramming knowledge, because the platform offers
an easy to use user interface.
• Visualization tools - very important in the pro-
cess of finding the best artificial intelligence meth-
ods because they offer a bi-dimensional represen-
tation of otherwise multidimensional data, much
easier to understand for the human eye;
• Generators of datasets and artificial signals - nec-
essary in the process of validating or measur-
ing the quality of some new artificial intelligence
methods; special techniques are applied in order
to combine "normal" data with artificially created
anomalies.
The tools mentioned above are integrated into an
open architecture platform allowing continuous ex-
tension with new methods. A unique internal pre-
defined data format assures interoperability and inter-
changeability between the existing tools and function-
alities.
The high level overview of the included function-
alities is shown in Figure 2.
To create a more complex model, using multiple
preprocessing techniques and/or multiple artificial in-
telligence algorithms, the platform supports creation
of a pipeline. Each step of the pipeline is saved in
.csv files, so the results of each step can be used sep-
arately. This way the pipeline is highly configurable,
it can have multiple steps, some steps can be skipped,
reordered or reused. Figure 3 shows a high level view
of the pipeline, where steps can be reconfigured, re-
placed, skipped or reordered.
The most important library used to create this plat-
form is (SciKit-Learn, 2017). Similar tool is Weka
(Weka, 1997)
5 EXPERIMENTS
The purpose of this section is to show through some
examples the usage possibilities of the artificial intel-
ligence platform. Here we emphasize two aspects:
the possibility to choose between different anomaly
detection techniques and the ability to tune the pa-
rameters of a given method in order to obtain better
results.
5.1 Experiments using the Breast
Cancer Dataset
The next experiments were made on the same dataset
that reflects information related to breast cancer
IJCCI 2018 - 10th International Joint Conference on Computational Intelligence
42
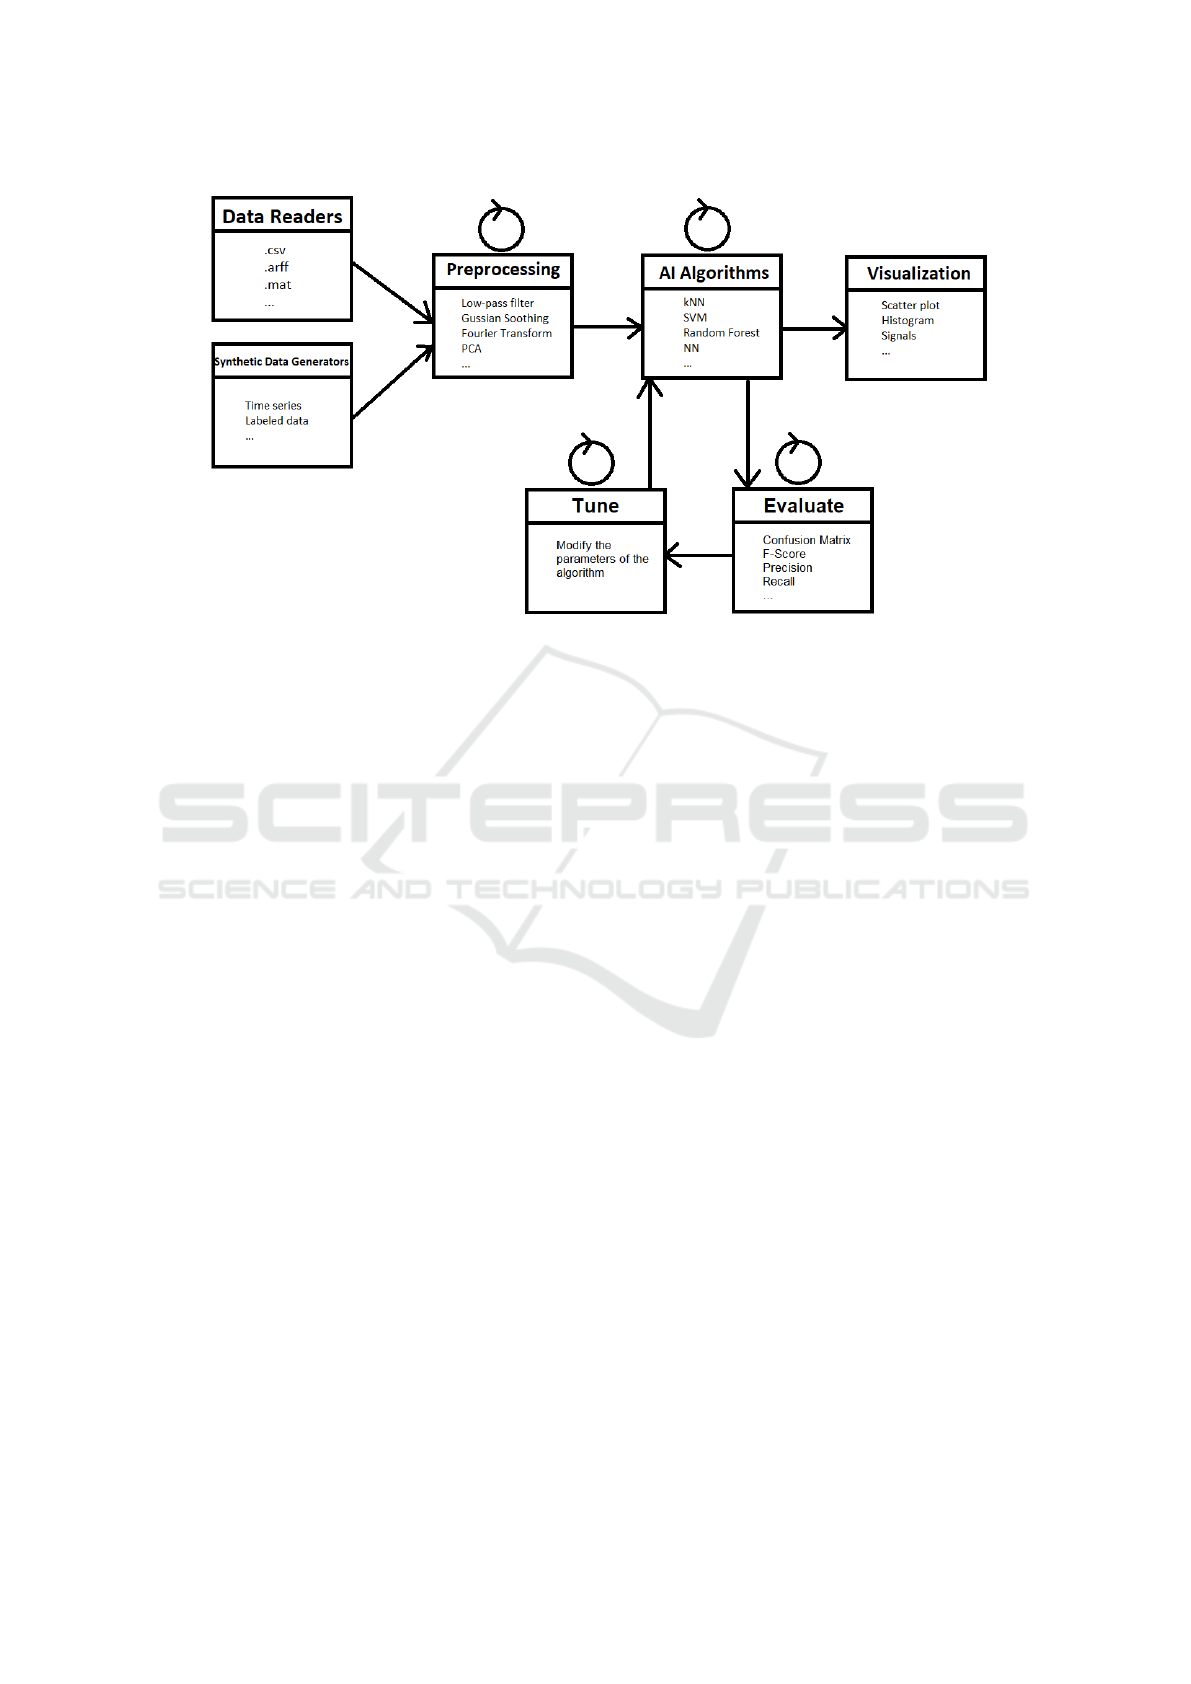
Figure 3: Overview of the pipeline.
(Lichman, 2013). This dataset contains 569 data
points and each data point has 32 attributes. The
dataset was labeled showing normal (e.g. benign) and
abnormal (e.g. malign) data points. A part of the
dataset was used in the training (learning) phase and
the rest in the testing phase.
The next figures show how our platform can be
used by someone that has no programming knowl-
edge, only by choosing the options in the graphical
user interface.
The first step is to load our dataset. At the begin-
ning we select a given AI algorithm that can classify
data in benign and malign samples. Our first choice is
the SVM (support vector machine) algorithm. In the
next step we will configure and train our SVM model
using the loaded dataset, without preprocessing of the
data. In the case of the SVM, we can configure the C
parameter, which stands for penalty parameter of the
error term, the value of gamma, which is the kernel
coefficient for rbf, poly and sigmoid and the kernel
type to be used in the algorithm. It must be one of lin-
ear, poly, rbf or sigmoid. Next step of the process is
to evaluate the trained model. The result of the eval-
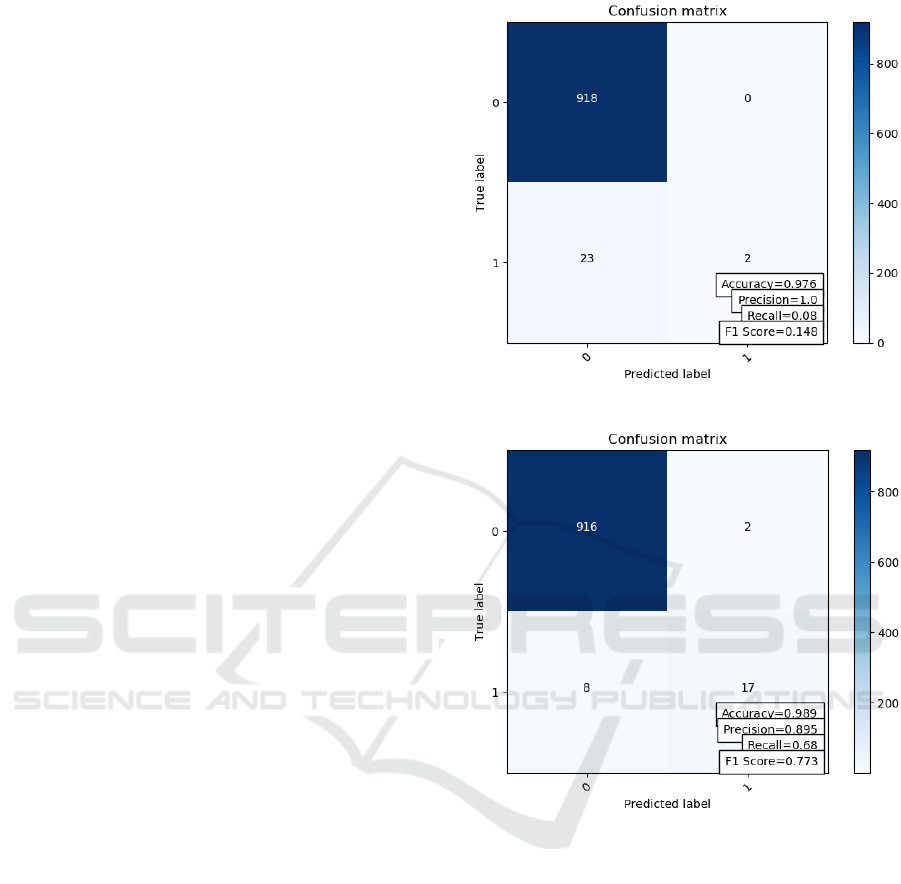
uation is shown in Figure 4. As we can see in this
table, the scores of this model are not very promising,
which is caused by the fact that no preprocessing was
made.
In the last step we apply Min-Max scaler as a
preprocessing algorithm and the configuration of the
SVM model remains the same. From Figure 4 we can
clearly see the effect of applying the correct prepro-
cessing algorithm, the increase in the model’s scores
are spectacular. This demonstrates the importance of
understanding our training dataset and the importance
of using proper algorithms not just for classification,
but also for preprocessing.
This process can be repeated using other types of
algorithms, distance based, density based, hierarchi-
cal or even using neural networks. The following fig-
ures shows the usage of other algorithms.
In the case of KNN you can choose the number
of neighbor nodes, the algorithm used to compute the
nearest neighbors, the weight function used in pre-
diction and the distance metric to use for the tree.
The default metric is Minkowski, and with power=2
is equivalent to the standard Euclidean metric. Figure
4 shows the results in a table.
We can use the platform to configure more diffi-
cult models, like Neural Networks. Configuring the
Neural Network model means that you can set the
Alpha value or the L2 penalty (regularization term)
parameter, set the solver for weight optimization (al-
gorithm), choose the correct activation function, set
the number of the hidden layer and the number of the
nodes for the hidden layers. Figure 4 shows the results
of the model as a confusion matrix.
In other cases, if you are not interested in the con-
fusion matrix, but you want to run the training and
the evaluation multiple times to see how does the al-
gorithm behave, you can do it easily, using only the
UI, with no programming knowledge.
To demonstrate this functionality, we ran the train-
ing and evaluation process 14 times. The accuracy
diagram for this training and evaluation loop can be
seen in Figure 5
To configure the Random Forest algorithm to be
Evaluation Platform for Artificial Intelligence Algorithms
43
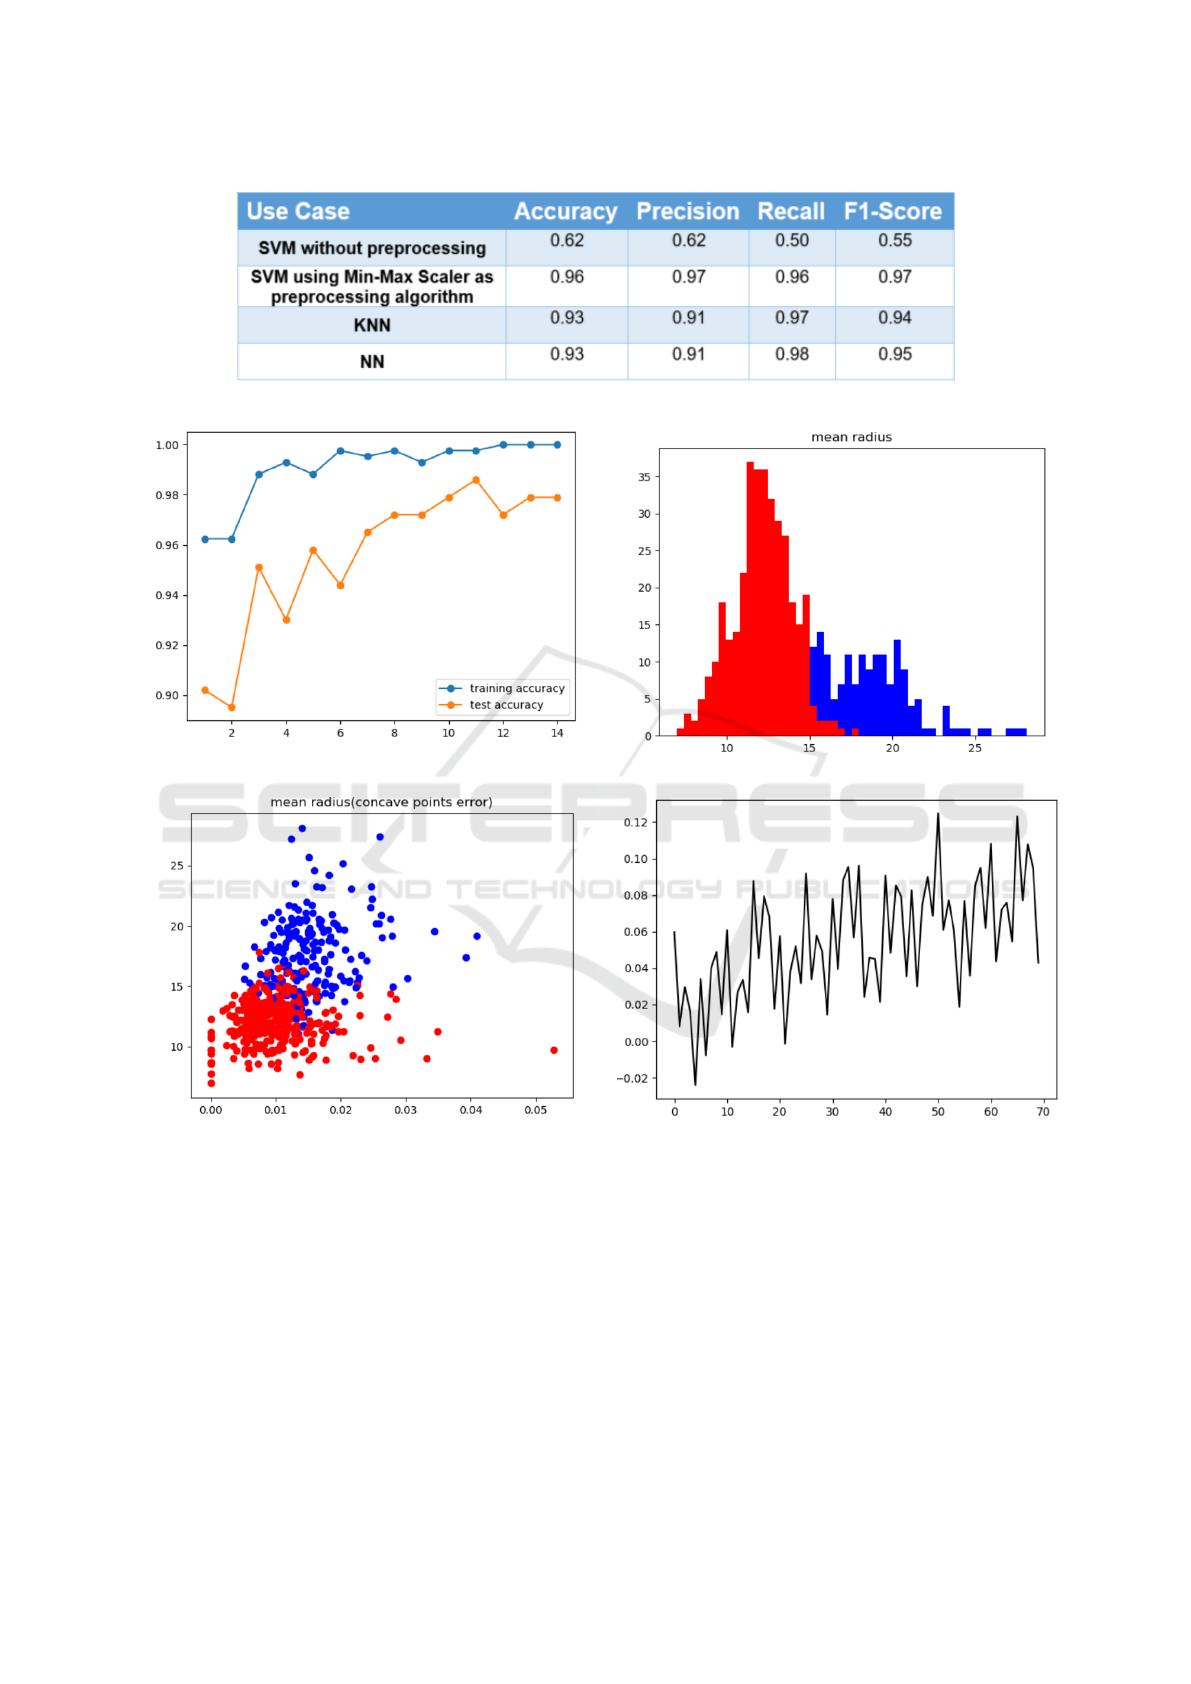
Figure 4: Evaluation of the different algorithms.
Figure 5: Evaluation of the Random Forest model in a loop.
Figure 6: Scatter Plot.
evaluated it in a loop you can set the maximum num-
ber of evaluators (decision trees), choose the slicing
method, configure a cutoff depth if needed and de-
fine the step size (the number of estimators will be
increased with the step size in each step). Figure 5
contains a digram which shows the accuracy of the
model in each step. This is very useful when you al-
ready know which algorithm do you want to use and
you want to find the most optimal parameters to train
the model with.
On the visualization part, we can see our data in a
scatter plot (Figure 6), as a histogram (Figure 7) or as
Figure 7: Histogram.
Figure 8: Time Series.
time series (Figure 8), depending on the nature of the
data.
As future development we aim to add some al-
gorithms for visualization and dimensionality reduc-
tion (like PCA) and some preprocessing algorithms
to cover most of the techniques and algorithms that a
general purpose platform should offer.
IJCCI 2018 - 10th International Joint Conference on Computational Intelligence
44
5.2 Using the Proposed Methodology
for Choosing Algorithms in the
Context of Anomaly Detection
Anomaly detection finds data points that do not fit
well with the rest of the data. It has a wide range
of applications such as fraud detection, surveillance,
diagnosis, data cleanup, and predictive maintenance.
Lets consider Thyroid Disease dataset, which has
3772 training instances and 3428 testing instances. It
has 15 categorical and 6 real attributes. The problem
is to determine whether a patient referred to the clinic
is hypothyroid. Therefore three classes are built: nor-
mal (not hypothyroid), hyper function and subnormal
functioning. For outlier detection, 3772 training in-
stances are used, with only 6 real attributes. The hy-
per function class is treated as outlier class and other
two classes are inliers, because hyper function is a
clear minority class.
To find the appropriate algorithm for this particu-
lar dataset, the first question is about the nature of the
problem. Because it is clear that we have a classifica-
tion problem (classify examples as outliers or inliers),
we can reduce the search space and go to the next step,
to analyze the nature of the data. As we specified in
the description of the thyroid disease dataset, we have
labeled data, so we can step further and analyze the
dimension of our dataset. The dataset contains 3772
instances, which is less than 100K, so we can try out
the SVM algorithm.
After we found the appropriate algorithm, the next
step is to use our platform to minimize the error and
to maximize the precision, recall, accuracy and other
evaluation results. We run the algorithm multiple
times. Firstly we used C=1 and Gamma=0.1 with rbf
kernel. Figure 9 shows the results of the experiment.
The results are not too promising, because having a
really small recall much of the outliers are omitted.
In the next step we increased both C and Gamma,
which gave us a much better result, as we can see in
Figure 10. From 0.08 we increased the recall to 0.6.
Even if the precision has dropped, the overall result is
much higher, the model behaves much better.
As we keep increasing the values of C and
Gamma, we are getting better and better results until
we reach a threshold, when the model starts to over-
fit. The best results we obtained using C=100 and
Gamma=10 (see Figure 11)
In this case we still have a choice to make. Are
the results good enough for our problem or should we
test other algorithms too. If the answer is yes, then we
can stop and use the SVM to solve our problem. If the
answer is no, then we can still choose from plenty of
algorithms. As we can see in the algorithm selection
Figure 9: SVM with C=1 and Gamma=0.1.
Figure 10: SVM with C=10 and Gamma=1.
tree (Figure 1) the next question is whether our data
is text or not. In our case we don’t have to deal with
text, so we can choose between KNeighbors, Random
Forest or we can use Ensemble Methods.
With this example for using our algorithm selec-
tion tree, we demonstrated the benefits of our algo-
rithm selection methodology and the usefulness of our
platform in finding the correct parameters for the cho-
sen algorithm. This experiment clearly shows how
can we reduce the search space when a developer
have to choose between algorithms, this way increas-
ing productivity and velocity of the developers and
implicitly decreasing the time to production and also
the costs of the project.
Evaluation Platform for Artificial Intelligence Algorithms
45
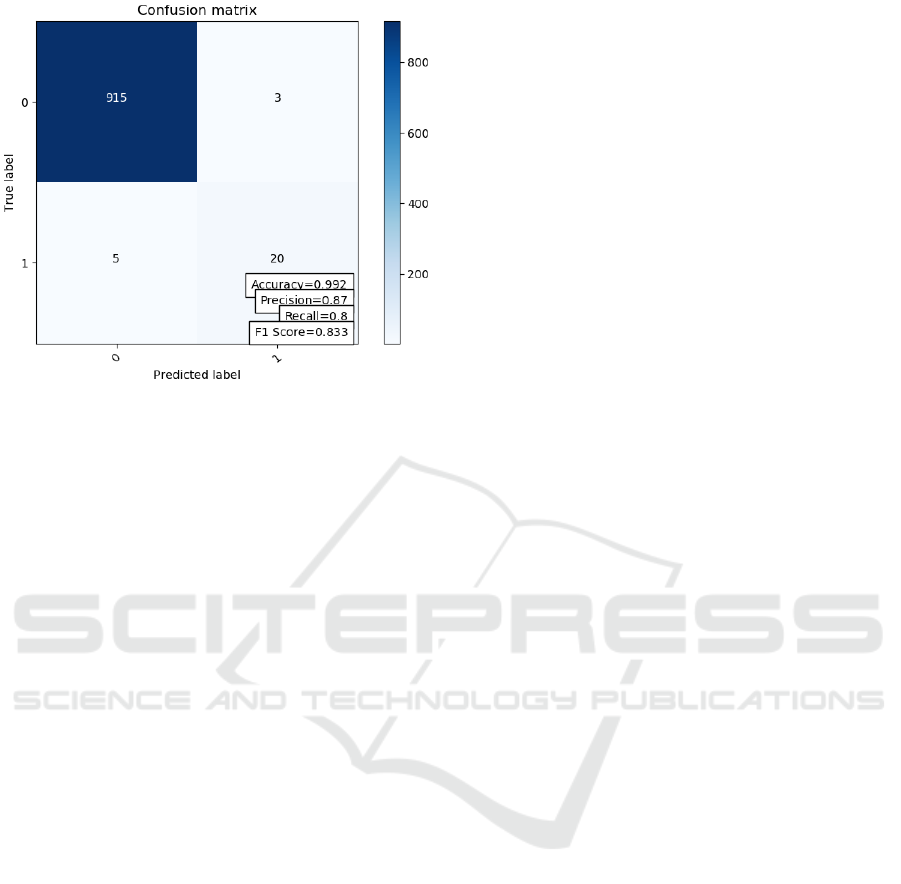
Figure 11: SVM with C=100 and Gamma=10.
6 CONCLUSIONS
The methodology and decision tree for choosing the
proper algorithm based on the problem context and
the nature of the data tries to show a coherent way
allowing a developer to select the best methods that
fits the requirements of a given application. This
taxonomy was used as a theoretical background for
the development of a platform that incorporate differ-
ent artificial intelligence and data preprocessing tech-
niques.
The platform implements the main functionalities
needed by a developer in the process of finding the
best strategy for a given domain that assure high qual-
ity problem solving in a reasonable execution time,
increasing the productivity of the developers, increas-
ing the probability of success and decreasing the costs
and risk. It includes multiple data acquisition, pre-
processing, anomaly detection and visualization func-
tionalities that may be combined in a specific process-
ing flow.
Every individual functionality is implemented as
an autonomous service and multiple services may be
orchestrated in a logical flow in order to obtain the
final results. The richest group of functionalities is
the one that contains the artificial intelligence meth-
ods. Here we tried to cover most of the develop-
ment directions present today in the scientific liter-
ature, from statistical methods, towards, signal pro-
cessing and neural networks. In this way the platform
can be used as a training tool for those who must de-
velop different solutions in different areas. For the
same learning purposes we included a multitude of
datasets that cover a diversity of application domains.
The experimental part of the paper demonstrates
some of the functionalities of the platform, including
the possibility to compare the result obtained with dif-
ferent methods, to run the training and evaluation pro-
cess multiple times and to visualize the data and the
results in a meaningful way.
REFERENCES
Agrawal, S. and Agrawal, J. (2016). Survey on anomaly
detection using data mining techniques. In 19th Inter-
national Conference on Knowledge Based and Intelli-
gent Information and Engineering Systems. Elsevier.
Dasgupta, A. and Nath, A. (2016). Classification of ma-
chine learning algorithms. In International Journal
of Innovative Research in Advanced Engineering, vol-
ume 3. IJIRAE.
Gulden, K. U. and Nese, G. (2013). A study on multiple
linear regression analysis. 106.
Gupta, M., Gao, J., Aggarwal, C. C., and Han, J. (2014).
Outlier detection for temporal data: A survey. In IEEE
Transactions on Knowledge and Data Engineering,
volume 25. IEEE Xplore.
Ilias, M., Kostas, K., Manolis, W., and John, S., edi-
tors (2007). Proceedings of the 2007 Conference
on Emerging Artificial Intelligence Applications in
Computer Engineering: Real Word AI Systems with
Applications in eHealth, HCI, Information Retrieval
and Pervasive Technologies, Amsterdam, The Nether-
lands, The Netherlands. IOS Press.
Juan, E.-T., Pedro, G.-T., and Jesus, D.-V. (2004). Anomaly
detection methods in wired networks: A survey and
taxonomy. Comput. Commun., 27(16):1569–1584.
Lichman (2013). Uci machine learning repository.
Murad, R., Anazida, Z., and Mohd, M. (2013). Advance-
ments of data anomaly detection research in wire-
less sensor networks: A survey and open issues.
13:10087–10122.
SciKit-Learn (2017). //scikit-learn.org/stable/.
Varun, C., Arindam, B., and Vipin, K. (2009). Anomaly
detection: A survey. ACM Computing Surveys,
41(3):15:1–15:58.
Weka (1997). //weka.wikispaces.com/.
Wolpert, D. H. and Macready, W. G. (1997). No free lunch
theorems for optimization. In IEEE Transactions on
Evolutionary Computation, volume 1. IEEE Xplore.
Zareapoor, M., Seeja.k.r, and Alam, M. A. (2012). Analy-
sis on credit card fraud detection techniques: Based on
certain design criteria. International Journal of Com-
puter Applications, 52(3):35–42.
IJCCI 2018 - 10th International Joint Conference on Computational Intelligence
46
