
Enhancing Open Data Knowledge by Extracting Tabular Data from Text
Images
Andrei Puha, Octavian Rinciog and Vlad Posea
Politehnica University of Bucharest, Romania
Keywords:
Open Data, Image Processing, OCR.
Abstract:
Open data published by public institutions are one of the most important resources available online. Using
this public information, decision makers can improve the lives of citizens. Unfortunately, most of the times
these open data are published as files, some of them not being easily processable such as scanned pdf files.
In this paper we present an algorithm which enhances nowadays knowledge by extracting tabular data from
scanned pdf documents in an efficient way. The proposed workflow consists of several distinct steps: first
the pdf documents are converted into images, subsequently images are preprocessed using specific processing
techniques. The final steps imply running an adaptive binarization of the images, recognizing the structure of
the tables, applying Optical Character Recognition (OCR) on each cell of the detected tables and exporting
them as csv. After testing the proposed method on several low quality scanned pdf documents, it turned out
that our methodology performs alike dedicated OCR paid software and we have integrated this algorithm as a
service in our platform that converts open data in Linked Open Data.
1 INTRODUCTION
According to the Global Open Data Index
1
more than
120 countries already publish some form of govern-
ment data on their open data portals. Most of the data
published however is not actually open, the definition
of this type of information being ”open data and con-
tent can be freely used, modified, and shared by any-
one for any purpose” (Definition, 2016).
One of the consequences of this definition is that
data has to be editable and unfortunately most of it
is not. Out of the 122 countries that publish open
data 100 score less than 50% in the Open Data In-
dex. One of the biggest score penalties is caused by
the fact that governments publish a lot of non machine
readable content like scanned pdf files. These files re-
quire a large amount of time of human processing to
turn the data into actual usable data. Besides time they
require costly OCR software that turns pdfs into ma-
chine readable csv files with a large amount of error.
This paper presents an algorithm and a methodol-
ogy to process typical open data scanned pdf files and
to convert them into actual machine readable usable
open data. The algorithm is validated against the best
paid software and it is included in our linked open
1
http://index.okfn.org/
data platform
2
as a service.
The paper is structured as it follows: in section
2, we introduce the problem solved in this article and
we present a few methods that tacked the same prob-
lem. In section 3, our proposed methodology for rec-
ognizing tables from scanned pdf images is detailed.
The evaluation of these algorithms is presented in
section 4. In the following chapter, we present how
we used our methodology to transform a dataset into
RDF triples.
2 SIMPLE METHOD
In the past years, a number of articles, such as City
Data Pipeline(Bischof et al., 2013), Datalift(Scharffe
et al., 2012) or Europeana(Haslhofer and Isaac, 2011)
tackled the problem of converting open data into
Linked Open Data, but all of them lack the ability to
transform unstructured information found in scanned
pdf files into this kind of data.
Also a number of articles have approached how to
obtain table from PDF files or text from tables from
PDF files. For example (Yildiz et al., 2005) recog-
nizes tables from PDF files, by detecting and clas-
2
http://opendata.cs.pub.ro/repo
220
Puha, A., Rinciog, O. and Posea, V.
Enhancing Open Data Knowledge by Extracting Tabular Data from Text Images.
DOI: 10.5220/0006862402200228
In Proceedings of the 7th International Conference on Data Science, Technology and Applications (DATA 2018), pages 220-228
ISBN: 978-989-758-318-6
Copyright © 2018 by SCITEPRESS – Science and Technology Publications, Lda. All rights reserved

sifing lines as table lines, single lines and unknown
lines. (Oro and Ruffolo, 2009) recognizes tables by
finding cells in a 2-dimensional grid. Both of them are
sensible on the page angle. (Hassan and Baumgartner,
2007), (Constantin et al., 2013) or (Fang et al., 2011)
are also examples of papers tackling the same prob-
lem for different use cases.
The simplest approach for converting pdf docu-
ments into machine-encoded text implies an applica-
tion of an Optical Character Recognition (OCR) on
the file as it is. For our purpose, we used Tesseract
(Smith, 2007). This software is an optical character
recognition engine for various operating systems and
is considered one of the most accurate open source
engine currently available. Tesseract cannot directly
handle pdf files, but it takes as input only one image
file at a time. We simply converted the pdf document
into image files and then we performed OCR on each
page. Our goal is to extract tabular data from these
images, but the output files contained only unreadable
information, to say nothing of any table structure. In
order to obtain useful knowledge from scanned docu-
ments, we started to improve text quality from images
and we developed an algorithm for detecting and ex-
traction of tabular data since Tesseract failed preserv-
ing the structure of the tables.
3 PROPOSED METHODOLOGY
As stated, the purpose of this article is to identify
and extract tabular data from images. In order to ac-
complish this, we developed a novel workflow, which
consists of several layers, explained in this chapter.
The proposed methodology for enhancing open data
knowledge by extracting this tabular data from pdf
documents is illustrated in Figure 1 and is fully de-
scribed in this section.
Our input consists of pdf documents that contain
data tables and also plain text. Each of the input file
have the following properties:
• The pdfs are not image over text. Each page of the
pdfs is a big image.
• The quality of scanned pages is very poor. Each
page can have a skew angle and also a lot of noise.
• There is no delimitation between plain text and
tables.
• Tables have borders.
3.1 Converting PDF into Images
Open source OCR software cannot perform directly
on a pdf document. Considering that the input files
must be either tiff or png files, a conversion of pdf into
images is required and since the open source OCR
engine does not have the ability to process multiple
images, we want each page of the PDF to be its own
image file. We used Ghostscript
3
for converting a pdf
document into 600 dpi high resolution bmp images.
3.2 Preprocessing
When we perform an OCR operation on an image
containing text, we want to obtain a good quality
output, namely the text extracted should accurately
match up with the text the image actually contains.
Due to poor quality images, one might not get the ex-
pected output. In most of the cases, the input files
contain image noise which can lead to a significant
reduction of accuracy. Scanned pdf documents might
also have been slightly rotated during their digitiza-
tion. A series of image processing operations are nec-
essary before going further (Bieniecki et al., 2007).
Below follows a detailed step-by-step description of
the preprocessing algorithm that consists of an appli-
cation of noise removal and deskewing.
Step 1 Noise is random variation of brightness or
color in an image that can make the text of the image
more difficult to read. We removed the noise by ap-
plying blur and then sharpen on the image, since blur
reduce detail levels.
Step 2 A skewed image is when a page has been
scanned not straight. We rotated the image in order
to obtain horizontal text lines using a skew angle. To
compute the skew we find straight lines in the text. In
a text line, we have several letters side by side. There-
fore, lines should be formed by finding long lines of
white pixels in the image. We find lines in the image
by applying the probabilistic Hough transform (Duda
and Hart, 1972), which returns a vector of lines. We
iterate through this vector of lines and calculate the
angle between each line and the horizontal line. The
skew angle is equal to the mean angle of all lines con-
verted from radians to degrees,as stated in (Rezaei
et al., 2013).
3.3 Adaptive Binarization
As a final step before extracting data, the enhanced
images need to be binarized. Our method consists of
applying three steps in order to get the final B/W im-
age , as shown in fig. 2.
Step 1: A median filter is used to eliminate small
noisy areas as well as smoothing the background tex-
ture and enhancing the contrast between background
and text areas.
3
http://www.ghostscript.com/
Enhancing Open Data Knowledge by Extracting Tabular Data from Text Images
221
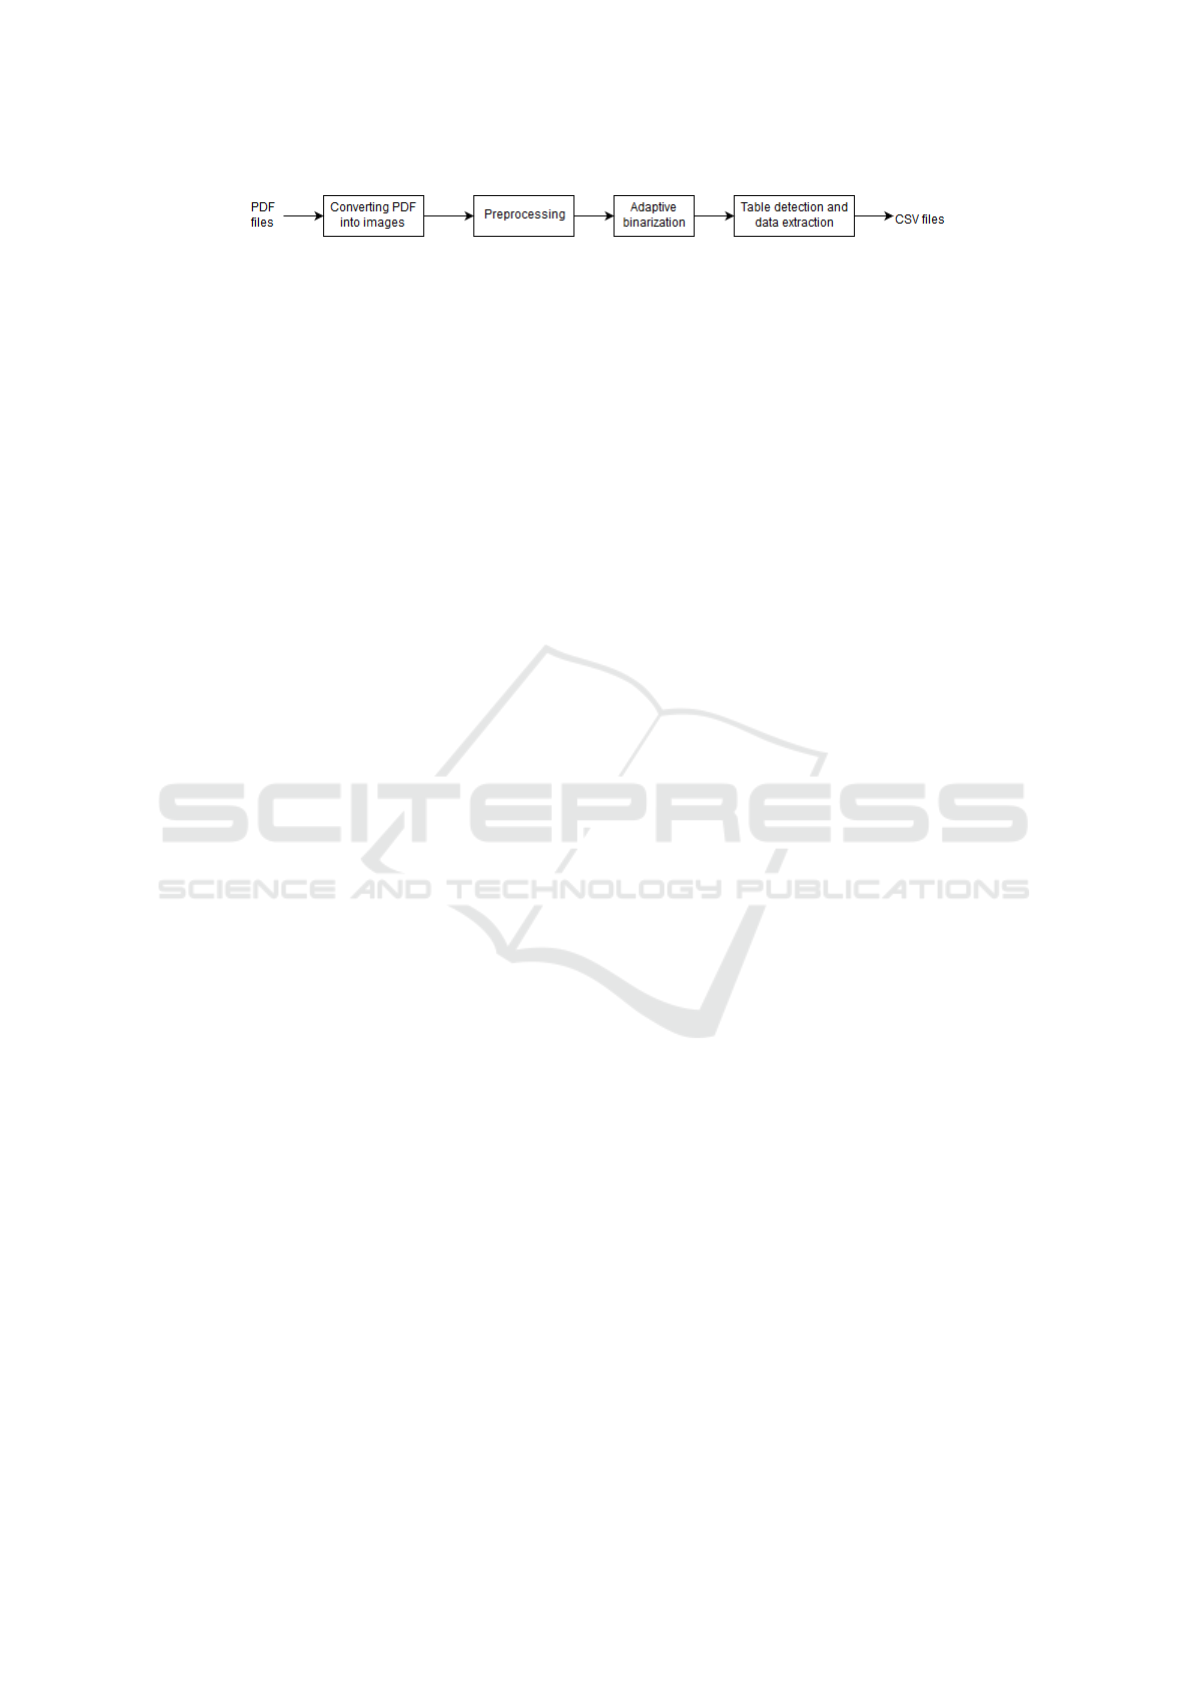
Figure 1: Block diagram of the proposed methodology.
Step 2: Wolf & Jolion’s (Wolf and Jolion, 2004)
approach for adaptive thresholding is suitable for our
documents since this method is based on a criterion
of maximizing local contrast and it is derived from
Niblack’s method (Niblack, 1985). After experimen-
tal work on low quality images, we suggest fixing k to
0.5, R, the dynamics of the standard deviation, to 128
and the windows size to 40 ∗ 40.
Step 3: We proceed to postprocess the resulting bi-
nary image in order to eliminate noise and small black
spots which might appear after the adaptive threshold-
ing and can be erroneously picked up as extra charac-
ters, especially if they vary in shape and gradation.
A shrink filter (Gatos et al., 2006) is used to remove
noise from the background. The entire binary image
is scanned and each foreground pixel is examined.
If P
sh
is the number of background pixels in a slid-
ing n ∗ n window, which has the foreground pixel as
the central pixel, then this pixel is changed to back-
ground of P
sh
> k
sh
where k
sh
can be defined exper-
imentally. A sequence of two morphological trans-
formations, a gradient followed by a dilation, is used
to remove small spots from the background. We find
contours in the resulting image after applying this se-
quence and eliminate only those whose area do not
exceed a threshold value.
3.4 Table Detection and Data
Extraction
Performing OCR on the entire document after the
adaptive thresholding step, leads us to a file which
contained unstructured information and also multiple
blank spaces. In order to solve this problem, we tried
at first to remove the cell borders (i.e. long horizon-
tal and vertical lines). The output text file contained
consistent information, but the software compressed
all white spaces into a single empty space. One pos-
sible approach to retain the relationship between cells
was to draw a unique character, like ’%’ on each cell
boundary, something the OCR software would still
recognize and that we could use later to split the re-
sulting strings. But we faced two other problems:
a) we could not distinguish between regular text and
table information, b) the structure of the table was
not preserved if it contained cells which span multiple
rows.
Then we tried the opposite approach which im-
plies locating the horizontal and vertical lines on each
page (i.e. long runs of black pixels) and splitting the
page using the line coordinates. Due to the fact that
resulting images from converting pdf files do not con-
tain tables with solid black borders (i.e. the cell bor-
ders are not always solid black nor continuous) as ex-
pected, this method has failed.
Our proposed solution solve both problems which
arose by using nave approaches. It implies scanning
the whole page in order to find blocks of text and then
identifying the tables. Each table is cropped and split
into cells which are used to recover the table structure.
Finally, an OCR operation is performed on each cell
individually and the output text is printed to a csv file.
The workflow of this method is visualized in Figure 3.
The algorithm is divided into four distinct steps,
as follows.
3.4.1 Step 1: Finding Blocks of Text in an Image
Given an image containing plain text and tables, no
information about the used font or the style of the font
(such as bold or italics) is available. Not having any
information about the used font or the page formatting
is not a difficulty for our proposed algorithm as one
would imagine. In order to enclose each word with a
rectangular area, we apply two morphological trans-
formations, a gradient transformation followed by a
dilation which will horizontally connect each compo-
nent (i.e. region of words). Then we find the external
contours in the resulted binary image. Each up-right
rectangular contour is encoded with four points. We
sort the array of contours in top-down and left-right
order using the top-left coordinates of the corner of
each contour. Then an iteration through the array of
contours is performed in order to select only those
contours whose area exceeds a threshold value (e.g.
3000px in our case) and its region have at least 45%
of non-zero pixels (i.e. text). A text block is uniquely
described by a contour. The flow of the algorithm is
visualized in Figure 4.
3.4.2 Step 2: Identifying Tables
The goal is to separate table elements from non-table
elements on the page. The algorithm will proceed to
identify tables by iterating through the vector of con-
tours and check each one’s properties. In order to re-
veal a contour properties, a series of operations are
performed on each text block surface.
The first step is to invert the colors of the text
block surface since we will focus on the white pixels.
DATA 2018 - 7th International Conference on Data Science, Technology and Applications
222
Figure 2: Block diagram of the adaptive binarization.
Figure 3: The workflow of the proposed method for table detection: (a) input image, (b) blocks of text found in the image ,
(c) identified data table, (d) detected table cells, (e) resulted csv file.
Figure 4: The intermediate results during finding blocks of
text : (a)input image , (b) gradient morphological transfor-
mation, (c) dilation morphological transformation, (d) final
result.
Then a Gaussian blur is applied in order to smooth
the edges of letters. The third step implies detecting
all the edges by applying the Canny edge detector on
the current text block surface. At this point we might
get an image with potential holes between the edge
segments, so we remove them by using a dilation mor-
phological transformation. Finally, we find the exter-
nal contours in the resulted image. If there it is only
one contour, then we approximate a polygonal curve
of this contour. If the polygon has four vertices and its
area exceeds a threshold value (e.g. 300 in our case),
then the current block of text is actually a table, other-
wise it is not. The flow of the algorithm is visualized
in Figure 5.
3.4.3 Step 3: Splitting Tables into Cells
The goal is to assign each cell a boundary contour.
The algorithm follows a few steps: first it inverts col-
ors of image, then it detects vertical and horizontal
lines by applying an opening morphological transfor-
mation and stores that result into a mask matrix with
the same size as input image. The next step implies
retrieving all the contours from the mask. Then an
Enhancing Open Data Knowledge by Extracting Tabular Data from Text Images
223
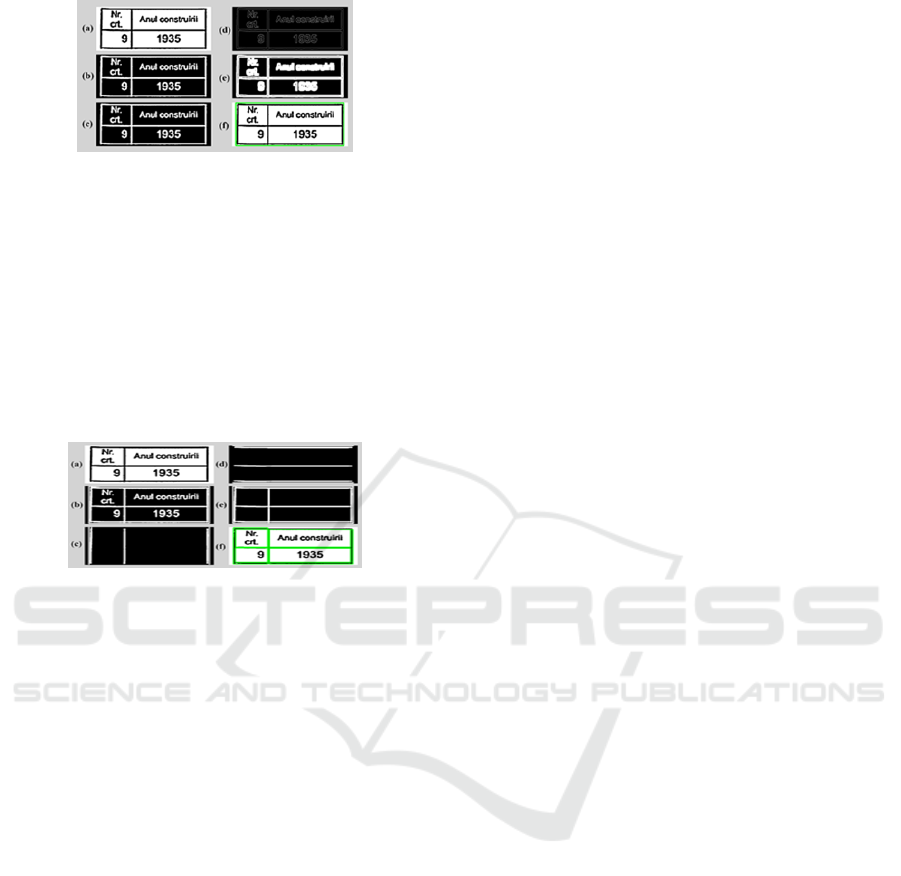
Figure 5: The flow of algorithm for a data table: (a) in-
put surface, (b)inverted image, (c) blurred image, (d)canny
edge detector, (e)dilation morphological transformation, (f)
external contour.
iteration through the array of contours is performed
in order to select only those contours whose area ex-
ceeds a threshold value (e.g. 300 in our case). It is
worth mentioning that each cell is stored as an array
of points since each contour is stored as an array of
points. The flow of the algorithm for splitting de-
tected table into cells is visualized in Figure 6.
Figure 6: Splitting table into cells: (a) input image, (b) in-
verted image, (c)detected vertical lines, (d) detected hori-
zontal lines , (e) mask created by merging vertical with hor-
izontal lines ,(f) detected cells.
3.4.4 Step 4: Recovering the Table Structure
At this point we have an array containing all table
cells. Iterating through the array and applying OCR
software on each cell seems to be a straightforward
solution, but since the array is unordered (i.e. cells do
not preserve the table structure) this will lead to un-
structured information. In order to recover the table
structure, our goal is to read a table just like reading
out the elements of a matrix row by row. This way we
will always know which row follows another one and
also the order of each cell in each row. To accomplish
this, let us first consider the following subsections:
3.4.5 Getting a Reference Cell
We need a reference cell to know from where to start
reading a table. Intuitively, it can be any cell as long
as it is part of the table, but we will see that choosing
the right cell is an important step in our algorithm.
The reference cell has to be a header cell because the
table header is fixed and it describes the table struc-
ture. Also, every cell on the same column with the
one given as reference should not span multiple rows.
We chose the first top-left cell for some reasons: a) in
some cases the first cell of the header is blank and
does not span multiple rows, b) in other cases it is
used as a row counter and also does not span multiple
columns, c) all cells on the first column indicate the
beginning of the row they belong and their height are
equal to the maximum height of the row.
Getting the top-left cell from an array containing
all table cells is pretty simple. Since every cell is ac-
tually an array of 2D points, we calculate the up-right
bounding rectangle of each point set (i.e. a cell) which
is denoted by its top-left corner, as well as width and
height of the rectangle. Finding the top-left cell is the
same as finding the minimum value from the array by
comparing the axis values of each corner (i.e. a point).
3.4.6 Getting the Cells on the Same Column as
the Reference One
The lack of perfectly aligned borders is a common
problem with scanned tables. The main idea be-
hind this algorithm is taking into consideration only
those cells whose top-left corner are within a x-
axis interval. This x-axis interval, called ”the de-
sired lane”, is set using the top-left corner coordi-
nates of the reference cell as follows [cell
re f erence
.x −
threshold, cell
re f erence
.x+threshold]. The decision of
adding a x-axis threshold was made based on the fact
that due to border width, after the process of table
splitting, two cells might have top-left corners with
slightly different coordinates, even though visually
there are on the same column. In order to get the cells
on the same column as the reference one, first we find
the top-left corner coordinates of the reference cell by
calculating its bounding rectangle. Then we iterate
through the array which holds the table cells contours
and check if each cell has the top-left corner on the
desired lane. If so, we add it to the result array. In
the end we sort the array in ascending order by each
cell y-axis value. We want to keep them in the same
order as they appear in the table. After applying this
algorithm, iterating through the result array it is like
top-down reading a column of a matrix (in this case
the first column) cell by cell.
3.4.7 Getting the Cells on the Same Row as the
Reference One
The process of getting the cells on the same row
as the one given as reference works much alike
the process of getting the cells on the same col-
umn as the reference one, with two major ex-
ceptions: the decision if a cell top-left corner is
on the desired lane is made based on its y-axis
value, there will be a horizontal lane with its height
set to [rect
re f erence
.y − threshold, rect
re f erence
.y +
DATA 2018 - 7th International Conference on Data Science, Technology and Applications
224

rect
re f erence
.height + threshold]. We increased the
right limit of the lane in order to include those cell
which span multiple rows.
Given the example presented in Figure 7, let’s say
we want to select all cells on the 4th row (i.e. all cells
denoted by green marked letters). We will use the first
cell of the row as reference.
The right limit of the desired line should be large
enough to cover all spanned rows (e.g. cells denoted
by L and M letters) and narrow enough not to cover
others cells from the next row (e.g. cell denoted by T
letter). The table borders might be not straight lines,
as showed in this example. If we set the limit to
rect
re f erence
.y + threshold as we did in the previous
subsection, then the algorithm might not be able to
identify all cells from the required row. But if we set
the limit to rect
re f erence
.y + rect
re f erence
.height just to
cover all cells of the row, we might get cells from the
next row. To solve both problems, we set the limit to
rect
re f erence
.y + rect
re f erence
.height + threshold.
3.4.8 Removing Cell Borders
Due to table cropping, the cells surfaces have dark
borders around them. These can be erroneously
picked up as extra characters, especially if they vary
in shape and gradation. In order to get good quality
output from OCR software, we might remove those
borders, as follows: first we create a mask with the
same size as the input cell, then we apply Otsu’s
thresholding method succeeded by a dilation morpho-
logical transformation to make small borders more
visible, then we find line segments in this binary mask
image using the probabilistic Hough transform which
returns a vector of lines. We iterate through this vec-
tor of lines and we remove from the cell image (i.e.
changing line color to white) only those lines which
are placed on the cell borders within a threshold.
3.4.9 Arranging Cells in Rows
It is clear that an ordinary ascending sort of the array
containing row cells does not lead to the expected re-
sult in all cases. Our algorithm is focusing on those
cells which do not span multiple rows and it is divided
into three distinct steps: a) sort the array contain-
ing row cells in ascending order by each cell x-axis
value, b) iterate through the array and try to group
those cells with top-let corner on (almost) the same
x-axis; we use a threshold value since the borders are
not perfectly aligned, c) sort the elements of group in
ascending order by each cell y-axis value and add it
to the result array
It is worth mentioning that, of course, every cell
which span multiple rows will be the single element
of a group. Basically, after the algorithm has finished
arranging the cells, we will get an array with number-
of-table-columns elements of cell groups. Each group
consist on only those cell belonging to the same col-
umn in the context of the current row.
In Figure 8, cells with numbers 1, 2, 7 and 8 span
two rows: cells with numbers 3 and 4, and cells with
numbers 5 and 6 respectively. After the first step of
the algorithm, the array will contain cells in the fol-
lowing order: [1, 2, 3, 4, 5, 6, 7, 8].
The second step will group these cells as follows:
as long as the next cell has the top-left corner x-
axis coordinate between cell
current
.x − threshold and
cell
current
.x + threshold, add it to the current group
and repeat this step with the next cell, otherwise cre-
ate a new group and move to the next cell. After this
step, we will have the following structure: [[1], [2],
[3, 4], [5, 6], [7], [8]], where the inside arrays de-
notes a group of cells. As we can notice, the third and
fourth groups have two elements. The third step im-
plies sorting of each group elements, but in this case
they are already ordered as we desired.
We have previously introduces the idea of read-
ing tables just like reading out the elements of a ma-
trix, row by row from a starting entry. In the follow-
ing, we will make use of these five functions in order
to explain how the table structure recovery algorithm
works.
As shown in Figure 9, the process of recovering
table structure begins with getting the reference cell.
Then we will find all cells on the same column as the
one given as reference using the function described in
the second subsection and start looping through the
resulted array. At each iteration, we will use the third
section function to obtain all cells on the same row
as the current one and arrange them using the fourth
section function. From now we assume that the cells
of the current row fit the table structure and we start
iterating the array and outputting the extracted data
as follows: first we will find the maximum number of
rows spanned by a cell which is equal to the maximum
number of elements of a group (i.e. rowspan), then
we will use idx variable iterator going from zero to
rowspan and at each step we will also iterate through
each group; if a group has an element with index idx,
then the algorithm will output a field separator and
extract data from that cell after removing its borders
using the fifth function, otherwise it will just output a
field separator.
Enhancing Open Data Knowledge by Extracting Tabular Data from Text Images
225
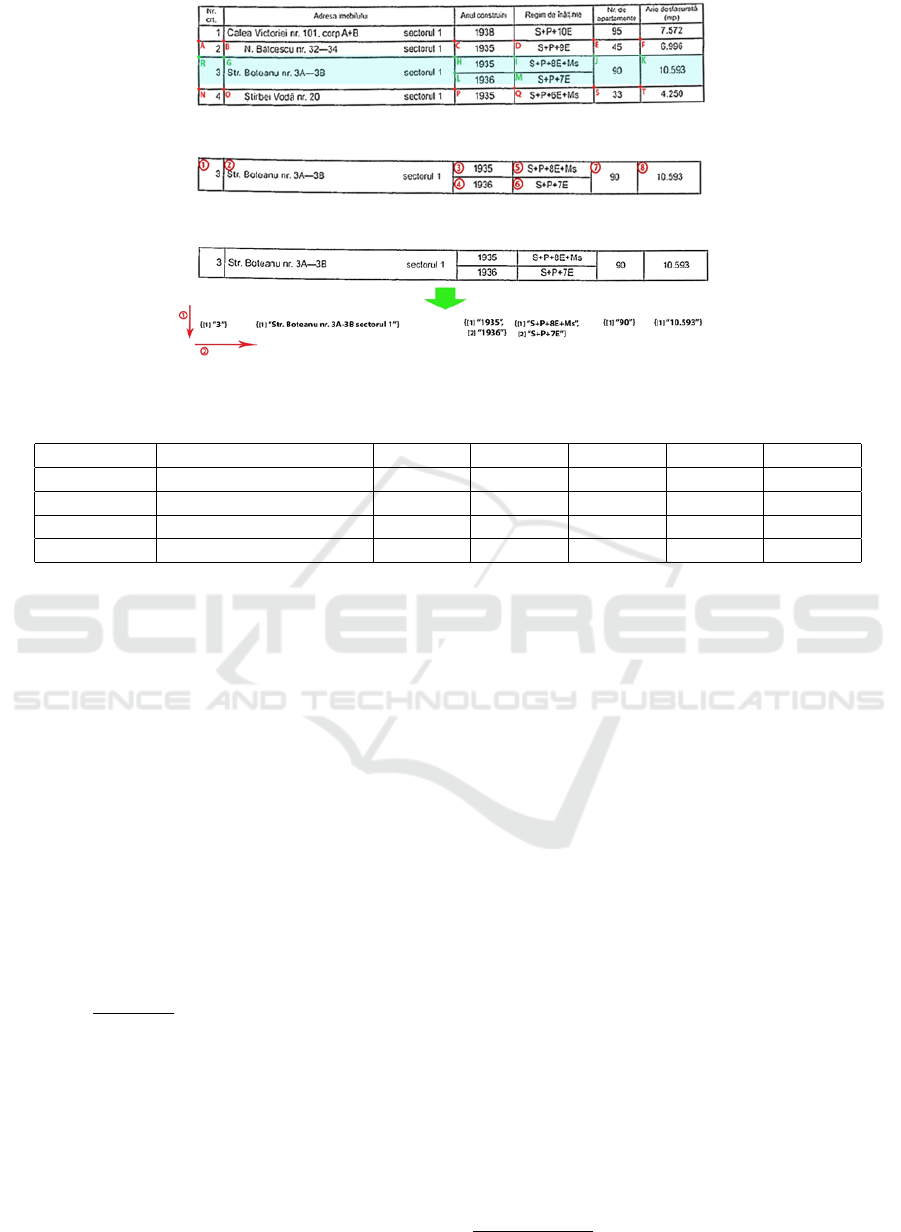
Figure 7: The desired horizontal lane.
Figure 8: Example of row with cells which span multiple rows.
Figure 9: Graphical representation of the algorithm.
Table 1: Increasing accuracy of the proposed method Levenshtein distance.
Documents Without spell correction Lev dst 1 Lev dst 2 Lev dst 3 Lev dst 4 Lev dst 5
Document 1 95% 97% 98% 99% 99% 100%
Document 2 90% 93% 95% 95% 96% 97%
Document 3 89% 93% 95% 95% 96% 96%
Document 4 82% 90% 92% 93% 94% 96%
4 EXPERIMENTAL RESULTS
We have applied the proposed method to a group of
scanned pdf documents and promising results were
achieved.
We used Tesseract-OCR on the original plain text
image and then on the each image resulted after ap-
plying the first three steps of our approach to mea-
sure the improvement in accuracy, as shown in Ta-
ble 2. The text generated by the used OCR software is
matched with the correct text to determine the number
of words needed to correct the generated text. This
gives us the number of errors. If there are n words in
the correct text, then the word accuracy is defined by
Equation (1).
n − errors
n
∗ 100 = accuracy (1)
We tested the proposed method on four scanned
pdf documents containing data tables and compared
the results with those obtained by running two paid
OCR software. The accuracy of each method is
shown in Table 3. The properties of each document
(number of pages, tables and words) are shown in Ta-
ble 4
As we can see in Table 3, our method performed
much better than DynamSoft and almost as good as
Abbyy FineReader. To improve the performance of
the proposed algorithm, we used a domain specific
corpora and performed a spell check over the gener-
ated text. Table 1 shows the accuracy we got with
different Levenshtein distances .
As we can see in Table 1, using a Levenshtein dis-
tance of 1 we obtain an overall accuracy as good as
FineReader, while using a distance of 2 the overall
accuracy was much better.
5 HOW USEFUL IS THIS
ALGORITHM?
In Romania, all open data issued by different pub-
lic institutions should be published on National Open
Data portal
4
. The purpose of this portal is to gather in
the same place all public data, which can be used fur-
ther by interested citizens. This information is pub-
lished as files with different formats. Unfortunately,
among these files there are scanned pdf files, contain-
ing important data.
One of the most important information that can be
found in one type of files is the list of buildings that
are in danger of collapsing in the case of an earth-
4
http://data.gov.ro
DATA 2018 - 7th International Conference on Data Science, Technology and Applications
226
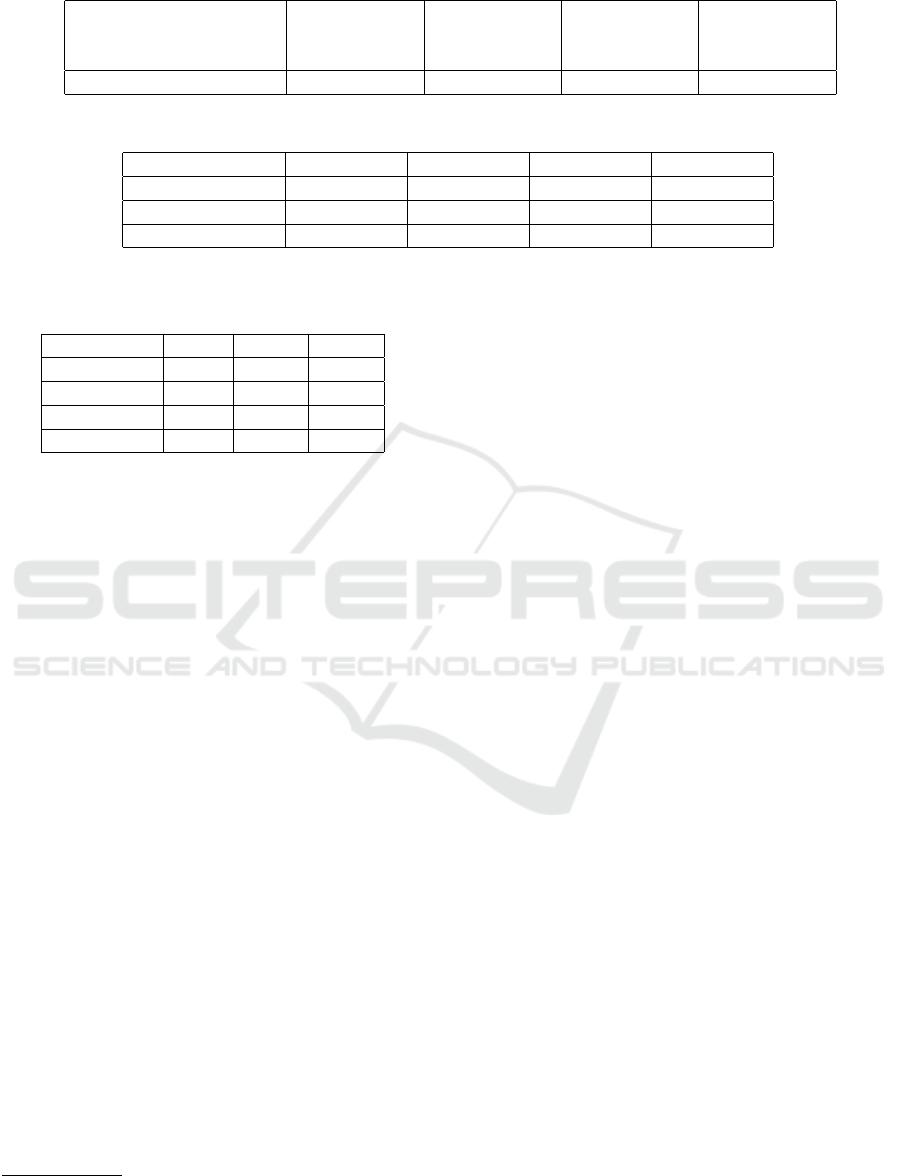
Table 2: Word accuracy after each step of the proposed method (plain text without detected tables).
Document Simple pdf
conversion
Ghostscript
conversion
step
Preprocessing
step
Adaptive
binarization
step
Plain text pdf document 2% 78% 87% 95%
Table 3: OCR evaluation.
Method Document 1 Document 2 Document 3 Document 4
Dynamsoft 64% 54% 56% 49%
FineReader 92% 93% 93% 97%
Proposed method 95% 90% 89% 82%
Table 4: Properties of tested documents.
Pages Tables Words
Document 1 2 3 176
Document 2 10 10 879
Document 3 15 56 3534
Document 4 64 63 38999
quake. This list is published in a law issued by the
Romanian Government and in the open data portal,
the laws are published as scanned pdf files. For de-
velopers, there is no easy way to integrate this list into
their applications and by far the most important prob-
lem is that people can die, because this information is
kept deep in a obscure text.
Using these pdf files as input for our algorithm,
we managed to extract the tables containing all build-
ings from Romania that can collapse in the case of an
earthquake. We extracted this list as csv files. Further-
more, using CSV2RDF4LOD
5
tool we transformed
each row of the tables in a RDF resource, having mul-
tiple properties, such as address, building type and the
construction year. We generated 2564 RDF resource,
having more than 10 000 RDF triples.
We published these RDF triples in our Linked
Open Data portal, exposing them for developers
through a SPARQL engine
6
. This way, developers
can implement different kind of applications, using a
standard API, for example showing on a map which
buildings can collapse in a case of an earthquake. The
real benefit of this approach is that people can be in-
formed better about their buildings and this can save
lives in a case of an earthquake.
5
https://github.com/timrdf/csv2rdf4lod-automation/
6
http://opendata.cs.pub.ro/repo/sparql
6 CONCLUSION
In this paper we presented an algorithm which en-
hances nowadays knowledge by extracting tabular
data from scanned pdf documents in an efficient way.
The proposed workflow consists of several distinct
steps: a conversion of a scanned pdf documents into
high resolution images, a preprocessing procedure of
each image using specific processing techniques, an
adaptive binarization of the images, recognizing the
structure of the tables, applying OCR on each cell of
the detected tables and exporting them as CSV.
Using this algorithm, we managed to extract rel-
evant information from Romanian Government files,
such as the list of buildings in danger of collapsing in
the case of an earthquake. We exported the tables as
csv files and we published each record as a RDF re-
source in a SPARQL engine, so that anyone can use
this information freely, without any restriction.
REFERENCES
Bieniecki, W., Grabowski, S., and Rozenberg, W. (2007).
Image preprocessing for improving ocr accuracy. In
2007 International Conference on Perspective Tech-
nologies and Methods in MEMS Design, pages 75–80.
IEEE.
Bischof, S., Polleres, A., and Sperl, S. (2013). City data
pipeline. Proc. of the I-SEMANTICS, pages 45–49.
Constantin, A., Pettifer, S., and Voronkov, A. (2013). Pdfx:
fully-automated pdf-to-xml conversion of scientific
literature. In Proceedings of the 2013 ACM sym-
posium on Document engineering, pages 177–180.
ACM.
Definition, O. (2016). Defining the open in open data, open
content and open services. Retrieved on July, 16.
Duda, R. O. and Hart, P. E. (1972). Use of the hough trans-
formation to detect lines and curves in pictures. Com-
munications of the ACM, 15(1):11–15.
Enhancing Open Data Knowledge by Extracting Tabular Data from Text Images
227

Fang, J., Gao, L., Bai, K., Qiu, R., Tao, X., and Tang,
Z. (2011). A table detection method for multipage
pdf documents via visual seperators and tabular struc-
tures. In Document Analysis and Recognition (IC-
DAR), 2011 International Conference on, pages 779–
783. IEEE.
Gatos, B., Pratikakis, I., and Perantonis, S. J. (2006). Adap-
tive degraded document image binarization. Pattern
recognition, 39(3):317–327.
Haslhofer, B. and Isaac, A. (2011). data. europeana. eu:
The europeana linked open data pilot. In International
Conference on Dublin Core and Metadata Applica-
tions, pages 94–104.
Hassan, T. and Baumgartner, R. (2007). Table recognition
and understanding from pdf files. In Document Anal-
ysis and Recognition, 2007. ICDAR 2007. Ninth Inter-
national Conference on, volume 2, pages 1143–1147.
IEEE.
Niblack, W. (1985). An introduction to digital image pro-
cessing. Strandberg Publishing Company.
Oro, E. and Ruffolo, M. (2009). Trex: An approach
for recognizing and extracting tables from pdf docu-
ments. In Document Analysis and Recognition, 2009.
ICDAR’09. 10th International Conference on, pages
906–910. IEEE.
Rezaei, S. B., Sarrafzadeh, H., and Shanbehzadeh, J.
(2013). Skew detection of scanned document images.
Scharffe, F., Atemezing, G., Troncy, R., Gandon, F., et al.
(2012). Enabling linked-data publication with the
datalift platform. In Proc. AAAI workshop on seman-
tic cities.
Smith, R. (2007). An overview of the tesseract ocr engine.
Wolf, C. and Jolion, J.-M. (2004). Extraction and recogni-
tion of artificial text in multimedia documents. Formal
Pattern Analysis & Applications, 6(4):309–326.
Yildiz, B., Kaiser, K., and Miksch, S. (2005). pdf2table: A
method to extract table information from pdf files. In
IICAI, pages 1773–1785.
DATA 2018 - 7th International Conference on Data Science, Technology and Applications
228
