
Harnessing Web 3.0 and R to Mitigate Simulation Validation Restrictions
Bill Roungas
1
, Sebastiaan Meijer
2
and Alexander Verbraeck
1
1
Department of Multi Actor Systems, Delft University of Technology, Jaffalaan 5, Delft, The Netherlands
2
Department of Health Systems Engineering, KTH Royal Institute of Technology, H
¨
alsov
¨
agen 11, Huddinge, Sweden
Keywords:
Simulation, Validation, Web Technologies, R Statistical Language, OpenTrack, Friso.
Abstract:
The complexity of modern systems has made the use of simulations paramount, in order to test different
scenarios in an affordable, ethical, and risk-free way. As such, simulations need to be validated, ensuring that
the obtained results are meaningful. But validation apart from the computational difficulties, bears several
other problems. The constant need for validation due to updates on the simulation software, the dependence
on the validation experts to be always available for the new iterations and for presenting any new insights are
just some of these problems. This paper proposes a framework, and applies it to two case studies, which is
based on Web 3.0 technologies and the R statistical language as a mean to mitigate such problems.
1 INTRODUCTION
During the last few decades, systems characterized as
Complex Adaptive Systems (CAS) (Axelrod and Co-
hen, 1999) have become increasingly popular. This
complexity, as insinuated by their name, does not
arise just from the increase of their size but also from
the high level of involvement of humans in many of
those systems’ internal processes. In turn, since hu-
man behavior cannot be characterized as 100% ratio-
nal, these systems often tend to behave in a seemingly
irrational way. Such an example are the decision mak-
ing processes in areas like healthcare (Rouse, 2008)
and transportation (Rinaldi et al., 2001).
The societal and financial impact of decisions
made in CAS necessitates for an affordable, ethical,
and risk-free way to test potential changes or threats
to the system at hand. As such, simulations, which
are one of the most popular - if not the most popular
- ways of accomplishing that, are deemed to be the
most appropriate tool.
Despite the significant help simulations can pro-
vide, they should not be, and usually are not, trusted
blindly. Simulations should be thoroughly validated,
ensuring - at least to some extent - that their results
are credible and can be used for the intended pur-
pose. There are multiple methods for validating sim-
ulations (Balci, 1998), but these methods are not the
only aspect validation success relies upon; the type
of validation (Conceptual Model & Operational) (Sar-
gent, 2000), as well as the intended purpose and au-
dience play an important role on how to approach the
validation results. This paper is concerned with the
operational validation of simulation models (Sargent,
2000), and more specifically with how Web 3.0 tech-
nologies and the R statistical language can help miti-
gate several restrictions that occur during the standard
validation life-cycle (Balci, 1994).
More specifically, simulations are characterized
by the fact that they regularly need updates either in
the form of verification (e.g. debugging), or in the
form of conceptual model validation (e.g. improve-
ments in the core algorithms of the simulation model).
In turn, following each update, the model should run
again in order to assert its operational validation. As
a result, a team of validation experts should often
be available to perform both the conceptual model
and the operational validation (Bergmann and Strass-
burger, 2010); this substantially increases i. the cost
of the validation study, ii. the time between the sim-
ulation is finalized by the modelers and the moment
it can be used for a formal study, iii. the probability
for a human error to occur due to the numerous cal-
culations involved in the procedure (Balci, 1997), and
iv. the dependence on specific validation experts, who
are knowledgeable of the particularities of the simu-
lation at hand (Balci, 1998).
The conceptual model validation, being a techni-
cal area, is quite difficult to automate, albeit not im-
possible. On the other hand, the operational valida-
tion is more straightforward in terms of modeling and
automation, since in many cases it utilizes statistical
44
Roungas, B., Meijer, S. and Verbraeck, A.
Harnessing Web 3.0 and R to Mitigate Simulation Validation Restrictions.
DOI: 10.5220/0006861200440054
In Proceedings of 8th International Conference on Simulation and Modeling Methodologies, Technologies and Applications (SIMULTECH 2018), pages 44-54
ISBN: 978-989-758-323-0
Copyright © 2018 by SCITEPRESS – Science and Technology Publications, Lda. All rights reserved

techniques. As such, the research question that will
be covered in this paper is:
Research Question: How can the operational val-
idation of a simulation model be automated or
semi-automated, in order to reduce the time, cost,
and human error associated with it?
This paper starts with two assumptions: i. au-
tomation, or at the very least semi-automation, can
be achieved on an operational validation (hereinafter
referred to as validation) study, and ii. Web 3.0 tech-
nologies and the R statistical language, given their nu-
merous advantages described in Section 3.4, can be
used to accomplish that. The paper aims at answering
the research question by first proposing a framework
for automated simulation model validation and then
demonstrating how this framework was used, in order
to automate the operational validation study of two
simulation models in the railway sector.
In Section 2, the state of the art on automated sim-
ulation model validation is identified. In Section 3,
a web-based framework for simulation model valida-
tion is proposed. In Section 4, a proof of concept of
the framework based on two different case studies is
presented. Finally, in Section 5, the future steps are
illustrated and final remarks are made.
2 BACKGROUND WORK
Automated simulation model validation is an issue
that has increasingly gaining awareness within the
simulation community (Balci, 1998). In various ar-
eas, automated validation has been proposed and op-
erationalized as a way to mitigate one or more of
the risks associated with validation. Studies on auto-
mated validation have been performed in the automo-
tive industry (Albers et al., 2012; Kum et al., 2006), in
pedestrian simulations (Porzycki et al., 2015), in bio-
logical models (Cooper, 2008), even in human-device
interfaces (Bolton, 2013). Nevertheless, the amount
of research and subsequently the amount of practical
applications is still rather limited, and most of the ap-
proaches are either domain specific or lack many of
the traits that can help mitigate the risks associated
with validation, as the latter were identified in Sec-
tion 1.
On the other hand, despite the huge influence and
usage of the World Wide Web (Chandrasekaran et al.,
2002), and consequently of web technologies, to the
best of our knowledge, there are no frameworks or
tools proposing or supporting the utilization of web
technologies for building simulation model validation
solutions. While, web technologies have been used
widely to build simulation models in various fields
(Byrne et al., 2010), their application usually stops
after the modeling and before the validation phase.
The closest attempt towards a web-based simulation
model validation environment has been the Evalua-
tion Environment (EE) (Balci et al., 2002), which is a
web-based client/server software system that enables
geographically dispersed people to conduct complex
evaluation projects in a collaborative manner. Never-
theless, EE is not a validation tool but rather a tool
more suitable for complex evaluations, such as mod-
eling and simulation credibility assessment, which re-
quires rigorous collaboration among technical people,
subject matter experts, engineers, project managers,
and program managers.
The final decision regarding the validity of a
simulation model is made by subject matter experts
(SMEs). Hence, any tool aimed at helping those
SMEs can be considered to be a decision support sys-
tem (DSS) (Landry et al., 1983). Unlike in simula-
tion model validation, in decision support, web tech-
nologies have been used in several different occasions
(Bhargava et al., 2007). In particular, the type of
DSS that bears a significant resemblance to a simu-
lation model validation process is the model-driven
DSS (Power, 2004). A model-driven DSS uses for-
mal representations of decision models and provide
analytical support using the tools of decision analysis,
optimization, stochastic modeling, simulation, statis-
tics, and logic modeling (Bhargava et al., 2007).
Web-based DSSs, including model-driven DSSs,
have experienced a significant increase research-wise
in the last decade (Blomqvist, 2014), which is a re-
sult of their numerous advantages. The field of sim-
ulation model validation could be similarly benefited
by web technologies, despite the so far infinitesimal
amount of research. The forthcoming sections of this
paper demonstrate a framework and two applications
of this framework in which the advantages of web
technologies for simulation model validation are il-
lustrated and the research question stated in Section 1
is addressed.
3 THE FRAMEWORK
In this section, a web-based framework for simula-
tion model validation is proposed. The framework has
three main components: i. the steps taken through-
out the standard validation life-cycle, ii. the actors in-
volved in the whole process, and iii. the architecture
of the validation tool. In Section 3.1, Section 3.2, and
Section 3.3 the three main components of the frame-
work are presented respectively.
Harnessing Web 3.0 and R to Mitigate Simulation Validation Restrictions
45
Import Data
Results
Process Data
Clean/Transform
Data
Present
Subject Matter Expert(s)
Access & take into account
Validation Expert(s)
Data Engineer(s)
(a) Manual validation
Import Data
Results
Process Data
Clean/Transform
Data
Subject Matter Expert(s)
Web + R
1
2
3
4
(b) Automated validation
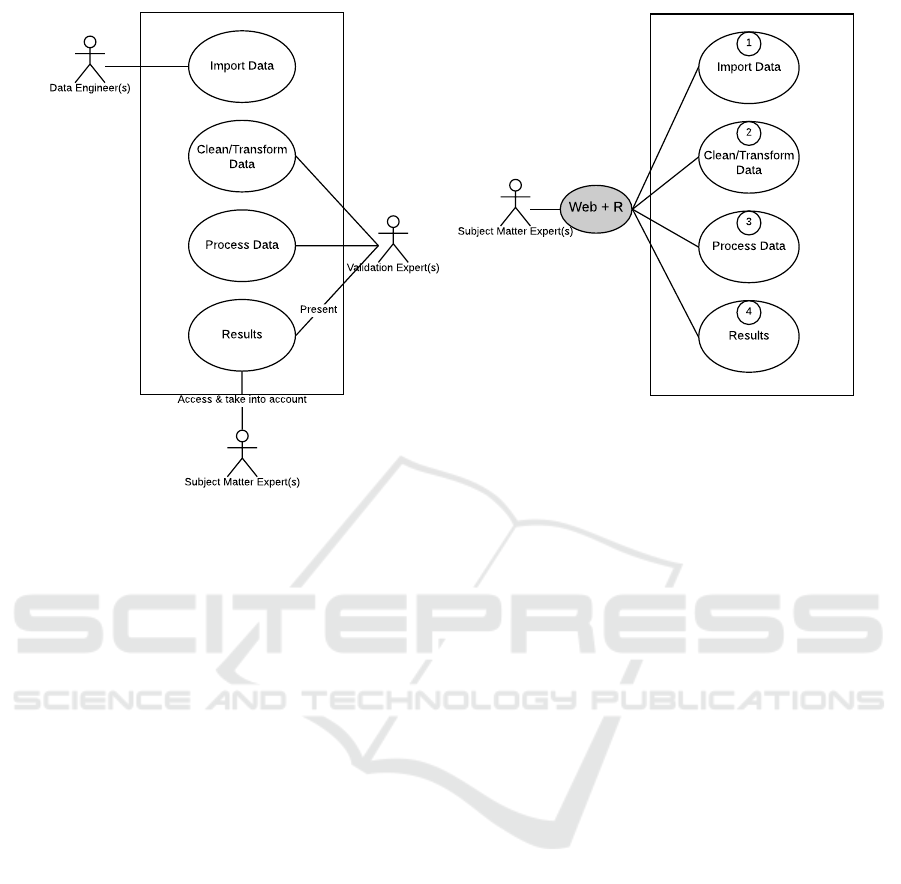
Figure 1: Use case diagram of the validation life-cycle.
3.1 Validation Steps
Every validation study is different, even if it is about
the same simulation software and model. This is due
to the multiple elements that define simulations. De-
pending on the nature of the study, these elements
might be the formalism the simulation is based on
(Vangheluwe et al., 2002), the fidelity level of the sim-
ulation (Liu et al., 2008), the type of the simulation
(Constructive, Virtual, Live) (Morrison and Meliza,
1999), to name a few. Despite the uniqueness of ev-
ery validation study, the steps that need to be taken
throughout the life-cycle of the validation are com-
mon. Namely, these steps are:
1. Import Data. Data from both the simulation and
the real system under study need to be imported
for further analysis. Data import can be performed
in multiple ways. The simplest one is through a
user interface (UI), while the most efficient one is
by directly running a script in the database. The
former is easy but usually extremely slow espe-
cially in today’s big data era. The latter is fast but
requires technical expertise that many SMEs do
not possess. Hence, the automation of data im-
port requires a hybrid approach. In the two case
studies presented in Section 4, two different ap-
proaches are tested.
2. Clean & Transform Data. Cleaning data from
outliers, thus ensuring accuracy, and transform-
ing data to the same units, thus making data be-
tween the model and reality comparable, is usu-
ally required. The cleaning and transformation of
data can be fully automated, semi-automated, or a
combination of both.
Full automation is implemented for known clean-
ing and transformation issues, such as converting
kilometers to meters or geodesic coordinates to
longitude and latitude. Fully automated scripts
can run either immediately upon importing the
data into the database or after a user’s request.
Semi-automation is implemented when the clean-
ing or transformation criteria are not predeter-
mined, but instead should be defined by the user.
Such an example is the acceptable deviation of
GPS data, in which case depending on the study,
a user might choose a more strict or more loose
threshold.
Regardless of the level of automation, data clean-
ing and transformation is a tedious task aiming at
ensuring a high quality of data, which depends on
multiple criteria (Huang, 2013).
3. Process Data. The 3
rd
step of the validation, the
processing of data, is the core of the implementa-
tion. This is the step in which the actual validation
of the model takes place. It includes the statistical
analysis and the design of all the visualizations. In
the proposed framework, in this phase, R is used
to perform the statistical calculations and create
SIMULTECH 2018 - 8th International Conference on Simulation and Modeling Methodologies, Technologies and Applications
46

the necessary graphs.
4. Present Results. The last step of the validation
study, the presentation of the results, is concerned
with how the processed data and the visualizations
produced in step 3 are presented to the SMEs.
This is the step in which the question: Is the model
valid? is answered. This question can only be an-
swered in a given context, and presenting the re-
sults of the validation study in light of its context
to the responsible stakeholders accomplishes that.
All three previous steps are preparatory for this
phase, in which SMEs can finally assess the sim-
ulation results and adjudicate on their validity for
the intended purpose of use. While steps 1 and
2 are relatively independent with each other and
with the remaining two steps, steps 3 and 4 are
closely connected to each other. Design decision
made in step 3 pertaining to the statistical tests
and the visualizations, are directly affecting the
way results are presented to the SMEs and thus,
influence not only in terms of content but also in
terms of context the final verdict with regards to
the validation of the model.
3.2 Actors
In the current manual state of the validation life-cycle,
each of the steps identified in Section 3.1 requires one
or more actors to perform it and usually more than
one type of actors are needed to perform the complete
life-cycle (Landry et al., 1983). Depending on the na-
ture and scale of the model, the number of different
actors required for the validation of the model can
vary. With regards to simulations for decision mak-
ing, an example of which for the current manual state
is shown in Figure 1(a), usually requires three type of
actors. Namely, these actors are:
1. Data engineers, who are the ones responsible for
fetching the data from the output of the simulation
model and provide an environment in which the
validation experts can interact with the data.
2. Validation experts, who are the ones responsi-
ble for cleaning, transforming, and processing the
data providing results for the subject matter ex-
perts.Validation experts should have knowledge
of the problem domain and expertise in the mod-
eling and validation methodology (Balci, 1998).
3. Subject matter experts (SMEs), who are the ones
responsible for evaluating the results provided
from the validation experts and deciding about the
validity of the simulation model.
While, the SMEs are necessary for the final de-
cision on the validation of the simulation model, the
other actors can be potentially omitted from the val-
idation life-cycle. Figure 1(b) shows what the ideal
situation of an automated validation life-cycle would
look like, which is also the final goal of this paper. In
Figure 1(b), the numbers indicate the different steps.
These numbers are used throughout this paper to in-
dicate the parts of the architecture and the implemen-
tation that correspond to each step. The idea behind
Figure 1(b) is for the SMEs to interact as less as pos-
sible with the tool during the first three steps and fo-
cus mainly on evaluating the results presented to them
during step 4. The different levels of automation and
the ways to accomplish that are described in detail in
Section 4.
3.3 Architecture
The architecture of the proposed web-based frame-
work consists of three main components:
• The web browser, which incorporates the user in-
terface (UI) and is how the SMEs interact with the
data and the results.
• The web server, which includes all the web files
(e.g. HTML, CSS, etc.), the R scripts, and the
necessary interfaces for their communication with
the web browser and the database, and
• The database server, which houses the database.
These three main components are the minimum
requirements of an implementation based on the pro-
posed framework. Each component can have different
flavors depending on the nature and the size of the fi-
nal implementation.
3.4 Advantages & Disadvantages
The utilization of web technologies and R improves
multiple Non-Functional Requirements (NFR) (De
Weck et al., 2011), also known as -ilities. Namely,
some of these NFR are:
• Usability. Usability is a quality attribute that as-
sesses how easy a UI is to use (Nielsen, 2003).
There is an abundance of research and case studies
on how modern applications can be user-friendly.
Particularly, web content has drawn most of the
attention. As a result, building web interfaces has
become increasingly more straightforward due to
the numerous guidelines, which are also targeted
for different user profiles. Hence, a web based
system, like the one proposed in this paper, can
provide an intuitive UI to SMEs for easily pre-
viewing and processing data.
Harnessing Web 3.0 and R to Mitigate Simulation Validation Restrictions
47

• Affordability. Affordability is a collection of at-
tributes, alternatives, and decision-making pro-
cesses that allow someone to determine if a prod-
uct is affordable (Bever and Collofello, 2002). A
web based system, like the one proposed in this
paper, is quite affordable since web tools, like
PHP and JavaScript, and R are open source pro-
gramming languages that bear no cost to license
them. Additionally, those tools’ popularity makes
it affordable to hire or train people, who can then
help build and maintain such a system. Finally,
such an implementation in which all the com-
plex calculations are performed in the server min-
imizes the cost of investment in end devices.
• Portability. Portability is a measure of the ease
with which a program can be transfered from one
environment to another (Tanenbaum et al., 1978).
Modern devices (laptops, tablets, smartphones)
coupled with the responsive design of web con-
tent converts these devices into portable working
stations. Moreover, due to the fact that all com-
plex calculations can be set up to be performed
in the server, even the simplest hardware can be
adequate to satisfy a user’s needs. Hence, a web
based validation system can provide instant access
to SMEs regardless their hardware, software envi-
ronment, or even geographic location.
• Interoperability. Interoperability is the ability
of different systems and software applications to
communicate, to exchange data accurately, effec-
tively, and consistently, and to use the informa-
tion that has been exchanged (Heubusch, 2006).
The specific implementation presented in this pa-
per is an example on the interoperability of web
technologies. Web technologies (like HTML,
CSS, JavaScript, PHP, SQL) are known for com-
municating well with each other. What makes
these tools remarkable in terms of interoperabil-
ity is their ability to also seamlessly bidirection-
ally communicate with external scripting or even
programming languages, like it is demonstrated in
this paper with R.
• Accessibility. Accessibility refers to the design of
products, devices, services, or environments for
people who experience disabilities (Henry et al.,
2014). Internet browsers are increasingly becom-
ing both directly (without assistance) and indi-
rectly ( with assistance like screen readers, braille
writing devices etc.) accessible to users who ex-
perience disabilities. Hence, a web based valida-
tion system can enable disabled SMEs to be more
engaged in the validation process and offer their
expertise.
Along with the NFR, there are also other advan-
tages of using web technologies and R throughout a
validation study. These technologies offer high levels
of customizability both in the backend and frontend,
thus fitting different needs, depending on the simu-
lation at hand. Moreover, the use of Ajax or in the
case of R a package like shiny, enables to build inter-
active web applications, where different parts of the
data can be used in real-time. Finally, web technolo-
gies’ and R’s versatility promotes both quick proto-
typing (proof of concept) and full scale commercial
implementations with animations, interactive content
etc.
Nevertheless, web technologies do have some dis-
advantages. Web applications, built upon a frame-
work like the one proposed in this paper, do not de-
pend on a local implementation. The browser serves
only as the UI for the end user and a server to perform
all the calculations is necessary, which means that In-
ternet access is required at all times. A workaround
to this limitation is for the end users to have an exact
copy of the server implementation in their localhost
but this requires some level of expertise on managing
databases and perhaps web applications in general, as
well as it eliminates the portability and affordability
advantages. Another drawback of web technologies
is that they are still an evolving field. While, there
have been major steps forward the past decade, there
are still performance issues especially with animated
and interactive content.
4 IMPLEMENTATION
In this section, a proof of concept based on the pro-
posed framework for the validation of two distinct
simulation models in the railway sector is presented.
The models were built to run on two separate simu-
lation environments, FRISO (Middelkoop and Loeve,
2006) and OpenTrack (Nash and Huerlimann, 2004),
which are both railway microscopic simulation envi-
ronments. Thus, they have the potential to, and de-
pending on the model usually do, simulate the railway
network in a detailed manner; both have the ability to
depict the network down to a switch level. Despite
the pointed similarities, these two simulation pack-
ages are different, thus suitable for different usages,
as revealed by being used in different studies, namely
in a punctuality and a conflict detection study respec-
tively. Therefore, the nature of the simulation studies
combined with the significantly dissimilar data asked
for a diverse approach with regards to their validation.
As a result, while the first 2 steps of the validation life-
cycle (Data import & Data cleaning and transforma-
SIMULTECH 2018 - 8th International Conference on Simulation and Modeling Methodologies, Technologies and Applications
48

tion) required similar methods to implement, for steps
3 and 4 two different tools were built. In spite of the
use of Web technologies and R on both of them, there
was a significant distinction on their design approach.
Web 3.0 technologies include a vast selection
of tools and programming languages spanning from
frontend to backend. This study and the resulted proof
of concept were developed using a MySQL database
schema, PHP on the backend, and basic JavaScript
with HTML and CSS on the frontend. Therefore, the
syntax used throughout this paper will be that of PHP,
SQL, JavaScript, shell script, and R. The deployment
diagram of the implementation is depicted in Figure 2.
The circled numbers correspond to the steps shown in
Figure 1(b) and indicate where in the implementation
each step takes place.
4.1 Data Import
In this study, two different approaches of data import
are tested. The most common file extensions used
to import data into a database are the .sql and .csv
(Comma Separated Values), thus the subsequent anal-
ysis is concerned only with these two extensions.
The first approach is using exclusively the back-
end programming language of choice. In PHP, for
a CSV file, this is accomplished by using the func-
tion f getcsv(). In Java, the equivalent is function
Scanner (), while in Python the module csv. Simi-
larly, for an SQL file, this is accomplished by using
the function f ile get contents(). In Java, the equiva-
lent is class SqlReader, while in Python the function
read.
The second approach is using an execution func-
tion of the programming language of choice. In PHP,
this is accomplished by using the function exec() and
executing a shell script. The procedure is almost iden-
tical for both SQL and CSV files. In Java, the equiva-
lent for PHP’s exec() function is also a function called
exec(), while in Python the equivalent is subprocess
call.
In a fully commercial implementation, there are
several issues someone should consider, like user per-
missions, name consistency in the database tables,
data sanitization etc., but they are out of scope for the
purpose of this paper; hence they are not analyzed fur-
ther.
Both approaches can be combined with an easy to
use UI and they have their advantages and disadvan-
tages. On the one hand, the first approach has the ma-
jor advantage that it can be sanitized and used safely
in the public domain, but at the same time is relatively
slow, especially with CSV or SQL files with millions,
or even billions, records. On the other hand, the sec-
ond approach is much faster and should be preferred
for large files, nevertheless it is prone to SQL injec-
tions making it unsafe for the public domain but suit-
able for internal use within a company.
4.2 Data Cleaning and Transformation
The proof of concept implemented for this project has
a simple UI for cleaning and transforming data and
depending on the task at hand, it is a combination of
fully and semi-automated cleaning and transforma-
tion SQL scripts. In the two case studies examined,
five data quality issues were identified. In Table 1,
these issues are listed along with an example from the
data and the level of automation used to address them.
4.3 Data Processing
Every model, depending on its intended purpose, usu-
ally requires different statistical techniques and visu-
alizations to enable its validation. The two examples
in this paper are not the exception. Nevertheless, for
validating both models, the same tools (HTML, CSS,
JavaScript, PHP, SQL, & R) were used and in some
cases in the same way. Particularly for this step, the
tools used were JavaScript, PHP, SQL, and R. Below,
the common usage of these tools on both models is
described.
PHP: Used to dynamically load information, like
stations, train series etc., from the database and to
trigger the R script with the appropriate arguments
using the exec() function. In this example, the
first argument of the exec() function is a file that
allows R to run as a scripting language, the second
argument is the R script to be executed, and the
rest of the arguments are the ones passed on the
script and utilized within it.
JavaScript: Used to dynamically load train series
and stations in dropdown menus given previous
choices.
R: Used the feature args ←
commandsArgs(T RUE) to fetch the arguments
passed from the exec () function in PHP, and the
RMySQL package to allow to run SQL queries
from within the R script (R can also directly
interact with NoSQL databases, like MongoDB,
using the package rmongodb, or Cassandra, using
the package RCassandra − package).
In Section 4.3.1 and Section 4.3.2 the tools devel-
oped to validate Friso and OpenTrack are presented
respectively.
Harnessing Web 3.0 and R to Mitigate Simulation Validation Restrictions
49
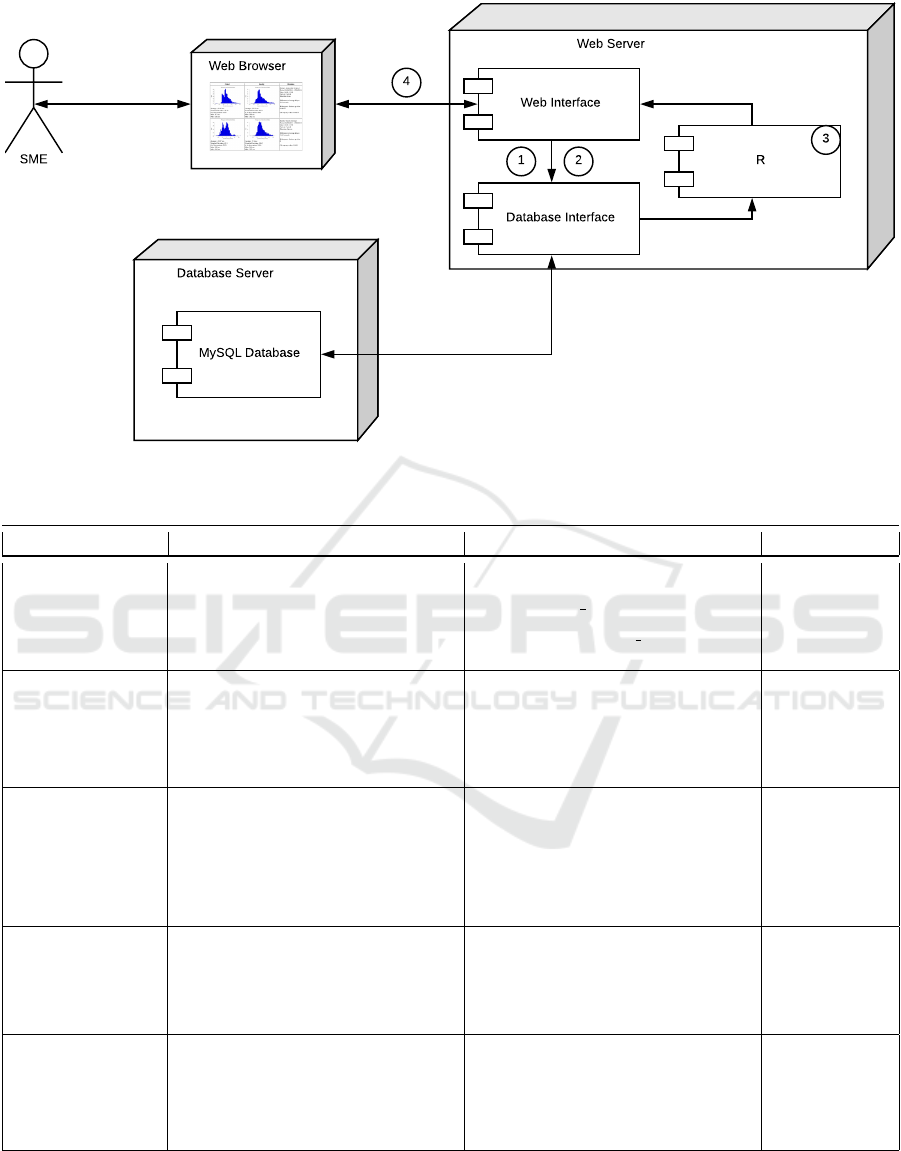
SME
Web Browser
Web Server
Database Server
MySQL Database
Web Interface
Database Interface
R
3
1 2
4
Figure 2: Deployment diagram of the implementation.
Table 1: Examples of data quality problems.
Quality Criterion Definition Example Automation
Syntactic
Consistency
The uniformity in the syntactic rep-
resentation of data values that
have the same or similar seman-
tics (Pipino et al., 2002).
Inconsistent:
friso.train series=’120NB’
operational.train series=120
Fully
Automated
Semantic
Accuracy
The conformity of a data value ν to
its real-world value ν
0
that is con-
sidered correct (Fox et al., 1994).
Inaccurate:
opentrack.distance=31971.90
operational.distance=33879.40
for acceptable difference < 1000
Semi-
Automated
Mapping
Consistency
The uniformity in the key values
of data representing the same ex-
ternal instance (Price and Shanks,
2005).
Inconsistent:
opentrack.position=31971.9
operational.longitude=5.293365
operational.latitude=51.69003
Fully
Automated
Semantic
Complete-
ness
The degree to which existing val-
ues are included in data relevant
to the purpose for which the data
is stored (Bovee et al., 2003).
Incomplete:
friso.arrival=’18:42:21’
operational.arrival=’00:00:00’
Fully
Automated
Presentation
Suitability
The degree to which the data for-
mat, unit, precision, and type-
sufficiency are appropriate for the
purpose of data use (Price and
Shanks, 2005).
Kilometers VS Meters:
opentrack.position=0.935898
operational.position=935.9
Fully
Automated
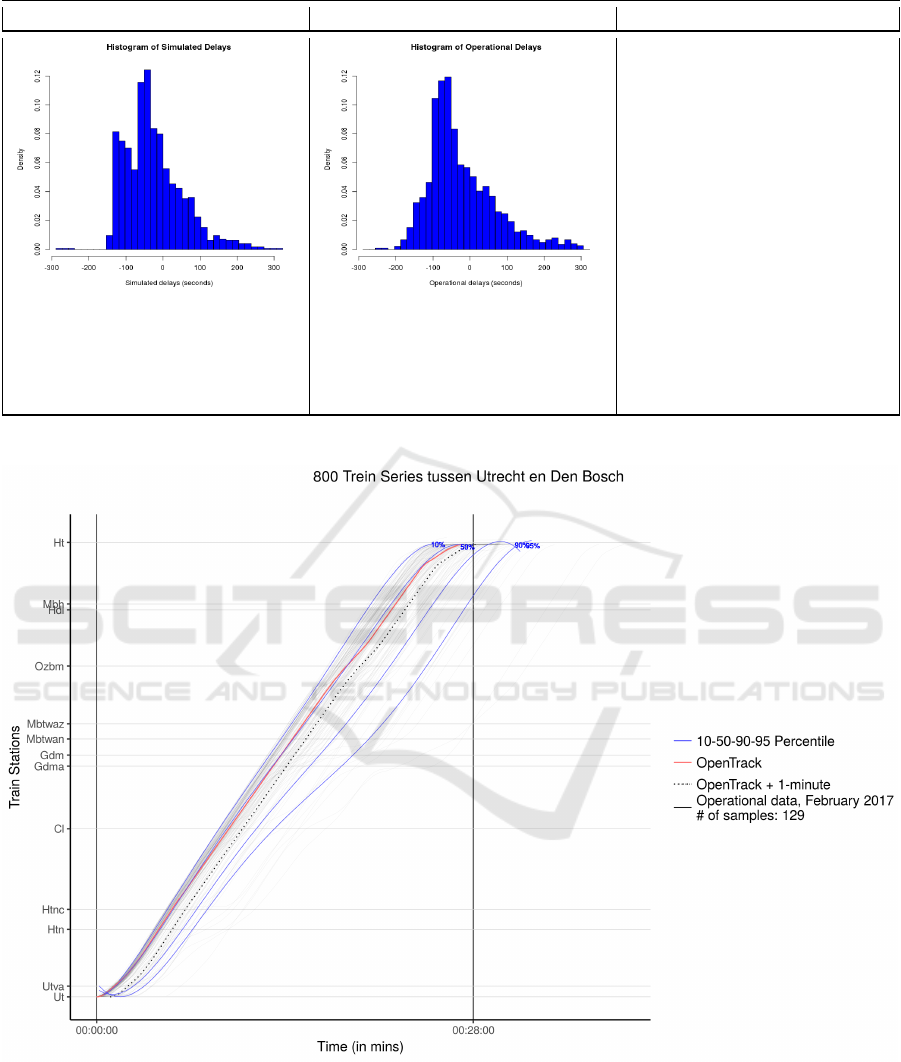
4.3.1 Friso
The model in Friso was used to test the punctual-
ity of timetables. As a result, the tool for validating
the model should offer a statistical comparison of the
delays between the model and reality. Moreover, it
should offer a way to perform graphical comparison
SIMULTECH 2018 - 8th International Conference on Simulation and Modeling Methodologies, Technologies and Applications
50

(Balci, 1998) of the delays. The latter is needed by
SMEs in order to observe how the delays of specific
train series or at specific stations are distributed and
perhaps cause indirect delays to other trains.
Therefore, the tool incorporates three main com-
ponents, all in one interface:
1. histograms depicting the delays of both the simu-
lation model and reality in the middle,
2. descriptive statistics (average delay, standard de-
viation, min and max delay etc.) below the his-
tograms, and
3. metadata (date, location etc.) and tests to verify
the equality of the distributions between model
and reality (Kolmogorov-Smirnov test and Pear-
son Chi-square test) on the right.
In R, the function hist () was used to build the his-
tograms and the functions ks.test () and chisq.test ()
to calculate the Kolmogorov-Smirnov test and the
Pearson Chi-square test respectively (In Python, all
these function can be found in the package SciPy).
4.3.2 OpenTrack
The model in OpenTrack was used to test the con-
flicts in a timetable. As a result, the tool for validating
the model should offer a statistical comparison on the
frequency of conflicts between the model and reality.
Moreover, it should offer a microscopic visualization
of the train driving behavior, which can allow SMEs
to pinpoint problematic regions in the infrastructure
or the rolling stock.
Therefore, the tool incorporates two main compo-
nents in different interfaces:
1. a simple UI in which SMEs can identify whether
certain conflicts that exist in reality also exist in
the model and vice versa, as well as the frequency
and the root cause of each conflict.
2. a detailed graph with the driving behavior of the
model and reality, including the totality of the
realization data and several percentile lines, the
number of which varies depending on the obser-
vations.
In R, the library ggplot was used to build the vi-
sualization of the driving behavior (In Python, ad-
vanced visualizations can be found in the package
mat plotlib). Additionally, several other libraries were
used to fine-tune the graph, like scales that allows
to automatically determine breaks and labels, and
directlabels that allows to put a label on a line-graph
outside the legend and directly next to the line.
4.4 Presentation of Results
For Friso, a proof of concept of the tool developed is
shown in Figure 3, in which case PHP was used to
fetch the results of the statistical tests, and HTML &
CSS to fetch the histograms and present all the out-
comes of the analysis in the most appropriate way.
For OpenTrack, which had two different interfaces as
mentioned in Section 4.3.2, an example of the result-
ing graph of the second interface is shown in Fig-
ure 4, in which case all the work for the resulting
graph was performed in R. For the first interface, PHP,
JavaScript, HTML & CSS were used to build the UI,
which has simple dropdown menus, and compares the
conflicts between the train series from the simulation
and operational data.
5 CONCLUSION & FUTURE
WORK
In this paper, a framework that combines web tech-
nologies and the R statistical language was explored
as a mean to mitigate problems pertaining to the val-
idation of simulation models. Web technologies are
commonly used in numerous occasions, but there was
no indication of them being used in simulation model
validation, despite the overwhelming evidence that
these technologies can help towards mitigating the
risks associated with validation. Indeed, the appli-
cation of the proposed framework to two case stud-
ies showed that web technologies offer a vast toolbox
that can help towards developing a more automated
validation than the current almost completely man-
ual state. Moreover, the interoperability of those tools
further widens the toolbox by enabling more accurate
and well-established technologies to be directly im-
plemented within the same environment. The latter is
demonstrated in the implementation presented in this
paper, in which case R, a well-established statistical
language, was used to perform all the necessary cal-
culations and create elaborate graphs, without the end
user even be aware of. Finally, the fact that the end
result of such an implementation can be presented in
a web browser translates not only to easy accessibility
but also to an affordable solution regarding the hard-
ware and software of the end user.
A potential threat to the applicability of the frame-
work is the limited focus of the case studies, which
were both from the railway sector, and the limited fo-
cus on the simulation packages, which were only two,
i.e. Friso and OpenTrack. Nevertheless, the data used
on both case studies did not have domain-specific
or package-specific particularities, which translates
Harnessing Web 3.0 and R to Mitigate Simulation Validation Restrictions
51
Model Reality Metadata
Station: Amsterdam Centraal
Period: 01/06/2014 - 15/06/2014
Time: 16:00 - 19:00
Activity: Arrival
Direction: Even
Difference in Average delays:
2.45 seconds
Kolmogorov-Smirnov p-value:
0.00029
Chi-square p-value: 0.00115
Average: -25.38 sec.
Standard Deviation: 78.56
# of observations: 1252
Max: 315 sec.
Min: -282 sec.
Average: -22.93 sec.
Standard Deviation: 90.21
# of observations: 2061
Max: 298 sec.
Min: -242 sec.
Figure 3: Simulated and real delays in Amsterdam central stations.
Figure 4: Driving and breaking behavior of OpenTrack.
that the framework is applicable to different domains
and simulation packages. By all means, this assess-
ment should not be taken for granted and future work
should include the application of the framework to
different domains and simulation packages.
Another potential threat arises from the fact that
the combination of the particular web tools used in
the case studies (PHP, plain JavaScript etc.) and R is
not the only way that this system could have been de-
signed. A PHP library for statistics, like statistics,
SIMULTECH 2018 - 8th International Conference on Simulation and Modeling Methodologies, Technologies and Applications
52

coupled with a JavaScript framework for visualiza-
tions, like d3. js, or an end-to-end solution using
Python are also viable and worthy exploring solu-
tions. Nevertheless, this choice was made based on
what the authors considered to be the best tool for the
job, which again should not be considered as a uni-
versally best solution. Implementations with different
tools, like Java or Python, can lead into a comparative
analysis on which tools are preferable for a validation
study.
Moreover, in the future, an implementation based
on a NoSQL database will provide more functional-
ity with semi-structured and unstructured data, which
can enhance even further the applicability of the
validation tool. Finally, commercial use of the
tool would be possible through a full scale imple-
mentation, which will take advantages of a mod-
ern JavaScript framework (like Angular.js, React.js,
Backbone.js etc.) for a fully customizable user in-
terface, Ajax for asynchronous communication with
the database, and more optimized SQL (or NoSQL)
and shell scripts for importing, cleaning, and trans-
forming data. Using the aforementioned technologies
would benefit modelers, validation experts, and SMEs
from developments in other domains, e.g. JavaScript,
query optimization etc., hence preventing them from
reinventing the wheel and focusing on what is impor-
tant to them.
ACKNOWLEDGEMENTS
This research is supported and funded by ProRail; the
Dutch governmental task organization that takes care
of maintenance and extensions of the national railway
network infrastructure, of allocating rail capacity, and
of traffic control.
REFERENCES
Albers, A., Hettel, R., Behrendt, M., D
¨
user, T., and
Schwarz, A. (2012). Extended Flexible Environment
and Vehicle Simulation for an Automated Validation.
In Proceedings of the FISITA 2012 World Automotive
Congress, pages 1263–1273. Springer London Hei-
delberg New York Dordrecht.
Axelrod, R. and Cohen, M. D. (1999). Harnessing complex-
ity: Organizational implications of a scientific fron-
tier. The Free Press.
Balci, O. (1994). Validation, verification, and testing tech-
niques throughout the life cycle of a simulation study.
Annals of Operations Research, 53(1):121–173.
Balci, O. (1997). Verification validation and accreditation
of simulation models. In Andradhttir, S., Healy, K. J.,
Withers, D. H., and Nelson, B. L., editors, Proceed-
ings of the 29th Conference on Winter Simulation,
pages 135–141, Atlanta, Georgia, USA. IEEE.
Balci, O. (1998). Verification, validation, and testing. In
Banks, J., editor, Handbook of Simulation, chapter 10,
pages 335–393. Engineering & Management Press.
Balci, O., Adams, R. J., Myers, D. S., and Nance, R. E.
(2002). A collaborative evaluation environment for
credibility assessment of modeling and simulation ap-
plications. In Yucesan, E., Chen, C.-H., Snowdon,
J. L., and Charnes, J. M., editors, Proceedings of the
2002 Winter Simulation Conference, pages 214–220,
San Diego, CA, USA. IEEE.
Bergmann, S. and Strassburger, S. (2010). Challenges
for the automatic generation of simulation models for
production systems. In Proceedings of the 2010 Sum-
mer Computer Simulation Conference, pages 545–
549, Ottawa, Ontario, Canada.
Bever, B. and Collofello, J. S. (2002). An investigation of
techniques for addressing software affordability. In
Aerospace Conference Proceedings, volume 5, pages
2577–2585, Big Sky, Montana, USA. IEEE.
Bhargava, H. K., Power, D. J., and Sun, D. (2007). Progress
in web-based decision support technologies. Decision
Support Systems, 43(4):1083–1095.
Blomqvist, E. (2014). The use of semantic web technolo-
gies for decision support - a survey. Semantic Web,
5(3):177–201.
Bolton, M. L. (2013). Automatic validation and failure di-
agnosis of human-device interfaces using task analytic
models and model checking. Comput Math Organ
Theory, 19(3):288–312.
Bovee, M., Srivastava, R. P., and Mak, B. (2003). A concep-
tual framework and belieffunction approach to assess-
ing overall information quality. International Journal
of Intelligent Systems, 18(1):51–74.
Byrne, J., Heavey, C., and Byrne, P. J. (2010). A review of
web-based simulation and supporting tools. Simula-
tion Modelling Practice and Theory, 18:253–276.
Chandrasekaran, S., Silver, G., Miller, J. A., Cardoso, J.,
and Sheth, A. P. (2002). Web service technologies and
their synergy with simulation. In Yucesan, E., Chen,
C.-H., Snowdon, J. L., and Charnes, J. M., editors,
Proceedings of the 2002 Winter Simulation Confer-
ence, pages 606–615, San Diego, CA, USA. IEEE.
Cooper, J. (2008). Automatic validation and optimisation of
biological models. Doctor of philosophy, University
of Oxford.
De Weck, O. L., Roos, D., and Magee, C. L. (2011). Life-
cycle properties of engineering systems: The ilities.
In Engineering Systems: Meeting Human Needs in a
Complex Technological World, chapter 4, pages 65–
96. Massachusetts Institute of Technology.
Fox, C., Levitin, A., and Redman, T. (1994). The notion of
data and its quality dimensions. Information Process-
ing & Management, 30(1):9–19.
Henry, S. L., Abou-Zahra, S., and Brewer, J. (2014). The
role of accessibility in a universal web. In Proceedings
of the 11th Web for All Conference, pages 1–4, New
York, New York, USA. ACM.
Harnessing Web 3.0 and R to Mitigate Simulation Validation Restrictions
53

Heubusch, K. (2006). Interoperability: What it means, why
it matters. Journal of American Health Information
Management Association, 77(1):26–30.
Huang, Y. (2013). Automated simulation model generation.
PhD thesis, Delft University of Technology.
Kum, D.-h., Son, J., Lee, S.-b., and Wilson, I. (2006).
Automated testing for automotive embedded systems.
In 2006 SICE-ICASE International Joint Conference,
pages 4414–4418, Bexco, Busan, Korea. IEEE.
Landry, M., Malouin, J.-L., and Oral, M. (1983). Model
validation in operations research. European Journal
of Operational Research, 14(3):207–220.
Liu, D., Macchiarella, N. D., and Vincenzi, D. A. (2008).
Simulation fidelity. In Hancock, P. A., Vincenzi,
D. A., Wise, J. A., and Mouloua, M., editors, Human
Factors in Simulation and Training, chapter 4, page
453. CRC Press.
Middelkoop, D. A. and Loeve, L. (2006). Simulation of
traffic management with FRISO. WIT Transactions
on the Built Environment, 88.
Morrison, J. E. and Meliza, L. L. (1999). Foundations of the
after action review process. Technical report, United
States Army Research Institute for the Behavioral and
Social Sciences, Alexandria, VA.
Nash, A. and Huerlimann, D. (2004). Railroad simulation
using OpenTrack. WIT Transactions on The Built En-
vironment, 74.
Nielsen, J. (2003). Usability 101: Introduction to usability.
Pipino, L. L., Lee, Y. W., and Wang, R. Y. (2002). Data
quality assessment. Communications of the ACM,
45(4):211–218.
Porzycki, J., Luba
´
s, R., Mycek, M., and Wa¸s, J. (2015).
Dynamic data - driven simulation of pedestrian move-
ment with automatic validation. In Chraibi, M.,
Boltes, M., Schadschneider, A., Seyfried, A., edi-
tor, Traffic and Granular Flow’13, pages 129–136.
Springer, Cham.
Power, D. J. (2004). Specifying an expanded framework
for classifying and describing decision support sys-
tems. Communications of the Association for Infor-
mation Systems Volume, 13:158–166.
Price, R. and Shanks, G. (2005). A semiotic informa-
tion quality framework: Development and compar-
ative analysis. Journal of Information Technology,
20(2):88–102.
Rinaldi, S. M., Peerenboom, J. P., and Kelly, T. K. (2001).
Identifying, understanding, and analyzing critical in-
frastructure interdependencies. IEEE Control Sys-
tems, 21(6):11–25.
Rouse, W. B. (2008). Health care as a complex adap-
tive system: Implications for design and manage-
ment. Bridge-Washington-National Academy of En-
gineering, 38(1):17–25.
Sargent, R. G. (2000). Verification, validation, and accred-
itation of simulation models. In Joines, J. A., Barton,
R. R., Kang, K., and Fishwick, P. A., editors, Pro-
ceedings of the 32nd Conference on Winter Simula-
tion, pages 50–59, Orlando, Florida, USA. IEEE.
Tanenbaum, A. S., Klint, P., and Bohm, W. (1978). Guide-
lines for software portability. Software: Practice and
Experience, 8(6):681–698.
Vangheluwe, H., de Lara, J., and Mosterman, P. J. (2002).
An introduction to multi-paradigm modelling and
simulation. In Barros, F. and Giambiasi, N., editors,
Proceedings of the AIS’2002 Conference (AI, Simula-
tion and Planning in High Autonomy Systems), pages
9–20, Lisboa, Portugal.
SIMULTECH 2018 - 8th International Conference on Simulation and Modeling Methodologies, Technologies and Applications
54
