
Graphs and Key Players in an Educational Social Network
Fernando Calle-Alonso
1
, Vicente Botón-Fernández
2
, Dimas de la Fuente
2
, Carlos J. Pérez
4
,
Miguel A. Vega-Rodríguez
3
and Daniel de la Mata
1
1
Research & Development Department, ASPgems SL, Spain
2
Cátedra ASPgems, University of Extremadura, Spain
3
Department of Technologies of Computers & Communications, University of Extremadura, Spain
4
Department of Mathematics, University of Extremadura, Spain
Keywords: E-learning, Social Graph, Cooperative Learning, Key Player, Engagement, Dropout, NeuroK, Social Learning
Analytics.
Abstract: A new social learning graph tool has been proposed and implemented in NeuroK. This is an interactive
visualization of the relationships among students, based on their comments, favorites, mentions and rates in a
course or a learning unit. Some illustrative examples are provided showing its possibilities, challenges and
future potential of using the social graph tool. Social graph can help teachers and students to have an easy
visual image of their relationships, discovering the key players in the network and also the isolated students
in risk of dropping out. The teacher can use this information to reach the students “in risk” and try to retain
them with some motivating and engaging actions. The social graph and the indices that can be obtained from
it show up to be also a very good tool to analyse the development of the course and to help the teacher to
evaluate the students.
1 INTRODUCTION
E-learning is a current formative strategy that can
solve many problems from the traditional education
environment. But it can also have some regrets too
depending on the platform used, such as the isolation
of the students, the high dropout rate, or the
dependence on technology/internet. Depending on
the kind of learning process, the student can be more
or less involved and motivated, and the pros and cons
are different than with the traditional approach.
The learning process can be individual,
collaborative or cooperative. Online education
technology can support these three perspectives
(Schoor et al., 2015), but which kind of learning is
more effective? Technology may support both
individual learning and access to social networks to
allow the individual development, engagement, and
motivation within social relationships. McInnerney
and Roberts (2004) point out that there is a certain
overlap and inter-concept usage between cooperative
and collaborative learning and they have provided
definitions and a deep analysis. A way to distinguish
the three concepts is focusing on how the learning is
taking place. Individual learning is conducted alone,
collaborative learning depends on groups and
cooperative learning takes place in networks (Panitz,
1999).
Online cooperative learning (Paulsen, 2017) tries
to give the students a space for individual
development, and also the freedom to participate in
networks or communities to improve their knowledge
together.
This article presents a new tool showing a social
interactive graph, which is implemented in an
innovative e-learning platform called NeuroK (Calle-
Alonso et al., 2017). This platform is based on the
principles of neurodidactics, and on cooperative
learning. The relationships among students (and also
with the teacher) are shown with some illustrative
examples. A great number of visual interactive
features have been implemented and shown in this
paper, and the way to calculate the graph is explained.
This kind of social graph analysis is demonstrated to
be a good way to measure collaborative or
cooperative distance learning (Reffay and Chanier,
2003). Some e-learning platforms have tried to use
social networks to develop their learning process, but
most of them have taken advantage of the most
common applications, such as Facebook or Twitter,
Calle-Alonso, F., Botón-Fernández, V., de la Fuente, D., Pérez, C., Vega-Rodríguez, M. and de la Mata, D.
Graphs and Key Players in an Educational Social Network.
DOI: 10.5220/0006816605230527
In Proceedings of the 10th International Conference on Computer Supported Education (CSEDU 2018), pages 523-527
ISBN: 978-989-758-291-2
Copyright
c
2019 by SCITEPRESS – Science and Technology Publications, Lda. All rights reserved
523

instead of developing and using their own. The
experiences in many cases have not been satisfactory,
and almost none of them have performed a social
analysis of the interactions among students.
In online education, it is very important to boost
the motivation and the engagement with the purpose
to reduce the dropouts (Willging and Johnson, 2009).
With the social graph it can be observed which
students are isolated or disconnected from the others,
and which are the key players (Zhou and Chen, 2015)
that act as influencers. The role of this influencers is
very important because they can spread information
in the network and reaching a lot of students. In this
paper an example of how to identify this kind of
student is also presented.
According to this information from the graph and
the role of the student in the network, the teacher
could grab one disconnected student and try to regain
his motivation. Also, the teacher could use this easy
to understand visual information as one of the factors
contributing to assess students, in this case according
to their participation in a course, or a lesson.
2 SOCIAL GRAPHS
Nowadays, the popularity of social networks has led
teachers to use them as a motivating factor (Rennie
and Morrison, 2013). Social learning networks
analytics are beginning to play an important role in e-
learning platforms (Buckingham Shum and Ferguson,
2012). The relationships among students of a social
network hide a lot of important information that can
be extracted with the right tools. This information can
be used to measure the participation and the cohesion
of a group of students. In addition, social networks
provide social learning graphs to capture and
represent the interactions and relationships that take
place among multiple entities in a learning
environment (Pardo, 2013).
Some teachers have tried to use some of the most
popular social networks (such as Facebook, Twitter
or LinkedIn) for educational purposes (Bosch, 2009).
However, most e-learning platforms do not have any
kind of social graph analysis or valuable measures to
properly evaluate the participants' relationships.
In this section we present the analysis of social
networks that is being applied to the cooperative e-
learning platform, NeuroK.
2.1 Implementation
Social graphs are considered as a global mapping of
the members within a social network and how they
relate to each other. In our case, the graph focuses on
an e-learning social environment. Nodes represent
students from a certain course or topic and the lines
linking the nodes represent a relationship between
them. In our social graph representation, the thicker
is the linking line between two nodes, the greater is
the number of communications between the two
students represented by the nodes. Due to the
different types of communications that may exist
between two students, each of them has been assigned
a different weight that affects the thickness of the line,
as we will see below.
The data obtained from NeuroK to build the social
graph and to calculate the social measures are mainly:
Comments: these are the replies that students
make of a content published by another student,
creating a direct communication between them.
Mentions: a student can be mentioned in
comments or tasks evaluations, creating a
social bond between the student mentioned and
the one who mentions.
Favorites: sometimes a student can set as
favourite another student’s comment, pointing
out that they like its content.
Rates: students can rate a content proposed by
another student as long as they justify their
assessment.
Each type of communication provides a different
score for the student who receives it. This score is the
one used as a weight when establishing the thickness
of the lines in the social graph, as it was mentioned
before.
For the representation of the graph, d3.js library
has been used. This library has some advantages such
as:
It lets you make your visualizations in the way
you want (e.g. you can use avatars as node
representations).
It allows you to add many other DOM
(Document Object Model) functions, like zoom
or pan functions for any graph you want.
It supports a large amount of data.
It has tools that make the connection between
data and graphics easy.
It is as flexible as the client side web
technology stack.
It allows you to build a graph based on social
gravity. This representation follows some rules
according to this gravity, such as the length of
a line or the attraction between nodes.
It is easy to debug using the browser’s built-in
element inspector.
A2E 2018 - Special Session on Analytics in Educational Environments
524

The teacher and students can interact with the
social graph by doing any of the following actions
(see Fig. 1):
Choosing the course or topic they want to be
represented in the graph.
Filtering data by user: students and teacher/s or
only students.
Filtering data by event type: comments,
mentions, favourites, rates or all events.
Selecting the number of influencers: from 1 to
5 or no influencers.
Displaying a tooltip when the mouse is over
any node.
Moving the graph structure by dragging a node.
Highlighting all the relationships of a node
when the mouse is over it.
Displaying the neighbourhood of a node by
double clicking that node.
Zooming in or out the entire social graph using
the mouse wheel.
Figure 1: Social graph filters.
The social graph represents the relative
importance of each student in NeuroK based on their
activity (comments, mentions, likes or ratings)
providing great information about the structure of the
network and how the students are related, as we will
see in the next subsection.
2.2 Study Case
Here a typical scenario that covers the concepts
mentioned above has been described in order to better
understand the system operation. We have tested
NeuroK through an existing topic called “Machine
Learning” to obtain a real dataset. There are five
students enrolled in the course and two teachers. In
order to build the social graph, all the information
from comments, mentions, favorites and rates has
been saved into the NeuroK database. That
information has been registered during a period of
one month. Once the dataset is ready, it is time to
navigate to the “Social Graph” view and set up the
filters. In this case, we establish the following
settings: Machine Learning topic, all users, all events
and no influencers.
After running our social graph approach over the
previous dataset, it generates the social graph that
appears in Fig. 2. It shows a global mapping of
students and teachers enrolled in the Machine
Learning topic and how they are related.
Figure 2: Social graph for Machine learning topic.
The nodes include the avatars of each student
profile (in this case we use the default avatar to
maintain their anonymity). They also have different
border colors depending on their role and how they
relate to each other. The students with social activity
have a green border. A student is considered to have
social activity when they send/receive comments,
mentions, favorites, and rates to/from other students.
The greater the social influence, the thicker and more
intense the green border. The metrics used to measure
this social influence will be discussed in the next
section. On the other hand, the isolated students with
no social activity have an orange border. Finally,
teacher nodes have no borders, since their activity
will not be evaluated.
The lines linking the nodes also highlight the
intensity of the relationship between two nodes. The
thickness of the line defines the intensity of the
relationship. With the proposed graph, a teacher can
have an overview of the participation in a course or
topic with a single chart. Some of the students may be
isolated, indicating that they are not participating in
the course or topic. The teacher should try to find out
why they are not using the platform. This is a simple
and effective way to identify students who may leave
the course before completing it.
Graphs and Key Players in an Educational Social Network
525
3 KEY PLAYERS IN
E-LEARNING
The information of the social network provided by the
graph would help in the identification of influencers
or key players, who may be good knowledge brokers.
Identification of a set of key players in a given social
network is of great interest in this context. Up to now,
most of the used algorithms for this task are based on
a single characteristic, however, in this case, it is
necessary to find a set of key players which can
perform well with respect to several characteristics of
interest. Within a social graph, students are
distributed into clusters. These clusters can be
analysed to find out what they are talking about and
what learning contents they are sharing and
commenting on. Clusters should not be isolated from
each other. The teacher's goal should be for all groups
to be connected, share information and collaborate
with each other. Some students will be related to
different groups. These students are often selected as
influencers or key players, as they can provide
information between groups and have different views
on the proposed materials and discussions. These key
players are very interesting to analyse, and teachers
could propose a specific line of action to help the rest
of the students thanks to their broad influence.
Different metrics have been used when assessing
the influence or social activity of a particular student:
betweenness centrality, global activity and Dijkstra’s
distance. The mean value of these three metrics
represents the influence of a node. With these three
metrics we manage to assess three fundamental
aspects of an influencer: direct communication with
the largest number of students (Dijsktra’s distance),
largest number of communications received or sent
(global activity) and communication between
different groups (betweenness centrality).
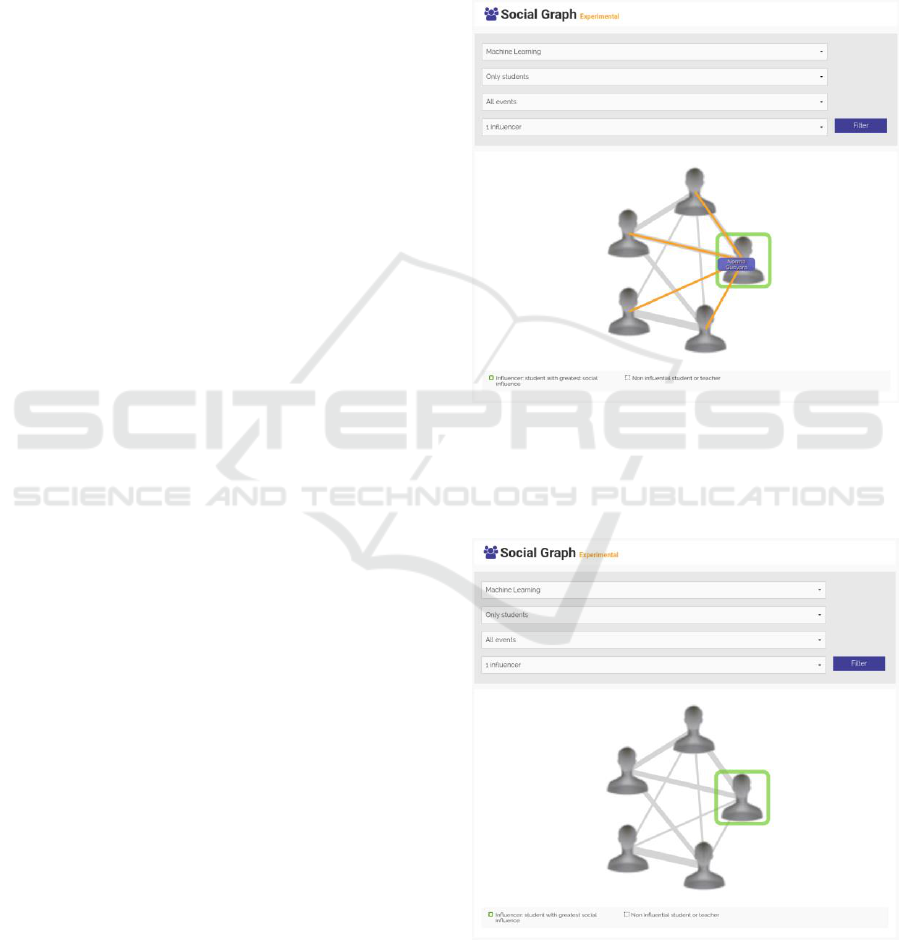
Let us go back to the study case from Subsection
2.2. Taking the same filter settings, but showing only
students and modifying the number of influencers to
1 as shown in Fig. 3, we can display the key player of
that topic.
4 CONCLUSIONS AND FUTURE
WORK
A new social graph tool has been proposed and
implemented in the e-learning platform NeuroK. It
has many visual customizations and possibilities to let
the teacher observe the participation of the students in
a course. With this tool the teacher is able to discover
the main relationships among the students and the
intensity of the relationships, which of them are key
players and who is disconnected and is a candidate to
drop out. Teachers can then try to re-engage isolated
students. Also they can use the social participation of
the students as part of their evaluation at the end of
the course.
In addition, groups of students can stand out showing
different behaviors and in the future, we classification
Figure 3: Social graph and key player for Machine learning
topic.
Fig. 4 shows the direct relationships of the
influencer by placing the mouse cursor over it.
Figure 4: Key player relationships.
A2E 2018 - Special Session on Analytics in Educational Environments
526

models to discover the main characteristics of each
group to deliver personalized recommendations.
Finally, the main indices obtained from the social
graph will be included in an evaluation book,
available for the teachers to help them to evaluate
students, and also, as a future work, an automatic
marking will be suggested.
ACKNOWLEDGEMENTS
This research has been supported by Ministerio de
Economía y Competitividad (Centro para el
Desarrollo Tecnológico Industrial, Contract IDI-
20161039), Junta de Extremadura (Contract AA-16-
0017-1, and projects GR15106 and GR15011),
Cátedra ASPgems, and European Union (European
Regional Development Funds).
REFERENCES
Bosch, T.E. 2009. Using online social networking for
teaching and learning: Facebook use at the University
of Cape Town. South African Journal for
Communication Theory and Research, 35(2), 185–200.
Buckingham Shum, S., & Ferguson, R. 2012. Social
Learning Analytics. Educational Technology &
Society, 15(3), 3–26.
Calle-Alonso, F., Cuenca-Guevara, A., de la Mata Lara, D.,
Sánchez-Gómez, J. M., Vega-Rodríguez, M. A., &
Sánchez, C. P. (2017). NeuroK: A Collaborative e-
Learning Platform based on Pedagogical Principles
from Neuroscience. In Proceedings of the 9th
International Conference on Computer Supported
Education (CSEDU 2017)-Volume Vol. 1, pp. 550-555.
McInnerney, J. M., & Roberts, T. S. 2004. Collaborative or
cooperative learning? Online collaborative learning:
Theory and practice, 203-214.
Panitz, T. 1999. Collaborative versus Cooperative
Learning: A Comparison of the Two Concepts Which
Will Help Us Understand the Underlying Nature of
Interactive Learning.
Pardo, A. 2013. Social learning graphs: combining social
network graphs and analytics to represent learning
experiences. International Journal of Social Media and
Interactive Learning Environments, 1(1), 43–58.
Paulsen, M. F. 2017. Cooperative online education.
In Seminar.net (Vol. 4, No. 2).
Reffay, C., & Chanier, T. (2003). How social network
analysis can help to measure cohesion in collaborative
distance-learning. In Designing for change in
networked learning environments (pp. 343-352).
Springer Netherlands.
Rennie, F., & Morrison, T. 2013. E-learning and social
networking handbook: Resources for higher education.
Routledge.
Schoor, C., Narciss, S., & Körndle, H. 2015. Regulation
during cooperative and collaborative learning: A
theory-based review of terms and
concepts. Educational Psychologist, 50(2), 97-119.
Willging, P. A., & Johnson, S. D. (2009). Factors that
influence students' decision to dropout of online
courses. Journal of Asynchronous Learning
Networks, 13(3), 115-127.
Zhou, J., & Chen, Y. J. (2015). Key leaders in social
networks. Journal of Economic Theory, 157, 212-235.
Graphs and Key Players in an Educational Social Network
527
