
Dynamic Beaconing using Probability Density Functions in
Cooperative Vehicular Networks
Sandy Boluf´e
1
, Cesar A. Azurdia-Meza
1
, Sandra C´espedes
1
, Samuel Montejo-S´anchez
1
,
Richard Demo Souza
2
, Evelio M. G. Fernandez
3
and Claudio Estevez
1
1
Dept. of Electrical Engineering, Universidad de Chile, Santiago, Chile
2
Dept. of Electrical and Electronics Engineering, Federal University of Santa Catarina, Florian´opolis, Brazil
3
Dept. of Electrical Engineering, Federal University of Parana, Curitiba, Brazil
Keywords:
Beacon Messages, Cooperative Road Safety Applications, Dynamic Beaconing Strategy, Probability Density
Functions, Vehicular Scenario Characteristics.
Abstract:
Vehicular networks comprise vehicle-to-vehicle (V2V) and vehicle-to-infrastructure (V2I) communications
based on wireless radio access technologies. These networks require the periodic exchange of beacon mes-
sages between neighboring vehicles, to support cooperative road safety applications. The regular broadcast of
beacon in the common control channel (CCH) using the IEEE 802.11p standard can lead to interference and
recurrent packet collisions. This issue impacts negatively in the quality and freshness of the beaconing infor-
mation which is essential to detect and mitigate potentially dangerous traffic situations on time. In this paper,
we evaluate the performance of a dynamic beaconing strategy where both beacon rate and transmit power are
assigned by means of probability density functions (PDFs). The idea is to know which PDF is more convenient
to increase the system’s performance according to vehicular scenario characteristics. We investigate four types
of PDFs, attending to four different performance metrics, in four distinct vehicular scenarios, using the well
established Veins (Vehicles in network simulation) framework. The simulation results show that a beaconing
strategy based on uniform PDF is convenient in scenarios with high vehicle density and low relative speed,
whereas a beaconing strategy based on normal PDF is suitable in scenarios with high relative speed and low
vehicle density.
1 INTRODUCTION
Vehicular networks include vehicle-to-vehicle (V2V)
and vehicle-to-infrastructure (V2I) communications
using the IEEE 802.11-OCB
1
radio access technol-
ogy in the 5.9 GHz frequency band (IEEE, 2016).
Cooperative awareness is the core of several active
road safety and traffic efficiency vehicular applica-
tions (Boban and d’Orey, 2016). The main premise
is that, knowing the status of neighboring vehicles,
the active road safety systems will be able to detect
and mitigate potentially dangerous traffic situations
on time, and successfully coordinate the traffic in cer-
tain points or sections of a road. In order to make
others aware of its presence, each vehicle periodi-
cally transmits one-hop broadcast messages, called
1
The Outside the Context (OCB) mode allows vehicles that
are not member of a Basic Service Set (BSS) to trans-
mit/receive data without preliminary authentication and as-
sociation.
beacons, containing its position, speed, acceleration,
and heading (ETSI, 2014). This process, known as
beaconing, occurs on the so called control channel
(CCH) and allows the receivervehicles to create a Lo-
cal Dynamic Map (LDM) based on surrounding envi-
ronment information, which is essential for the proper
performance of cooperative awareness vehicular ap-
plications.
Different beaconing algorithms have been pro-
posed in the literature to support cooperative aware-
ness applications (Shah et al., 2017). These adapt the
beacon transmission parameters, using distinct strate-
gies, to control the channel load and meet the commu-
nication requirements of the applications. The algo-
rithm proposed in (Sepulcre et al., 2016) integrates
a congestion and awareness control process. First,
the packet transmission rate of each vehicle is con-
figured taking into consideration the minimum re-
quired by the application, plus certain margin. Then,
the transmission power is set to the minimum power
636
Bolufé, S., Azurdia-Meza, C., Céspedes, S., Montejo-Sánchez, S., Souza, R., Fernandez, E. and Estevez, C.
Dynamic Beaconing using Probability Density Functions in Cooperative Vehicular Networks.
DOI: 10.5220/0006816206360642
In Proceedings of the 4th International Conference on Vehicle Technology and Intelligent Transport Systems (VEHITS 2018), pages 636-642
ISBN: 978-989-758-293-6
Copyright
c
2019 by SCITEPRESS – Science and Technology Publications, Lda. All rights reserved

level needed to ensure the demanded packet reception
rate at the application warning distance. In the pro-
posal of (Aygun et al., 2016), the algorithm adjusts
the beacon transmission power in order to reach a de-
sired awareness ratio at the target distance, while con-
trolling the communication channel load by adjust-
ing the beacon transmission rate to keep the current
channel busy ratio below certain threshold. The work
in (Kloiber et al., 2012) proposes to mitigate recur-
ring interferences by randomly selecting the transmit
power, while using a fixed beacon transmission rate.
Such randomization reduces the chances that a vehi-
cle is found in the common packet collision area from
multiple senders.
In this paper, we evaluate the performance of a dy-
namic beaconing strategy where both beacon rate and
transmit power are assigned by means of probability
density functions (PDFs). The goal is to know which
PDF is more suitable to increase the system’s perfor-
mance according to traffic characteristics of vehicular
scenarios. Randomizing the beacon transmission pa-
rameters has the following benefits: 1) reduces the
probability of recurring packet collisions; 2) provides
local and global fairness; 3) implicit congestion con-
trol; and 4) adjustment of the quality of cooperative
awareness according to applications requirements or
vehicular context. We explain these benefits in more
detail in the subsequent section.
The main contributions of this paper are the fol-
lowing: i) to model the beaconing process adjust-
ing both beacon rate and transmit power by means of
PDFs; ii) to evaluate the impact of PDFs based bea-
coning strategy on system’s performance, when the
same distribution (Constant, Uniform, Normal or Tri-
angular) is used to control the beacon rate and trans-
mit power; iii) to evaluate the PDFs based beaconing
in four distinct vehicular scenario (Spider, Manhat-
tan, Highway, and Urban) using a realistic simulation
framework; and iv) to set a relationship between the
use of certain PDF and the traffic characteristics of
vehicular scenario.
The remainder of this paper proceeds as follows.
In Section 2 we present the beaconing process based
on PDFs. Section 3 describes the simulation setup,
including vehicular scenarios, simulation parameters,
and performance metrics. The results are discussed in
Section 4. Finally, conclusions and future works are
given in Section 5.
2 DYNAMIC BEACONING USING
PROBABILITY DENSITY
FUNCTIONS
The regular broadcast of beacon messages provides
updated information in real time of the transmitting
vehicle status (Boban and d’Orey, 2016). Through
this process, receiving vehicles obtain accurate infor-
mation of the surrounding environment, being able to
avoid accidents on time and coordinate the traffic on
the road. One of the main issues of the beaconing
process is the high load it can generate on the com-
munication channel. In scenarios with high vehicle
density, the beaconing load can lead to channel con-
gestion, increasing significantly packet collisions (Ze-
mouri et al., 2014). As a consequence, the degrada-
tion of cooperative awareness due to recurring packet
collisions impacts negatively on the system’s perfor-
mance.
The random dynamic beaconing is based on using
a certain PDF to set beacon transmission parameters.
The vehicles compute the beacon rate and transmit
power by means of PDFs over a certain valid range on
each beacon transmission. Fig. 1a and Fig. 1b show
the concept of random distribution of beacon rate and
transmit power for four different PDFs. In the nor-
mal and triangular distributions, the values close the
mean (5 beacon/s in Fig. 1a and 50 mW in Fig. 1b)
present a higher chance of occurrence. The benefits
of random transmit power selection are described in
(Kloiber et al., 2012). Next, we present the main ben-
efits when both beacon rate and transmit power are
assigned randomly.
• Reduction of Recurring Packet Collisions:
randomize the beacon rate and transmit power by
means of a symmetric PDF can significantly decrease
recurring interferences. In scenarios with high vehi-
cle density and low relative speed, the periodicity of
beacon transmission leads to recurring packet colli-
sions. Random selection of beacon transmission rate
decreases the probability that two or more vehicles
transmit at the same time, whereas random selection
of beacon transmission power decreases the probabil-
ity that a vehicle is in the interference area of multiple
senders.
• Local and Global Fairness: one of the goals
of the beaconing process is to achieve local fairness
among neighboring vehicles in the contribution to
cooperative awareness, and to achieve overall fairness
among all the vehicles of the network in the contribu-
tion to communication channel load. PDFs harmonize
the access to channel resources, and guarantee equity
in selection of beacon rate and transmit power of ve-
hicles. For example, vehicles that broadcast beacons
Dynamic Beaconing using Probability Density Functions in Cooperative Vehicular Networks
637

1 2 3 4 5 6 7 8 9 10
0
0.05
0.1
0.15
0.2
0.25
0.3
0.35
0.4
Beacon Transmission Rate [beacon/s]
Probability Density Functions
Constant
Uniform PDF
Normal PDF
Triangular PDF
(a)
10 20 30 40 50 60 70 80 90
0
0.005
0.01
0.015
0.02
0.025
0.03
0.035
0.04
Beacon Transmission Power [mW]
Probability Density Functions
Constant
Uniform PDF
Normal PDF
Triangular PDF
(b)
Figure 1: Representation of probability density functions for the random assignment of: a) Beacon rate, b) Transmit power.
with a higher transmission rate will have a greater use
of the communication channel resources, and vehicles
that transmit with a high power negativelyaffect vehi-
cles that transmit with a lower energy level. However,
the random selection of beacon transmission parame-
ters avoids such unfairness, for an extended period of
time, providing local and global fairness.
• Implicit Congestion Control: random selec-
tion of beacon transmission parameters implicitly
controls the communication channel congestion, be-
cause the vehicles use on average the mean value of
beacon rate and transmit power of the selected PDF.
For example, if a vehicle transmits constantly with
the maximum beacon transmission rate and power,
it will generate the highest possible beaconing load
and reach the pre-established maximum communica-
tion range. However, with the random selection of the
beacon transmission parameters, considering a uni-
form PDF over the valid range, the effective beacon
transmission rate and power are reduced to the PDF
mean. Even so, the minimum beacon inter-reception
time and the maximum communication range can still
be achieved.
• Quality of Cooperative Awareness: adjusting
the parameters of the PDFs (mean and variance), the
quality of cooperative awareness can be adapted dy-
namically according to communication requirements
of different applications or vehicular contexts. For ex-
ample, the PDF mean can be established to meet a cer-
tain target beacon transmission rate and power, and
by adapting the variance it is possible to control the
way in which selected values are distributed around
the mean. Further, it is possible to adapt the limits
of the valid range of the PDF according to vehicle
speed or vehicular density to improve the cooperative
awareness.
3 SIMULATION SETUP
The experiments have been conducted using the
Veins
2
framework (Sommer et al., 2011), which cou-
ples the OMNeT++ network simulator and the SUMO
road traffic simulator.
3.1 Simulation Scenarios
The performance of the dynamic beaconing strategy
based on PDFs has been evaluated in four different
scenarios.
Spider 8x6x100: it consists of 8 axes, which have a
length of 1200 m and converge in the center of the
scenario, and by 6 regular octagons all spaced at a
distance of 100 m (see Fig. 2a). The roads have two
lanes in opposite directions and intersections are man-
aged by priority. The speed limit for each street is 70
km/h and the surface has an approximate area of 1
km
2
. In this scenario, a traffic flow of 30 vehicles
was defined for each principal axis. Therefore, there
are eight vehicle flows that move from one end to the
other of the axes of the outer octagon at a simulation
time of 220 s.
Manhattan 7x7: is composed by a total of 8 hori-
zontal and vertical roads, with a separation between
streets of 100 m. The layout of the roads define a to-
tal of 49 blocks, which occupy an approximate area
of 0.5 km
2
(see Fig. 2b). The intersections are man-
aged by priority, while each road has a speed limit
of 70 km/h and two lanes in opposite directions. In
this scenario were defined eight traffic flows of 30 ve-
hicles each. The flows move through the four central
roads located vertically, four traffic flows from the top
2
Vehicles in network simulation - http://veins.car2x.org/
RESIST 2018 - Special Session on Resilient Smart city Transportation
638

(a) (b) (c) (d)
Figure 2: Scenarios seen from SUMO road traffic simulator: a) Spider 8x6x100, b) Manhattan 7x7, c) Highway - Montreal,
d) Urban - Ottawa.
to the bottom and the four remaining from the bottom
to the top. Each road has two vehicle flows which are
moving in opposite direction, in a simulation time of
220 s.
Highway: defined by a real map portion of Montreal
city with an area close to 5.1 km
2
(see Fig. 2c). The
zone has two main roads, in the opposite direction
with a length of 3.4 km. Each road has two lanes
in the same direction and a maximum speed limit of
100 km/h. Two traffic flows of 150 vehicles were de-
fined, one by each main road. Therefore, we have two
vehicle flows that circulate on parallel roads, one to
meet the other, intersect and move away again, in a
simulation time of 500 s.
Urban: defined by a real map portion of Ottawa city
with an area close to 1 km
2
(see Fig. 2d). The zone
has two traffic lights, and roads with speed limits of
60 km/h and 100 km/h. Two traffic flows of 30 vehi-
cles were defined, which move along one of the main
roads but in opposite direction. The flows intersect in
one of the traffic lights, so that during the time it takes
the change of light, vehicles remain clustered. Then
the groups disperse, moving away to reach the final
destination of the route, in a simulation time of 220 s.
3.2 Simulation Parameters
The vehicles employ the IEEE 802.11p EDCA model
(Eckhoff and Sommer, 2012) of the well established
Veins framework to represent the MAC/PHY layer.
This is an open source model, which fully capture the
distinctive properties of IEEE 802.11p radio access
technology. The vehicles broadcast beacons messages
to the communication channel setting the beacon rate
and transmission power by means of PDFs. Table
1 shows the PDFs used to dynamic assign the bea-
con parameters. The dynamic beaconing process uses
the same PDF to adjust both beacon rate and trans-
mit power on every beacon transmission. We used
the beaconing approaches proposed in (Kloiber et al.,
2012) as a baseline for the evaluation of the beacon-
ing strategies based on PDFs. Table 2 shows the pa-
rameters of the two variants of Kloiber’s approach
that were implemented. The radio signal propagation
is modeled with the Two-Ray Interference path loss
model (Sommer et al., 2012), using ε
r
= 1.02. Based
on an extensive set of measurements on the road, this
model has been shown to be more exact than Two-Ray
Ground and Free-Space model, improving the accu-
racy of the simulation of radio transmissions, espe-
cially in short and medium distances. The commu-
nications are established on CCH without consider-
ing the effect caused by multi-channel operation. The
beacon messages have 250 bytes and are transmitted
with a priority corresponding to voice access category
(AC
VO). Each vehicle is 5 m long, 2 m wide and has
maximum acceleration of 0.8 m/s
2
, and deceleration
up to 4.5 m/s
2
. The antenna height is 1.5 m and data
rate is 6 Mbps. Table 3 illustrates the main simulation
parameters.
3.3 Performance Metrics
We use four performance metrics to evaluate the co-
operative awareness provided by dynamic beaconing
strategies based on PDFs.
• Average Packet Collisions: number of packet
collisions that, on average, is perceived by each vehi-
cle.
• Average Hidden Nodes: number of nodes that,
on average, are hidden from each vehicle.
• Average Vehicles in LDM: number of sur-
rounding nodes that, on average, each vehicle regis-
ters in its LDM database.
• Average Position Error: average position error
computed by a receiving vehicle in real time due to
the movement of a surrounding node in the beacon
interval.
4 RESULTS AND DISCUSSION
In this section, we present the main simulation results
obtained in the different scenarios. Fig. 3 and Fig. 4
illustrate the histogram of the beacon rate and trans-
mit power used by a generic vehicle. In the uniform
Dynamic Beaconing using Probability Density Functions in Cooperative Vehicular Networks
639

Table 1: PDFs Parameters.
PDF Value
Constant 5 beacon/s, 50 mW
Uniform
a = 1 beacon/s, 4 mW
b = 10 beacon/s, 96 mW
Normal
mean = 5 beacon/s, 50 mW
variance = 1 beacon/s, 10 mW
Triangular
a = 1 beacon/s, 4 mW
b = 5 beacon/s, 50 mW
c = 10 beacon/s, 96 mW
Table 2: Parameters of the Kloiber Approach.
Approach Value
Kloiber - var1 10 beacon/s, uniform (4 mW - 96 mW)
Kloiber - var2 2 beacon/s, uniform (4 mW - 96 mW)
Table 3: Simulation Parameters.
Parameter Value
CCH center frequency 5.890 GHz
Channel bandwidth 10 MHz
Beacon size 250 bytes
CW [3, 7]
AIFSN 2
Receiver sensitivity - 82 dBm
Thermal noise - 110 dBm
Data rate 6 Mbps
Antenna gain 0 dB
Antenna height 1.5 m
Path loss model Two-Ray Interference ε
r
= 1.02
distribution, the values of the valid interval (1 bea-
con/s to 10 beacon/s in Fig. 3b and 4 mW to 96 mW
in Fig. 4b) have the same chances of occurrence. The
result is a fair dynamic assignment of the possible val-
ues of beacon rate and transmit power. In the normal
PDF, see Fig. 3c (mean 5 beacon/sand variance 1 bea-
con/s) and Fig. 4c (average 50 mW and variance 10
mW), the values clustered to one and two variance of
the mean have approximately 95 % and 65 % chance
of being selected, respectively. This causes that the
random values of beacon rate and transmit power with
more chance of occurrence be clustered on both sides
of the mean, and the values that remain at the ends of
the valid interval occur with very low frequency (only
a 5 % of probability). In the triangular distribution,
see Fig. 3d (mean 5 beacon/s) and Fig. 4d (mean 50
mW), the values that most occur are still around the
mean. However, these values occur with less proba-
bility than in normal distribution. On the other hand,
the values that remain at the ends of the valid interval
have more chance of occurrence than in the normal
distribution.
Fig. 5 illustrates the performance of dynamic bea-
coning strategies based on PDFs in the different sce-
narios. We also include the two variants of Kloiber’s
approach (see Table 2). Fig. 5a illustrates that the
Kloiber - var1 beaconing approach leads to highest
number of average packet collisions in all scenar-
ios, followed by the beaconing strategy with con-
stant transmission parameters. Kloiber - var1 beacon-
ing approach uses a high beacon rate (10 beacon/s),
which increases the channel load and recurring packet
collisions, especially at low communication distance
and in scenarios with high vehicle density. The uni-
form distribution shows the benefits of randomizing
the beacon transmission rate compared to the Kloiber
- var1 beaconing approach. The uniform distribution
achieves a number of average packet collisions simi-
lar to that obtained by the Kloiber - var2 strategy in
the different scenarios, spite this Kloiber variant uses
a transmission rate of 2 beacon/s all the time. Ac-
cording to these results, the uniform distribution of
transmission parameters in the valid range reduces re-
curring interferences. Randomizing the beacon trans-
mission rate reduces the probability that two vehi-
cles transmit at the same time, while randomizing
the transmit power reduces the probability that a ve-
hicle is in the interference area of multiple senders.
The normal and triangular distributions have a simi-
lar performance in the different scenarios. However,
the triangular distribution achieves a lower number of
packet collisions (see Fig. 5a) and registers more ve-
hicles in the LDM database (see Fig. 5c) than the
normal distribution, but computes a greater number of
hidden terminals (see Fig. 5b). According to Fig. 5b
and Fig. 5c, both dynamic beaconing based on PDFs
and Kloiber’s approach compute a similar number of
vehicles in LDM and hidden nodes for the Grid, High-
way and Urban scenarios.
Fig. 6 and Fig. 7 illustrate the average position er-
ror computed by a generic vehicle when the neighbors
use dynamic beaconing based on PDFs, in the High-
way and Urban scenarios, respectively. On the other
hand, Fig. 8a and Fig. 8b illustrate the same situation
when the surrounding vehicles use the Kloiber’s ap-
proach. According to Fig. 6a, the beaconing with
constant transmission parameters produces an aver-
age position error less than 3 m most of the time
in the Highway scenario. However, the high num-
ber of packet collisions (see Fig. 5a) results in aver-
age position error peaks that can exceed 5 m and 10
m. This behavior is similar in the Urban environment
(see Fig. 7a), with the average position error close
to 1.5 m due to the low vehicle speeds, but exceed-
ing 4 m in a punctual case. The good performance
of the uniform distribution in the previous metrics is
degraded in terms of perceived real position error for
both scenarios (see Fig. 6b and Fig. 7b). The use of
low beacon rates when vehicles move at high speeds
leads to a greater average position error. In contrast,
dynamic beaconing with normal distribution experi-
ences a lower number of harmful position errors than
RESIST 2018 - Special Session on Resilient Smart city Transportation
640
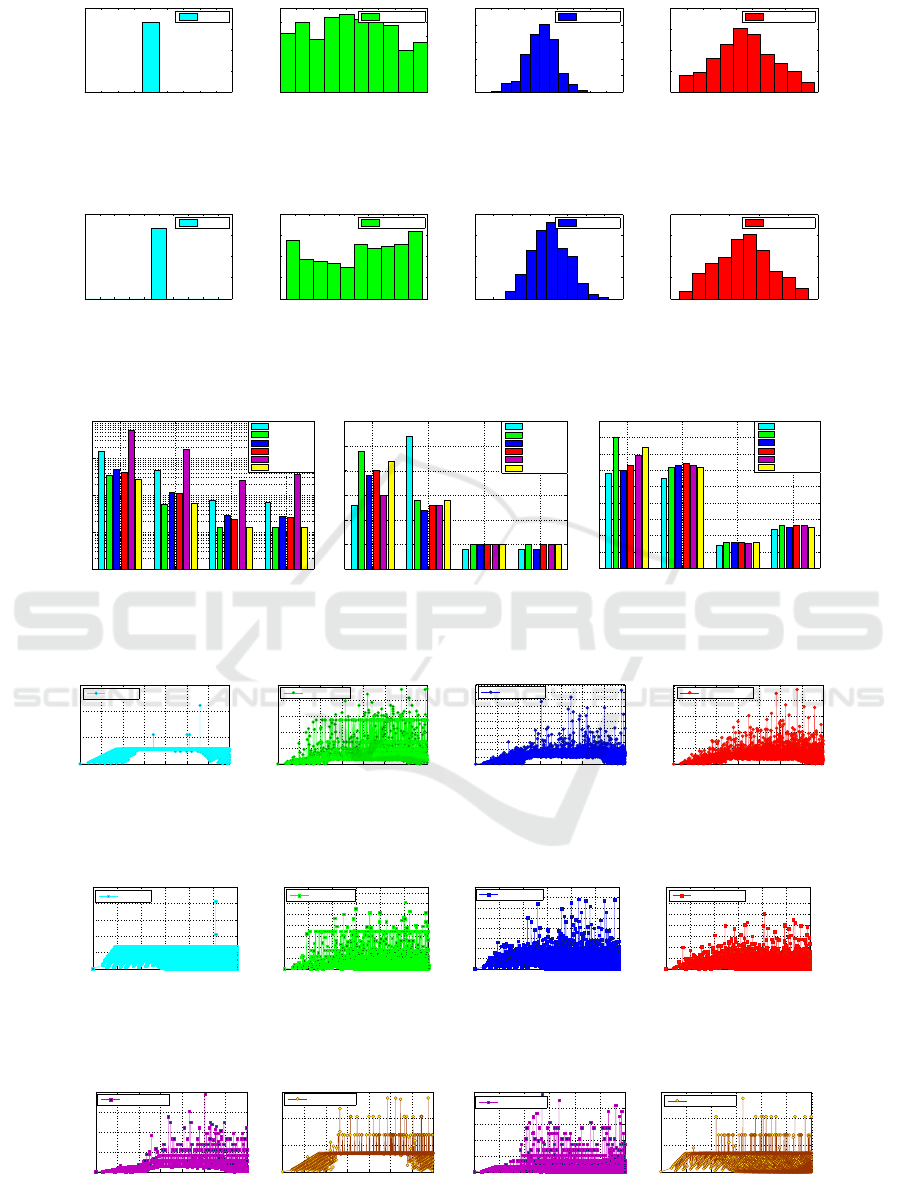
1 2 3 4 5 6 7 8 9 10
0
100
200
300
400
Beacon Transmission Rate [beacon/s]
Number of Elements
Constant
(a)
1 2 3 4 5 6 7 8 9 10
0
5
10
15
20
25
30
Beacon Transmission Rate [beacon/s]
Number of Elements
Uniform PDF
(b)
1 2 3 4 5 6 7 8 9 10
0
20
40
60
80
100
Beacon Transmission Rate [beacon/s]
Number of Elements
Normal PDF
(c)
1 2 3 4 5 6 7 8 9 10
0
20
40
60
80
Beacon Transmission Rate [beacon/s]
Number of Elements
Triangular PDF
(d)
Figure 3: Distribution of beacon transmission rate of a generic vehicle of the scenario: a) Constant, b) Uniform, c) Normal,
d) Triangular.
45 46 47 48 49 50 51 52 53 54 55
0
100
200
300
400
Beacon Transmission Power [mW]
Number of Elements
Constant
(a)
0 10 20 30 40 50 60 70 80 90 100
0
10
20
30
40
Beacon Transmission Power [mW]
Number of Elements
Uniform PDF
(b)
10 20 30 40 50 60 70 80 90
0
20
40
60
80
Beacon Transmission Power [mW]
Number of Elements
Normal PDF
(c)
0 20 40 60 80 100
0
20
40
60
80
Beacon Transmission Power [mW]
Number of Elements
Triangular PDF
(d)
Figure 4: Distribution of beacon transmission power of a generic vehicle of the scenario: a) Constant, b) Uniform, c) Normal,
d) Triangular.
Spider Grid Highway Urban
10
0
10
1
10
2
10
3
10
4
Packet Collisions
Constant
Uniform PDF
Normal PDF
Triangular PDF
Kloiber − var1
Kloiber − var2
(a)
Spider Grid Highway Urban
0
5
10
15
20
25
30
Hidden Nodes
Constant
Uniform PDF
Normal PDF
Triangular PDF
Kloiber − var1
Kloiber − var2
(b)
Spider Grid Highway Urban
0
10
20
30
40
50
60
70
80
90
Vehicles in LDM
Constant
Uniform PDF
Normal PDF
Triangular PDF
Kloiber − var1
Kloiber − var2
(c)
Figure 5: Performance of the dynamic beaconing strategies in the different scenarios: a) Packet collisions, b) Hidden nodes,
c) Vehicles in LDM.
0 10 20 30 40 50 60 70
0
5
10
15
Time [s]
Average Position Error [m]
Constant
(a)
0 10 20 30 40 50 60 70
0
5
10
15
20
25
Time [s]
Average Position Error [m]
Uniform PDF
(b)
0 10 20 30 40 50 60 70
0
2
4
6
8
10
12
14
16
18
20
22
Time [s]
Average Position Error [m]
Normal PDF
(c)
0 10 20 30 40 50 60 70
0
5
10
15
20
25
Time [s]
Average Position Error [m]
Triangular PDF
(d)
Figure 6: Average position error computed by a generic vehicle in the Highway scenario: a) Constant, b) Uniform, c) Normal,
d) Triangular.
0 10 20 30 40 50 60
0
1
2
3
4
5
Time [s]
Average Position Error [m]
Constant
(a)
0 10 20 30 40 50 60
0
2
4
6
8
10
12
14
Time [s]
Average Position Error [m]
Uniform PDF
(b)
0 10 20 30 40 50 60
0
1
2
3
4
5
6
7
Time [s]
Average Position Error [m]
Normal PDF
(c)
0 10 20 30 40 50 60
0
2
4
6
8
10
12
Time [s]
Average Position Error [m]
Triangular PDF
(d)
Figure 7: Average position error computed by a generic vehicle in the Urban scenario: a) Constant, b) Uniform, c) Normal,
d) Triangular.
0 10 20 30 40 50 60 70
0
5
10
15
20
Time [s]
Average Position Error [m]
Kloiber − var1
0 10 20 30 40 50 60 70
0
10
20
30
Time [s]
Average Position Error [m]
Kloiber − var2
(a)
0 10 20 30 40 50 60
0
2
4
6
8
10
Time [s]
Average Position Error [m]
Kloiber − var1
0 10 20 30 40 50 60
0
5
10
15
Time [s]
Average Position Error [m]
Kloiber − var2
(b)
Figure 8: Average position error computed by a generic vehicle using Kloiber’s approaches in: a) Highway, b) Urban.
Dynamic Beaconing using Probability Density Functions in Cooperative Vehicular Networks
641

those obtained with the uniform and triangular distri-
butions in both scenarios. Fig. 6 shows that the nor-
mal distribution outperforms the uniform and triangu-
lar distribution in terms of maximum average position
error and the number of times this position error ex-
ceeds 5 m. In the urban scenario (see Fig. 7), thesame
behavior is observed, with the normal distribution the
maximum average position error does not exceed 7
m and the highest number of average position errors
is concentrated below 3 m. It could be thought that
the use of a fixed transmission rate of 10 beacon/s in
the Kloiber - var1 approach would lead to a small av-
erage position error. However, Fig. 8a and Fig. 8b
illustrate the noxious impact of packet collisions on
perceived position error. In both scenarios the recur-
ring packet collisions lead to several harmful position
error, computing in the Highway and Urban scenarios
a maximum average position error of 19 m and 9 m,
respectively. The Kloiber - var2 approach achieves a
low number of packet collisions (see Fig. 5a). How-
ever, the use of a low transmission rate (2 beacon/s)
leads to high average position error in both scenarios,
as can be seen in Fig. 8.
5 CONCLUSIONS AND FUTURE
WORKS
In this paper, we evaluated the performance of dif-
ferent dynamic beaconing strategies that use PDFs
to randomize beacon transmission parameters. The
performance of the beaconing strategies was evalu-
ated through a realistic simulation framework in four
different vehicular scenarios. The simulation results
showed that some PDFs are more convenient than
others for certain scenarios. The beaconing strategy
based on uniform PDF is convenient in scenarios with
high vehicle density and low relative speed, whereas
a beaconing strategy based on normal PDF is suitable
in scenarios with high relative speed and low vehicle
density. The uniform distribution allows to reduce re-
curring interferences while the low speed of the vehi-
cles does not significantly impact on the real average
position error computed by neighboring vehicles. On
the other hand, by adjusting the mean in the normal
distribution it is possible to reduce the average posi-
tion error perceived in high speed scenarios, while the
low density of vehicles reduces the noxious impact of
packet collisions. In future works, we intend to de-
velop an adaptive beaconing algorithm, where PDFs
be selected and adjusted, according to the vehicu-
lar context and/or the communication requirements of
safety applications.
ACKNOWLEDGEMENTS
The authors acknowledge the financial support of
CONICYT Doctoral Grant No. 21171722; Project
ERANET-LAC ELAC2015/T10-0761; FONDECYT
Postdoctoral Grant No. 3170021; as well as FONDE-
CYT Iniciaci´on 11140045.
REFERENCES
Aygun, B., Boban, M., and Wyglinski, A. (2016). ECPR:
Environment-and Context-aware Combined Power
and Rate Distributed Congestion Control for Vehic-
ular Communications. Computer Communications,
93:3–16.
Boban, M. and d’Orey, P. M. (2016). Exploring the Practical
Limits of Cooperative Awareness in Vehicular Com-
munications. IEEE Transactions on Vehicular Tech-
nology, 65(6):3904–3916.
Eckhoff, D. and Sommer, C. (2012). A Multi-Channel
IEEE 1609.4 and 802.11p EDCA Model for the Veins
Framework. In 5th ACM/ICST SIMUTools Interna-
tional Conference.
ETSI (2014). Intelligent Transport Systems (ITS); Vehicu-
lar Communications; Basic Set of Applications; Part
2: Specification of Cooperative Awareness Basic Ser-
vice, TS 302 637-2 (V1.3.2).
IEEE (2016). Standard for Information technology - Part
11: Wireless LAN Medium Access Control (MAC)
and Physical Layer (PHY) Specifications. IEEE Std
802.11-2016 (Revision of IEEE Std 802.11-2012),
pages 1–3534.
Kloiber, B., Hrri, J., and Strang, T. (2012). Dice the TX
power - Improving Awareness Quality in VANETs by
random transmit power selection. In IEEE Vehicular
Networking Conference (VNC), pages 56–63.
Sepulcre, M., Gozalvez, J., Altintas, O., and Kremo, H.
(2016). Integration of Congestion and Awareness
Control in Vehicular Networks. Ad Hoc Networks,
37:29–43.
Shah, S. A., Ahmed, E., Xia, F., Karim, A., Shiraz, M., and
Noor, R. M. (2017). Adaptive beaconing approaches
for vehicular ad hoc networks: A survey. IEEE Sys-
tems Journal, PP(99):1–15.
Sommer, C., German, R., and Dressler, F. (2011). Bidirec-
tionally coupled network and road traffic simulation
for improved ivc analysis. IEEE Transactions on Mo-
bile Computing, 10(1):3–15.
Sommer, C., Joerer, S., and Dressler, F. (2012). On the
Applicability of Two-Ray Path Loss Models for Ve-
hicular Network Simulation. In IEEE Vehicular Net-
working Conference (VNC), pages 64–69.
Zemouri, S., Djahel, S., and Murphy, J. (2014). Smart
Adaptation of Beacons Transmission Rate and Power
for Enhanced Vehicular Awareness in Vanets. In 17th
International Conference on ITS (ITSC), pages 739–
746.
RESIST 2018 - Special Session on Resilient Smart city Transportation
642
