
Evaluating the Predictability of Future Energy Consumption
Application of Statistical Classification Models to Data from EV
Charging Points
Pietro Faes Belgrado
1,2
,
Ľuboš Buzna
1,3
, Federica Foiadelli
2
and Michela Longo
2
1
ERAchair for Intelligent Transport Systems, University of Žilina, Univerzitná 8215/5, Žilina, Slovakia
2
Department of Energy, Politecnico di Milano, Milan, Italy
3
Faculty of Management Science and Informatics, University of Žilina, Univerzitná 8215/5, Žilina, Slovakia
Keywords: Electric Mobility, Predictability, Energy Consumption, the Netherlands, Statistical Learning.
Abstract: The overall purpose of our study has been to evaluate the predictability of future energy consumption
analysing the electric mobility in the Netherlands. The climate and energy framework, the European energy
production and main developments, as well as the European targets and policy objectives to reduce the current
CO
2
emissions were first assessed. Then, a deeper look was taken at electric mobility and at Electric Vehicles
(EVs). The adoption and development of EVs in the European Union and charging infrastructure were taken
into account. The Dutch energy production and emissions, as well as, the mobility in the country and its
infrastructure were investigated. Previous studies about electric vehicles and charging points have addressed
the predictability of future energy consumption in larger areas to only very limited extent, so our research
work has concentrated on this gap. A large real-world dataset was used as a basis to create statistical models,
in order to study the users’ behaviour within the charging points infrastructure and to evaluate the
predictability of future energy consumption of the charging points in selected regions of the Netherlands.
Results vary across different regions with the number of charging points, but suggest that statistical models
could be useful in the management of energy production to optimize the dispatch of energy sources.
1 INTRODUCTION
The power supply has granted huge benefits for the
modern society, but it has also come with a not
negligible price tag: most of the energy is generated
from fossil fuels (coal, oil and natural gas). This
human activity is increasing the concentrations of
greenhouse gases (GHG), while it is enhancing the
greenhouse effect, which in turn is contributing to the
warming of the Earth. It is therefore crucial to reduce
GHG emissions, in order to maintain the stability of
the Earth and its climate.
The European primary energy production
includes a range of different energy sources: nuclear
energy, renewable energy sources, solid fuels (largely
coal), natural gas and crude oil. The primary energy
consumption in European countries in 2015
amounted to 1,627 million tonnes of oil equivalent
(Mtoe), while being 1.7% above the 2020 target.
Primary energy consumption in the EU-28 countries
has decreased in the past years, due to energy
efficiency improvements and the economic recession.
Moreover, the share of the energy generated from
hydro, wind and solar has been steadily increasing.
Nevertheless, fossil fuels continue to dominate
primary energy consumption, setting themselves at
72.5% in 2015. Renewable energy was 13% and the
part of nuclear energy in primary energy consumption
was 13.6% in 2015 (EEA, 2016).
In the transport sector, despite the improvements
in fuel efficiency, there have been increases in
passenger and freight transport demand. Higher
transport demand has resulted from increased
ownership of private cars, particularly in the new EU
Member States, as well as from growing settlement
and urban sprawl, leading to longer distances
travelled, and changes in lifestyle. Between 2005 and
2013, final energy consumption in the transport sector
decreased by 6% in the EU-28, but it still accounted
for 32% of total energy consumption, followed by
household sector (27%), the industrial sector (25%)
and the service sector (14%) (IEA, 2017).
Faes Belgrado, P., Buzna, L., Foiadelli, F. and Longo, M.
Evaluating the Predictability of Future Energy Consumption.
DOI: 10.5220/0006815206170625
In Proceedings of the 4th International Conference on Vehicle Technology and Intelligent Transport Systems (VEHITS 2018), pages 617-625
ISBN: 978-989-758-293-6
Copyright
c
2019 by SCITEPRESS – Science and Technology Publications, Lda. All rights reserved
617

The transport sector is therefore the main factor
responsible for air pollution in European cities, as it
produces almost a quarter of all GHG emissions.
There has been a decrease in the emissions since
2007, but they are still higher than in 1990. Road
transport, in particular, was considered responsible
for more than 70% of GHG emissions from transport
sector in 2015. The European Commission has
adopted a low-emission mobility strategy to facilitate
shift towards a low-carbon circular economy. GHG
emissions from transport should be at least by 60%
lower than in 1990 and be firmly on the path towards
zero. The strategy integrates a broader set of measures
and supports creation of jobs, economic growth,
investments and innovations. The strategy will
benefit European citizens and consumers by
improving the quality of the air, reducing the levels
of noise, lowering the levels of congestion and
ameliorating the safety (National Research Council,
2013).
Electromobility and renewable sources of energy
are technologies with significant potential to
contribute to these goals. In order to evaluate the
predictability of future energy consumption, an
analysis of electric mobility is done in this paper. In
particular, this analysis is applied to a large real-world
dataset. Studies based on the operational data from
charging station started to appear in the scientific
literature only very recently. Data collected from
mobile phones and charging stations has been
analysed and combined with mathematical modelling
to analyse the relationship between mobility
behaviour and the demand for electric energy (Colak,
2016). Regression methods were used to estimate the
driving range of electric vehicles (Fetene, 2017).
Combination of regression methods and data time
series, that characterize the charging behaviour, was
used to design a procedure how to predict the load
profile imposed on the electrical grid by individual
charging stations (Bickora, 2016). Classification
methods of statistical learning (k-nearest neighbour,
regression trees, general chi-squared automatic
interaction detector, etc.) when applied to time series
of electric energy consumption can identify
households that are charging electric vehicles with
accuracy higher than 80% (Verma, 2015). Similarly,
classification has been applied to the data from the
charging station network to analyse how the drivers
of electric vehicles use the public charging stations
and to predict their behaviour (Develder, 2016;
Sadegghianpourhamani, 2018). Regression approach
combined with characterization model based on fuzzy
numbers was applied to data coming from 255
charging stations in UK and was used to propose an
index estimating the ability of electrical power grid to
manage the future load imposed by charging electric
vehicles (Xydas, 2016). One of our goals is to apply
regression methods to maintain large interpretability
of results. Interpretability can be enhanced by the use
of methods that contain mechanisms to select
potentially relevant predictors (Taylor, 2015; Hastie,
2009; James, 2013). From the point of view of
optimization, these mechanisms and optimization
methods that can be used to solve associated
optimization problems are subject of very active
research (Bertsimas, 2016; Hastie 2017).
2 BACKGROUND
INFORMATION
Our case study is focused on the Netherlands, which
was chosen as it is one of the European countries with
the greatest developments in electric mobility in the
past years. The advanced economy of the Netherlands
is reflected also in a modern energy system and well-
developed energy markets. The strategic location
helped the country become an important transit and
trade hub for natural gas, coal, oil and electricity. The
Netherlands has significant natural gas production
and a large oil-refining industry (IEA, 2014).
The Netherlands started the transition to a low-
carbon economy by implementing broad spectrum of
measures ranging from Renewable Energy Sources
(RES), Carbon Capture and Storage in the North Sea,
and to the enhancements of the security of oil and gas
supply. The Dutch energy mix is dominated by fossil
fuels, which represent more than 90% of Total
Primary Energy Supply - TPES (IEA - Statistics,
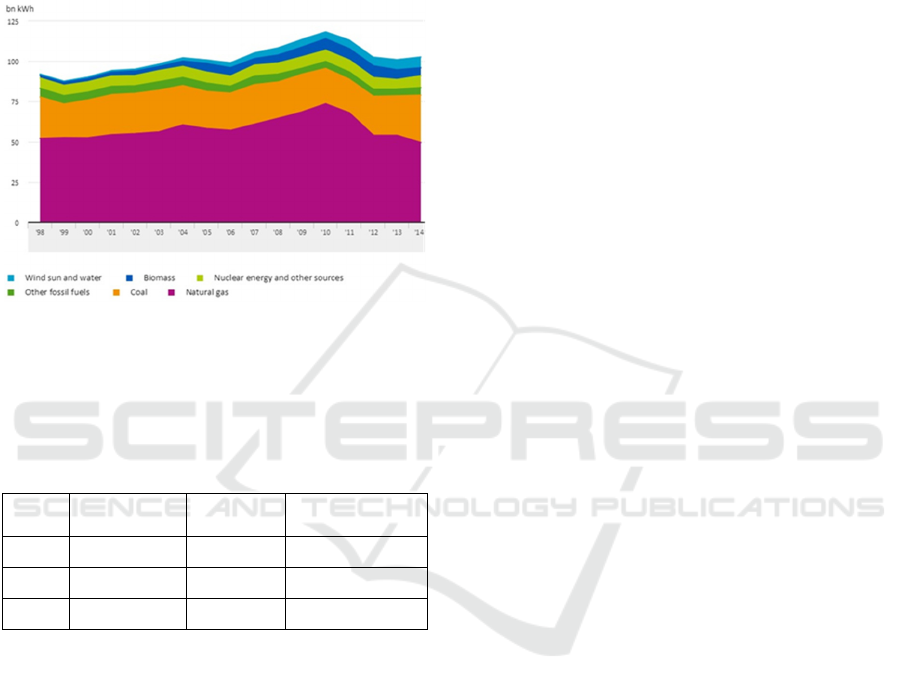
2015). In Figure 1, it is possible to observe that the
electrical energy sources have mainly been natural
gas accounting for 42% and coal with 39%, oil has
only a marginal contribution of 1.3%. In the last ten
years, the renewables sources raised a lot, reducing
the share of fossil fuels from 90.3% in 2002 to 82%
in 2015. Nuclear energy represented 3.7% in 2015.
The renewable sources in the Netherlands are mainly
biofuels 2.7%, waste 3.3% and wind 6.9% (Centraal
Bureau voor de Statistiek, 2016b).
Dutch citizens travelled on average 11,000 km in
2014. 70% of this distance was covered by car (while
nearly three-quarters of the total number of
kilometres as drivers and nearly a quarter as
passengers), 9% of the total distance was done by
train and 9% by bicycle (Centraal Bureau voor de
Statistiek, 2016a).
RESIST 2018 - Special Session on Resilient Smart city Transportation
618
The Dutch government’s desire for electric
driving is to reduce CO2 emissions, improve energy
efficiency and decrease the dependency on fossil
fuels (Netherland Enterprise Agency, 2015). Electric
vehicles also help to reduce noise pollution from
traffic, open up new opportunities for the commercial
sector and generally improve the quality of life in
cities.
Figure 1: Generation of electrical energy by source in the
Netherlands (Centraal Bureau voor de Statistiek, 2016b).
Table 1 reports for different years the number of
EVs in the Netherlands.
Table 1: Number of electric vehicles in the Netherlands.
Fully electric
(FEV)
Hybrid
(HEV)
Plug-in hybrid
(PHEV)
2015 7,400 111,800 36,750
2016 9,950 124,400 76,250
2017 13,700 136,000 95,750
There were more than 8 million cars in the
Netherlands at the beginning of 2017, almost 80% of
them run on petrol and 16% on diesel. Nearly 250,000
are electric vehicles but in this group 90% consists of
hybrid cars. There are also more than 13,000 fully
electric cars, with just the electric engine (see Fig. 2).
This number has doubled in the past two years and
there are 26,000 public or semi-public charging
points for EVs across the Netherlands, that is to say
on average 4 electric vehicles per charging point
(Centraal Bureau voor de Statistiek, 2016a).
3 MATERIALS AND METHODS
In this research, data recorded from individual
charging transactions were considered at a more
aggregated level, to give a greater picture of the
interaction between the charging point infrastructure
and the power grid network. As for modelling smart
grids, it is more important to predict how an
aggregated subset of charging points will consume
energy in a specific area, rather than to consider
single points. An extensive amount of data from a
large database gathered in the Netherlands was used
with high temporal resolution, focusing on the
variability in demand for electricity to charge electric
vehicles. This is different from previous studies,
where synthetic time-series were used because of a
small number of transactions recorded (Bessa and
Matos, 2013) or (Develder, 2016).
3.1 Dataset
The Dutch company ElaadNL (ElaadNL, 2016)
provided for this research a dataset which includes an
overview of EVnetNL historic transactions data from
January 2012 until March 2016. The dataset contains
detailed information of more than 1 million
transactions that took place at 1,747 different
charging points, which are installed over the entire
geographical area of the Netherlands. The dataset is a
big data frame (table implemented in R language)
with 17 columns and 1,060,703 rows - corresponding
to every transaction registered.
The analysis on the dataset has been done using
Rstudio - a free open source IDE (integrated
development environment) software program for
statistical analysis. There are many reasons for
choosing this kind of software, above all it has a great
availability of implemented advanced statistical
methods and algorithms and it produces very high-
quality graphs. Overall, Rstudio is a very powerful
but at the same time an easy-to-use software.
3.2 Statistical Methods
Before starting the data mining, it was necessary to
build a statistical frame. Different classification
models were considered to evaluate the predictability
of future energy consumption of the charging points.
There are many possible classification techniques, or
classifiers, that could be used to predict a qualitative
response (James, 2013). Four of the most widely-used
classifiers - logistic regression (Logistic), linear
discriminant analysis (LDA), quadratic discriminant
analysis (QDA) and k-nearest neighbours (KNN) -
were used in the study, in order to build a model to
predict () for any given value of predictors
,…,
.
Evaluating the Predictability of Future Energy Consumption
619

Rather than modelling the response directly,
logistic regression models the probability that
belongs to a particular category with the logistic
function:
p
X
1p
X
⋯
(1)
Model parameters
,….
are estimated by the
maximum likelihood method. For linear discriminant
analysis the distribution of the predictors is
modelled separately in each of the response classes
and then the Bayes’ theorem is used to flip these
around into estimates. LDA assumes that the
observations within each class are drawn from a
multivariate Gaussian distribution with a class-
specific mean vector μ and variance σ and covariance
matrix Σ that is common to all the classes. By the
symbol
is represented the prior probability that a
randomly chosen observation comes from the k-th
class. Then, LDA assigns an observation to the class
X = x for which the value:
2
log
(2)
is the largest. QDA provides the same approach
but it assumes that each class has its own covariance
matrix
.
Consequently, Eq. (2) generalizes to:
1
2
1
2
log
|
Σ
|
(3)
The KNN classifier, given a positive integer
and a test observation
, first identifies the points
in the training data that are closest to classified
observation
within the neighbourhood
. Finally,
KNN applies Bayes rule and classifies the test
observation
to the class k with the largest
probability given by:
Pr
|
1
(4)
where
is indicator function that equals 1
if
and 0 otherwise.
3.2.1 Shrinkage Methods
In order to enhance the prediction accuracy and
interpretability of the statistical model, Lasso method
(least absolute shrinkage and selection operator) was
implemented (Taylor, 2015). It is a shrinkage method
that performs both variable selection and
regularization. In this way, it is possible to select the
most significant predictors and to eliminate those that
do not contribute to the improvement of the forecast,
obtaining at the end a lower test error. A model can
be fitted containing all predictors and then select a
subset of them using Lasso that constrains or
regularizes the coefficient estimates, or equivalently,
that shrinks the coefficient estimates towards zero.
4 RESULTS
4.1 Basic Analysis of the Dataset
Having built the statistical frame, the dataset
“Transactions” provided by ElaadNL was analysed.
Four of the seventeen columns were selected:
ChargePoint ID, Connector ID, Lat (latitude) and Lon
(longitude) to create a map of the Netherlands with
the positions, distinguishing the charging points with
one connector from those with two connectors. 613
out of the 1,747 charging points contained in the data
frame are with one connector while 1,134 are with
two connectors. The charging points are well
distributed across the entire territory of the country,
while the majority of them is situated within or close
to the major cities as shown in Figure 2.
Figure 2: Positions of charging points with 1 and 2
connectors derived from the dataset.
RESIST 2018 - Special Session on Resilient Smart city Transportation
620
Next, columns from the “Transactions” data frame
were selected, in order to describe the use of
individual charging points: Connected Time, Charge
Time and Idle Time. It was observed from data that
in most cases, the number of transactions is lower
than one thousand and the Connected Time is less
than 10 hours, with a strong presence transactions that
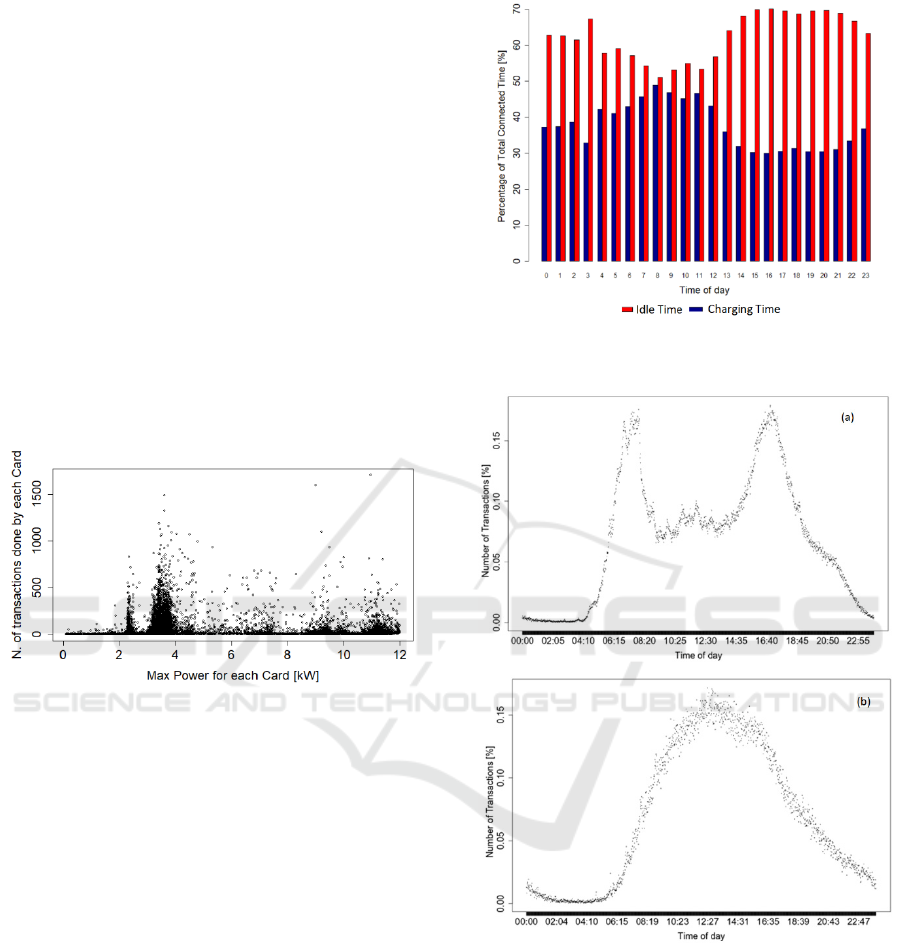
lasted up to 5 hours. Comparing the maximum power
recorded during the transaction in terms of kW and
the total number of transactions for each customer
card, Figure 4 was obtained. Four power categories
are clearly coming out from the scatter plot. The first
category is slightly above 2 kW, the second stays
between 3 and 4 kW, the third about 9 kW and the last
one about 11 kW. Figure 3 gives also rough picture of
the types of vehicles that are utilizing public charging
stations; most of them with a maximum power around
3 kW, that is the typical value for hybrid plug-in
electric vehicles.
Figure 3: Maximum power observed for each customer card
compared to the number of transactions done.
Considering all the points together, the recharge
time was then analysed throughout the course of the
day as represented in Figure 4. For more than half of
the time, when the charging points were connected to
the vehicles, they were not recharged, but simply
occupied a parking position because the state of
battery had already reached the maximum charge. At
a first glance, it is clear that such behaviour of EV
drivers is not favourable.
Figure 5 shows the trend obtained when
considering all charging transaction done within the
period starting from January 2012 to March 2016.
The pattern formed by the initial time of charging
sessions over the course of the working day and
weekends are compared in Figure 5. Working days
follow a completely different pattern than weekends.
During the working days, two peaks are very evident,
the first is at about 7:30, the second is at about 17:30.
Between 9:00 and 15:00 it is possible to observe
approximately constant trend. Over the weekends, it
is completely different: most of the charging
Figure 4: Charge Time and Idle Time as a percentage of the
Connected Time analysed within the course of the day.
Figure 5: Initial time of charging sessions during (a) the
working days and (b) weekends.
transactions start at 13:00, with a wider peak, which
lasts from 10:30 to 15:30.
After taking the look at the charging points, the
users were brought into focus. In the database
“Transactions” there are two records for each
charging session: StartCard and StopCard, that can
be used to attribute charging session to individual
RFID card holders. Having observed that the total
amount of users (customer cards) is 53,850, the
behaviour of the different users was analysed. The
Evaluating the Predictability of Future Energy Consumption
621
first step was to find out the first use and the last use
of the single card, in order to underline how long it
was used during the period between January 2012 and
March 2016.
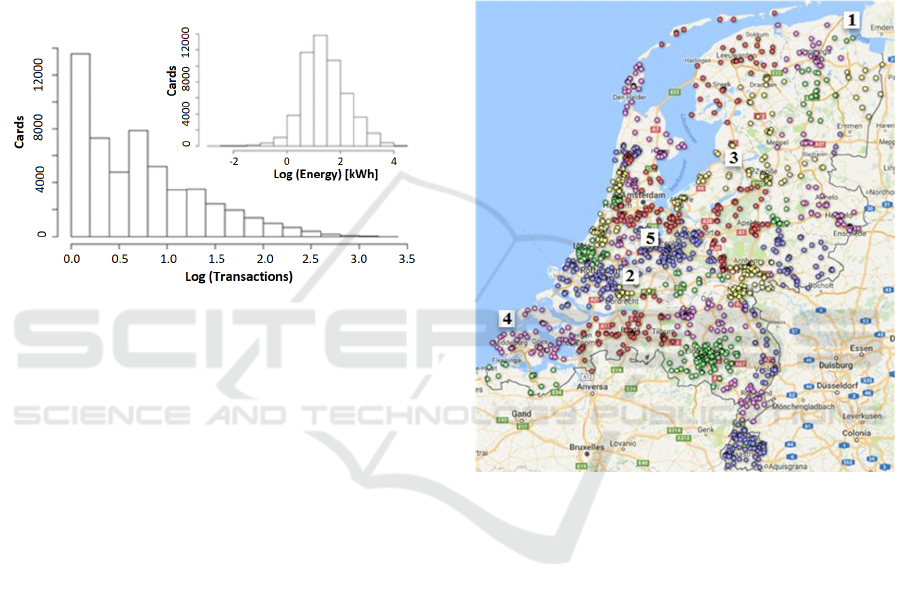
Significant number of cards (about 15,000) were
used only once. Considering the number of
transactions for each unique card, it was possible to
see that the majority of the cards were used only for
few charging sessions during the period considered:
95% of the cards did less than 100 transactions. In
Figure 6, it is possible to observe that the cards with
a large consumed energy constitute only a small
number and a focus is on the energy consumed.
Figure 6: Number of customer cards as a function of the
total number of realised transactions. The inset shows the
dependency on the consumed energy.
4.2 Predictability of Energy
Consumption
To aggregate the power consumed by individual
charging points the following step was to extract from
the coordinates (latitude and longitude) of the single
charging point the address where each charging point
is located. From the address the corresponding
municipality was obtained and then associated with
the COROP region it belongs to. The COROP are the
Dutch sub-regions traditionally used in the spatio-
statistical research. The association of charging points
to COROP regions is shown in Figure 8, while
different colours are used, depending on the region.
Five out of the 40 COROP regions were selected,
based on the number of charging points available, to
represent broad range of values. In Figure 7, it is
possible to identify different zones, in particular:
Delfzijl en omgeving indicated with number 1 (3
charging points);
Zuidoost-Zuid-Holland indicated with number 2
(20 charging points);
Flevoland indicated with number 3 (41 charging
points);
Overig Zeeland indicated with number 4 (57
charging points);
Utrecht indicated with number 5 (172 charging
points).
Through the association of charging stations with
the regions it was possible to extract the aggregated
trend of the energy consumption for the recorded
period (January 2012 - March 2016). The next step
was to restrict five selected benchmarks to the years
2014, 2015 and 2016. This choice was made because
during these years the number of transactions is more
substantial.
Figure 7: Charging points associated to COROP regions.
With the resolution of days, the transactions
carried out on the charging points of a given COROP
region were grouped: the 819 rows, each
corresponding to one day, were recorded with the
following structure of columns: Total Electric Energy
Consumed, Total Connected Time (in hours), Total
Idle Time (in hours), Total Transactions performed
during a day, Total Number of single cards used
during the day and Total Number of Charging Points
used during the day (thus, overall 6 columns). Some
auxiliary columns were subsequently added: the Total
Electric Energy Consumed, the Connection Time and
the Idle Time for each of the 7 days preceding the
concerned day. In addition, the total number of
customer cards used and the number of transactions
made in the previous two days were considered,
resulting in 25 new auxiliary columns.
As the output or response was considered the
binary forecast of the increase (1) or decrease (0) in
RESIST 2018 - Special Session on Resilient Smart city Transportation
622
energy consumption compared to the previous day.
Thus, a column was added that indicates whether the
total energy consumption of a day was higher or
lower than the day before. This column is called
direction. Values 1 and 0 are the two classes
considered in the statistical methods.
Statistical models estimate the probability that
with a set of predictor variables, the unknown
response belongs to one rather than to the other class.
Basic statistical classification methods, described
in Section 3.2, were applied to each of the five
benchmarks, to find out which method is producing
the lowest test error (James, 2013). For the KNN
method, two versions were considered. First, version
denoted KNN (K=5), where the value of parameter K
was set to 5 and KNN opt, where 10-fold cross
validation method (James, 2013) was used, to find the
value K leading to the minimum value of the test
error. Furthermore, two extended versions of the
methods were considered. First, the logistic
regression was combined with the Lasso shrinkage
and the second, in addition, it was followed either by
the KNN opt (denoted as Logistic Lasso KNN opt) or
LDA (denoted as Logistic Lasso LDA) depended on
what resulted in lower test error. To evaluate the test
error, predicted directions for the future energy
consumption were calculated and evaluated using 10-
fold validation method.
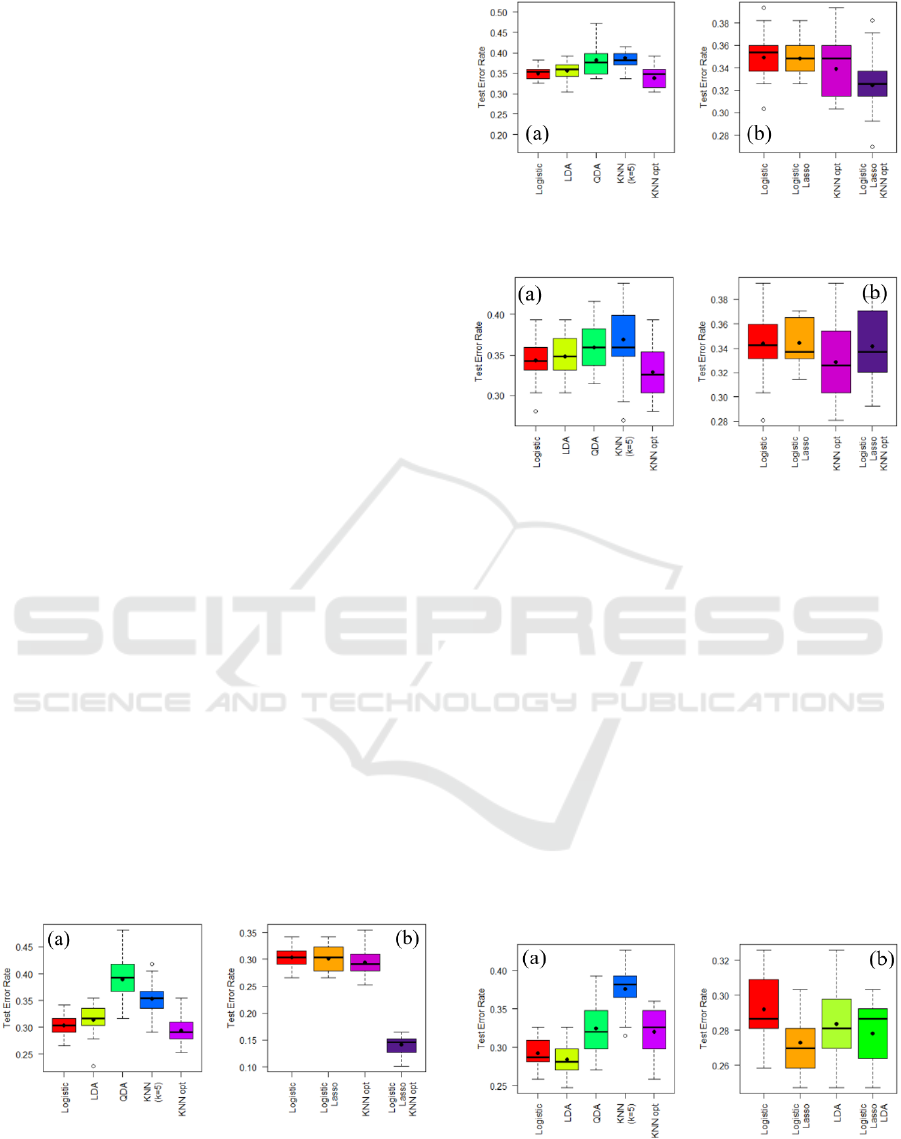
Figures 8, 9 and 10 show the test error rates
considering the region of Delfzijl en omgeving,
Zuidoost-Zuid-Holland and Flevoland. In particular,
in the case (a) are reported the five basic classification
methods and in the case (b) are reported results of two
extended methods (logistic regression combined with
the Lasso shrinkage and logistic regression combined
with the Lasso shrinkage and followed by the optimal
KNN method). To facilitate the comparison between
extended and related basic methods the performance
of basic methods is again shown in panel (b).
Figure 8: Region of Delfzijl en omgeving with (a) five basic
classification methods and (b) two extended methods.
Figure 9: Region of Zuidoost-Zuid-Holland with (a) five
basic classification methods and (b) two extended methods.
Figure 10: Region of Flevoland with (a) five basic
classification methods and (b) two extended methods.
Average test error rates for logistic regression
range from 0.19 to 0.35. On the smallest benchmarks,
Delfzijl en omgeving, Zuidoost-Zuid-Holland, and
Flevoland the logistic regression performed well,
however, better results were obtained through KNN
opt (see Figures 8a – 10a).
In opposite, for the other 2 benchmarks: Overig
Zeeland and Utrecht a slightly better performance
was gained with the logistic regression method (see
Figures 11a – 12a). As expected, KNN opt always
showed
better results than KNN (K = 5), and
corresponding test error was the lowest among all
basic methods for the first three datasets.
Performance of LDA is systematically better than
QDA, which is inferior when compared to all basic
methods, indicating an overfitting.
Figure 11: Region of Overig Zeeland with (a) five basic
classification methods and (b) two extended methods.
Evaluating the Predictability of Future Energy Consumption
623

Figure 12: Region of Utrecht with (a) five basic
classification methods and (b) two extended methods.
Logistic regression was further implemented for
all the datasets together with the shrinkage method, in
order to evaluate the most relevant variables among
the 25 considered and possibly improve the accuracy
of predictions. For the first dataset, leaving out
predictors leads to only very small improvement of
the Logistic regression. However, when applying
KNN opt to the shrunken model (in this case the
model was reduced by Lasso to only one predictor:
the Total Electric Energy Consumed with the lag of
one day) there was a significant improvement making
the error fall below 15%. This is very good result, but
unfortunately it was obtained only if consumption of
only three charging stations was aggregated together
and often less than ten transactions were recorded
during the day, thus the energy consumption was also
very small (see Figure 8). Such situations are not so
relevant from the point of view of smart grid control.
Nevertheless, apart from this exceptional case,
logistic regression finds systematically the lowest test
error for the last benchmark, where the consumption
of the largest number of charging points (172) was
aggregated together. This is aligned with the
expectation that higher aggregation leads to higher
predictability. Moreover, it has also practical
implication as predicting higher loads in smart grids
can be more relevant in the planning and management
of load dispatch. For the last benchmark, the Logistic
regression combined with Lasso shrinkage identified
as the most relevant predictors: Total Electric Energy
Consumed with the lag of 1 and 7 days, Total
Connected Time with the lag of 2, 6 and 7 days, and
Total Idle Time with the lag of 1 day. Interestingly,
most often, relevant predictors have lag of 1 or seven
days. Predictors selected by the Lasso method differ
from one benchmark to another. However, one which
was always present is the Total Electric Energy
Consumed in the previous day. Since the selected
predictors varied among the 25 initially considered,
even the values of coefficients were significantly
different across benchmarks.
5 CONCLUSIONS
The Dutch energy framework and the electric
mobility were investigated using data collected
within the large network of charging stations. The
Netherlands is steadily working towards replacement
of vehicles powered by traditional fossil fuels to build
a future with significantly higher share of electric
vehicles. For such a progressive country - with a low
average length of daily journeys by private cars and a
high number of commutes made by bicycle or public
transportation - this could be possible in a close
future.
The need to develop more and more charging
infrastructure for electric mobility requires a detailed
studies of energy consumption on already existing
charging points. As an initial step, predictive models
to estimate the trend in the electricity consumption
one day ahead were built. At first glance, it seems that
the data used during the study - the charging
transactions done over three years - can be useful to
approach this objective. The models managed to
assess well the trends in five Dutch regions, although
with different results. In summary, three main
interesting findings arose from the analysis:
• It is shown that different models are more suitable
in fitting the data depending on the region (level
of aggregation). Most often, logistic regression or
its combination with other method was found as
the most successful method.
• The average test error ranges from 0.19 to 0.39.
By increasing the number of charging stations
aggregated in the analysed energy consumption
signal, the test error tends to decrease. Thus, the
idea to aggregate the charging points leads to the
higher accuracy of predictions.
• As the most important variables for the
predictions, were identified variables with the lag
of 1 or 7 days, indicating the importance of the
most recent history and the role of the week cycle.
Obtained results and the need for more efficient
management of energy production in future smart
grids justifies further studies where energy
consumption could be modelled in a more detailed
way, e.g. by introducing multi-class classification
models to predict the amount of energy consumed on
hourly basis.
ACKNOWLEDGEMENTS
This work was supported by the research grants
VEGA 1/0463/16 ”Economically efficient charging
RESIST 2018 - Special Session on Resilient Smart city Transportation
624

infrastructure deployment for electric vehicles in
smart cities and communities”, APVV-15-0179
”Reliability of emergency systems on infrastructure
with uncertain functionality of critical elements”, by
the Alan Turing Institute, call for collaboration in the
Lloyd’s Register Foundation Programme to support
data-centric engineering under grant number LRF16-
05, and it was facilitated by the FP 7 project ERAdiate
[621386]”Enhancing Research and innovation
dimensions of the University of Žilina in Intelligent
Transport Systems”. We thank to Marcelo Masera
(EC, JRC in Petten) and to Nazir Refa (ELAADNL)
for enabling the access to the dataset.
REFERENCES
Bertsimas D., King A. and Mazumder, R. (2016), Best
subset selection via a modern optimization lens, The
Annals of Statistics 44 (2), 813–852.
Bessa, R. J. and Matos, M. A. (2013) ‘Global against
divided optimization for the participation of an EV
aggregator in the day-ahead electricity market. Part II:
Numerical analysis’, Electric Power Systems Research.
Elsevier B.V., 95, pp. 309–318. doi:
10.1016/j.epsr.2012.08.013.
Bickora C., Refa N., Verheijen L. and Weiland S. (2016),
Prediction of availability of charging rate at charging
stations for electric vehicles, IEEE International
Conference on Probabilistic Methods Applied to Power
Systems, DOI: 10.1109/PMAPS.2016.7764216.
Centraal Bureau voor de Statistiek (2016a) Transport and
Mobility 2016. The Hague. Available at:
http://acceleratingtransitions.eu/content/uploads/2014/
10/Factsheet_6_Transport_and_mobility.pdf.
Centraal Bureau voor de Statistiek (2016b).
Colak S., Kara E. C., Moura S. J. and Gonzalez M. C.
(2016): Coupling Electric Vehicle Charging with Urban
Mobility, review and resubmit in Nature Energy,
(http://humnetlab.mit.edu/wordpress/publications/).
Develder Ch., Sadegghianpourhamani N., Strobbe M. and
Refa N. (2016), Quantifying flexibility in EV charging
as DR potential: Analysis of two real-world data sets,
IEEE International Conference on Smat Grid
Communications, DOI: 10.1109/ SmartGridComm.
2016.7778827.
EEA (2016) Trends and projections in Europe 2016 -
Tracking progress towards Europe’s climate and energy
targets. Copenhagen. doi: 10.2800/93693.
ELAAD (2016). Data has been provided by
https://www.elaad.nl/.
Fetene G.M., Kaplan S., Mabit S.L., Jensen A.F. and Prato
C.G., (2017), Harnessin bif data for estimating the
energy consumption and driving range of electric
vehicles, Transportation Reserach Part D 54, pp. 1-11,
2017.
Hastie T., Tibshirani R. and Friedman J. (2009), The
elements of statistical learning: Data mining, Inference
and Prediction, Springer-Verlag New Yourk, ISBN
978-0-387-84857-0.
Hastie T., Thibshirani R. and Tibshirani R.J. (2017),
Extended comparison of best subset selection, forward
stepwise selection and the Lasso,
https://arxiv.org/pdf/1707. 08692.pdf.
IEA (2014) The Netherlands 2014.
IEA (2017) Key world energy statistics. OECD/IEA.
IEA - Statistics (2015). Available at:
https://www.iea.org/statistics/statisticssearch/report/?c
ountry=NETHLAND=&product=indicators
(Accessed: 5 November 2017).
James G., Witten D. and Hastie T. and Thishirani R. (2013),
An introduction to statistical learning: with
Applications in R, Springer Science + Business Media,
I SBN 978-1-4614-7137-0.
National Research Council (2013) Transitions to
Alternative Vehicles and Fuels. Washington, D.C.:
National Academies Press. doi: 10.17226/18264.
Netherland Enterprise Agency (2015) ‘We are the
Netherlands , your partner in E-mobility !’ Utrecht:
Netherlands Enterprise Agency.
Sadegghianpourhamani N., Refa N., Strobbe, M. and
Develder C. (2018), Quantitative analysis of electric
vehicle flexibility, A data-driven approach,
International Journal of Electrical Power and Energy
Systems, Vol. 95, pp. 451-462.
Taylor J. and Tibshirani R.J. (2015), Statistical and
selective inference, PNAS, Vol. 112 (25), pp- 7629-
7634.
Trends in the Netherlands 2016. The Hague. Available at:
file:///C:/Users/wenka/Downloads/trends-in-the-
netherlands-2016 (1).pdf.
Verma A., Asadi A., Yang K. and Tyagi S. (2015), A data-
driven approach to identify households with plug-in
electrical vehicles (PEVs), Applied Energy 160, pp. 71-
79.
Xydas E., Marmaras Ch., CipCigan, L.M., Jenkins N.,
Carroll S. and Barker M. (2016), A data-driven
approach for characterising the charging demand of
electric vehicles: A UK case study, Applied Energy
162, pp. 763-771.
Evaluating the Predictability of Future Energy Consumption
625
