
Web Application for Model, Share and Conversion of
Entity-relationship Diagrams for Person Visually Impaired
Rafael Silva Santos da Paixão
1
and Claudia Pinto Pereira
1,2
1
School of Engineering and Information Technology, Universidade Salvador, St. Rio Tinto, 152, Feira de Santana, Brazil
2
Universidade Estadual de Feira de Santana, Av. Transnordestina, Feira de Santana, Brazil
Keywords: Digital Inclusion, Visually Impaired Person, Database Modelling, Entity-relationship Diagram, Web
Development.
Abstract: Relational databases are an essential part of modern societies. However, the graphical nature of the entity-
relationship diagram represents a barrier in the access of the visually impaired to the academic courses in
the field of Informatics. Thus, this article presents Der-Acessível, a web application designed to assist the
teaching of relational databases through the modelling, conversion and sharing of entity relationship
diagram (ERD) with accessibility options for visually impaired people.
1 INTRODUCTION
Most people perform daily activities that make use
of database systems. From financial transfers and
hotel bookings to "simple" internet searches,
databases have become essential in modern society
playing a key role in several areas in which
computers are used (Elmasri et. al., 2011; Vicci,
2014).
Understanding the basic fundamentals that relate
to the design and development of databases is a
fundamental skill for any student in the Informatics
field. Even professionals, who are not directly
connected to the area, need to have basic knowledge
in order to communicate their needs related to the
data that may be necessary in any system to be
developed for them.
According to data from the 2010 Census of
Brazil, released by the Secretaria de Direitos
Humanos da Presidência da República (2012),
18.6% of the brazilian population had some type of
visual impairment, and only 6.7% of brazilians with
any type of disabilities completed an academic
graduation. In addition to these facts, visually
impaired students feel disadvanteged because they
do not have access to the same resources as other
colleagues in the same time frame (Mazzoni et. al.,
2001).
The constructivist perspective of informatics in
education corresponds to the application of the
computer as an auxiliary tool for the learning
process. Within it, the machine is a resource that
allows problem solving and idea building and has,
among its benefits, the possibility of developing the
autonomy of the students' own learning (Brito et. al.,
2012).
The use of informatics in special education is not
only about adapting the equipment, but also
allowing students to be creative, offering a teaching-
learning environment. Even the role of the teacher is
transformed, and becomes "the facilitator of the
process by which the student has the possibility to
contribute" (Santarosa et. al., 2003).
According to Carvalho (2001), the difficulties
faced by the visually impaired student in accessing
academic education can be classified as barriers of:
acceptance, communication, space and learning. The
solutions to overcome these problems involve the
adaptation of the procedures to the needs of the
special student without changing their objectives and
the implementation of interfaces, with minimal
modifications, that conciliate the transfer of
information between the course and the visually
impaired student. That is, instead of offering a
specially developed approach for the visually
impaired student about a didactic resource, a tool
must be offered that can connect it with the same
methodology used by other students.
It would be interesting if reflections on
methodologies and technologies for people with
visual impairment were also considered in academic
courses. For example, diagrams are widely used in
Silva Santos da Paixão, R. and Pinto Pereira, C.
Web Application for Model, Share and Conversion of Entity-relationship Diagrams for Person Visually Impaired.
DOI: 10.5220/0006784104050411
In Proceedings of the 10th International Conference on Computer Supported Education (CSEDU 2018), pages 405-411
ISBN: 978-989-758-291-2
Copyright
c
2019 by SCITEPRESS – Science and Technology Publications, Lda. All rights reserved
405

computer science courses, especially when it comes
to relational database, where the diagram-entity
relationship is well established.
There are many softwares that assist students and
professionals in the conceptual development of
database design through dynamic graphical
interfaces, however these interfaces are often
incompatible with screen readers and require some
extra configuration, factors that make it difficult for
users with visual impairments (Guedes et. al, 2016).
Presented by Magalhães et. al., (2010),
AprenDER is a tool for designing ERDs with
acessibility options for users with visual
impairments, as an integrated screen-reader and
navigation based on the numeric keypad. But it
requires an installation process, is only available to
Windows, has a hard limit to 9 entities per diagram,
and 5 attributes for each entity.
Thus, this paper presents a website designed to
assist the teaching-learning process of relational
databases by manipulating entity-relationship
diagrams with acessibility options for visually
impaired people. The application, that is called Der-
Acessível (and can be translated to “Acessible
ERD”), offers a graphical and a textual interfaces for
editing the diagram, share and conversion options,
integrated screen-reader and optimized keyboard
navigation. Still in development, the current phase
involves usability testing with real users, which
requires a certain bureaucratic process to satisfy the
brasilian legislation.
2 RELATIONAL DATABASE
COURSE
In Brazil, database courses are mandatory for all
technical courses and academic graduations in the
field of Informatics. This section, presents the basic
concepts for relational databases and the use of the
ERD during the conceptual project.
2.1 Database Design
According to Elmasri et al., (2001), the design of a
database can be divided into the following steps:
specification and analysis of requirements,
conceptual design, logical design and physical
design. The specification of the requirements
consists of understanding the problem to be solved
and contextualizing the system with the medium
where it will be inserted.
The detailing of entities, relationships and
constraints occurs in the next step. Created by Chen
(1976), the entity-relationship model, is the most
popular technique for the development of the
conceptual design. Chen also defined a visual
representation for this model, which has come to be
known as entity-relationship diagram.
Introduced by Codd (1970), the relational model,
widely used for logical design, describes the
database as a collection of relations and the
representation is closer to the structure of a table.
The structured query language (SQL) is currently
defined by international standards organizations.
This is the most used technique for physical design
and approaches the source code structure used in
programming.
2.2 Entity-relationship Diagram
The entity-relationship model is usually represented
by a diagram known as ERD. In addition, to being
useful in the design phase, it is also a
communication tool, since the diagrammatic
representation of the database schema is much easier
to display than the whole extension of the database
(Elmasri et. al., 2009).
As presented by Guedes et. al. (2016), in the
available web applications for drawing ERDs, there
are practically no acessibility options for visually
impaired people. Besides this fact, almost all tools
are ofered as a freemium service, which means the
user has a free limited access (just enough to get to
know the tool) and is required to pay for a
subscription in order to have full access.
3 DER-ACESSIVEL
This section presents the methodology used in the
development of the application and its main features,
among which stands out the textual interface for
browsing and editing an ERD using the keyboard
and the integrated screen reader.
3.1 Methods
The development of the proposed tool has been
happening in phases, each phase following the steps
of research, modelling, prototyping and testing.
Once a phase is completed, the result is integrated
into the main application.
The exploratory research method is indicated by
Gil (2002) so that the researcher can become
familiar with the subject. This step provided the
CSEDU 2018 - 10th International Conference on Computer Supported Education
406

theoretical basis and the discovery of free
technologies that were used in the project.
To facilitate the functionalists of sharing,
conversion and export between the interfaces, the
JSON format was chosen as the data structure for the
diagrams. This format is fast, flexible, easy for
humans to read, can be manipulated in the server
and in the client, and has simple serializable
mechanisms (Nurseitov et. al., 2017).
The prototyping model aims for fast
development, allowing the team to review the
process multiple times, which minimizes the risks of
developing a product that does not meet the real
needs (Sommerville, 2011).
The software has only been tested by the project
team. Following the Brazilian laws about scientific
research’s tests with humans, the present
development phase involves acquire the necessary
permissions for usability tests with real users.
3.2 Characteristics
The Der-Acessível requires a registration to be
acessed. But even as an anonymous user, the visitor
can change the color theme and the font-size,
navigate with the keyboard, and receive the
assistance of the integrated screen-reader.
There are many different themes available, most
of them from Bootswatch (2014). The themes can
change the colors and the typograph used in the
website. Also, the user can chose between five
different font sizes. This options affects all pages,
with the exception of the drawing area of the
graphical interface. This feature is very important,
speciall. More important than the aesthetic aspect,
these characteristics are accessibility features for
people with low vision.
After providing an email and password in the
registration form, the user can create his diagrams
using the graphical or textual interfaces. After that,
he can convert an ERD to the relational and physical
models, or send a copy of it to another user, by
providing the receiver’s email. Sharing a diagram
simple creates a copy that cannot be modify. The
owner can revogue the sharing and the receiver can
copy the diagram to his own library, so he can edit
it.
3.2.1 Integrated Screen-Reader
Using time diaries to collect data from users, Lazar
et al (2007) states the three most commons causes of
frustration to screen reader users are: page layout
causing confusing screen reader feedback, conflict
between screen reader and application, poorly
designed/unlabeled form.
To avoid this problems and also provide an
equally acessible enviroment to any user connect to
the website, an integrated screen-reader was
designed using the Speech Synthesis (W3C, 2014).
This API (Application Programming Interface)
provides an simple, but limited, way to convert text
in audio played direct by the browser. It was
necessary to develop a controller to watch the size of
the messages sended to the API (Application
Programming Interface), manage the queue of
requests generated by the user navigation and take
over the flow of the played audios.
When the user changes the navigation focus, the
controller will read the element content or the
alternative text for it, provided with a custom
attribute, slice in to small messages and add to it’s
own queue to be sended to the API. Depending on
the situation, the queue can be broken, and the new
message is instantly played.
For input fields, the integrated screen-reader will
read every typed key and, if the user stops typing for
a few seconds, the last typed word.
3.2.2 Keyboard Navigation
A script using JQuery (2017) controls the keyboard
navigation in the page. It was design to work in two
differente ways: basic navigation, for almost every
page in the app, and limited navigation, for the
textual interface. In basic navigation, it watches the
Tab key and move the focus based on a predefined
path. This way, the user will navigate first trough the
content. The arrow keys are free and will follow the
default behavior provided by the browser.
In the limited navigation, the keyboard is
“locked” to a specific area in the page. Inside the
textual interface, it is useful to provide fast cycle
through the interface options, without allowing the
user to get lost in other elements that exists in the
page. For this mode, the user can navigate with the
arrow keys and press Tab to go back to the
beginning. This functionality is better described in
the section 3.2.4.
3.2.3 Graphical Interface
Using the JointJS (2017) core library, distributed
under the Open Source Mozilla Public License, the
graphical interface allows users to create an ERD
using the mouse, through a familiar environment
that follows the pattern existing in other software.
As seen in Figure 1, there is an element’s toolbar on
the left, buttons with general options at the top, and
Web Application for Model, Share and Conversion of Entity-relationship Diagrams for Person Visually Impaired
407
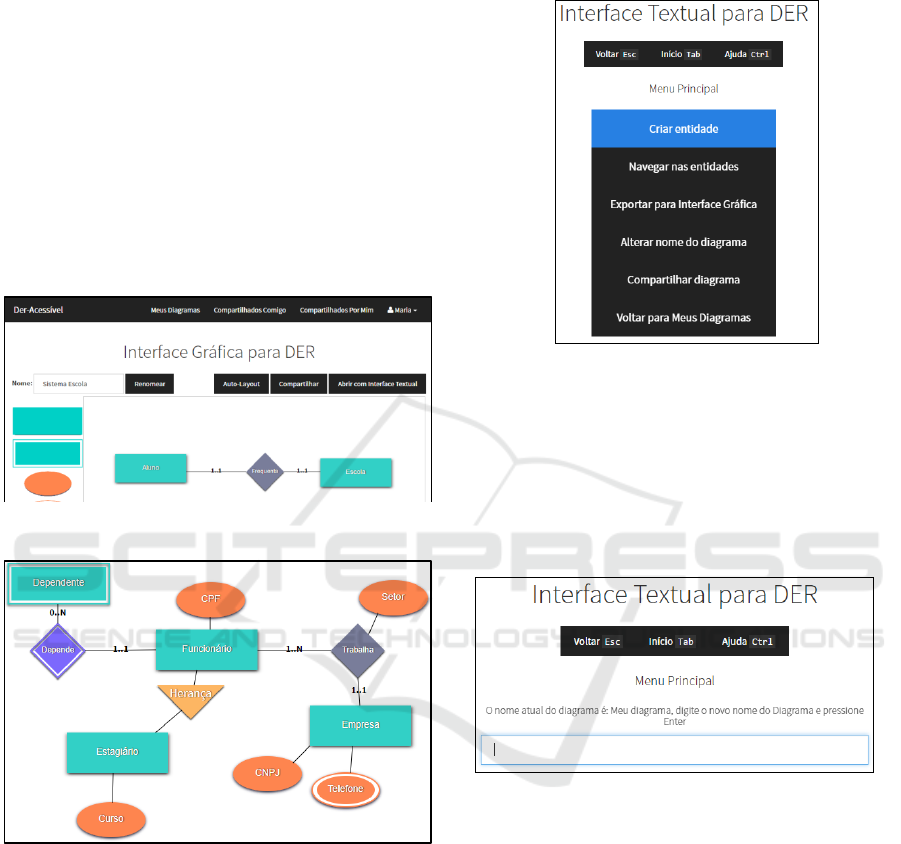
a drawing area in the middle. In Figure 2, there is a
diagram using all available types in the interface.
To prevent invalid diagrams from being exported
to the textual interface, the system does some
validation. For example, an attribute cannot exist
loose and relationships can only connect entities.
This interface also provides an auto-layout
option. Since all elements created with the textual
interface will have the same position (coordinates
[0,0], the center of the drawing area), this option
tries to reposition everything, so all elements may be
visible at once. It creates an oriented graph based on
the diagram and uses the Dagre (2017) library,
licensed under the terms of the MIT License, for
calculating the new positions.
Figure 1: The graphical interface for ERD modelling.
Figure 2: Example of diagram made with the graphical
interface.
3.2.4 Textual Interface
The textual interface is composed of dynamic menus
(Figure 3) based on the elements in the diagram,
only one menu is accessible at any time. When the
page loads, the keyboard navigation is locked to the
active menu. The user can navigate using the Up and
Down arrow keys, select an option with Enter, go
back with Esc, go directly to the home menu with
Tab and play the predefined help audio with Ctrl.
This concept was based on the automated phone
menus used by many companies in the customer
service field.
Figure 3: Main menu of the textual interface.
This interface is optimized for the integrated
screen-reader, not only reading a menu option when
the user navigates to it, but announcing the transition
between menus. As shown in Figure 4, when the
interface requires some user input, the user cannot
navigate outside of the text field using the keyboard,
except for the Esc key.
Figure 4: Option for renaming the diagram in the textual
interface.
To better explain how a visually impaired person
can read and modify a diagram using the textual
interface, the next paragraphs will describe what
happens when an empty diagram is opened, and the
user creates two entities: article and author, a
relationship between them, and the attribute “name”
for “author”. The application is localized to
Portuguese, but for simplification, we will use the
equivalent English translations for the menu options
and screen reader audio.
When the page is loaded, the main menu (from
the Figure 3) is visible at the screen and the
integrated screen-reader will say “Opened the
diagram [diagram’s name]. Main menu. Selected
CSEDU 2018 - 10th International Conference on Computer Supported Education
408
option create entity”. Pressing the enter key will load
an input like the one on Figure 4, and the integrated
screen-reader will say “Type the name of the new
entity”. While the user types the word “article”, the
integrated screen-reader will read any pressed key. If
he stops typing, but take a few seconds to confirm
with Enter, the screen-reader will say the word
“article”.
After confirming the name of the entity, the
integrated screen-reader will say “Entity article
created” and the entity’s menu will be loaded. The
integrated screen-reader will say “Menu of entity
author. Selected option change name”. Pressing the
Esc key, the user will return to the main menu and
can repeat the process and create the entity “author”.
Now, the user is in the author’s menu, pressing
the arrow down key three times he will navigate to
the option “Create relationship”, and the screen-
reader will say “Selected option create relationship”.
Using Enter to confirm, he will hear “Type a name
for the relationship”. This input works in the same
way as the one for the naming an entity. After typing
“writes” and pressing Enter, the user hear
“Relationship writes created. Menu of relationship
writes. Selected option change name” and he will
know he entered the relationship’s menu.
Pressing the arrow down key one time will make
the user hear “Selected option change element A,
actual entity author”. Pressing again, will make he
hear “Selected option set element B”. Using the
Enter key, the user will hear “Choose an element.
Selected option entity article”. There are two options
in this menu: article and author, and the user could
navigate to author to create a self-relationship.
Instead, if he presses the Enter key, he will establish
a relation between author and article. After that, he
is back in the writes’ menu.
Since the user accessed the “writes” menu
through “author”, if he press the Esc key, he will
navigate back to “author”. If he need to access
another entity, he could press Esc multiple times,
until he gets back to the main menu, or the shortcut
with the Tab key. From the main menu, he can
choose the option “Navigate through entities” to
access a menu with a list of all entities in the
diagram.
From the author’s menu, the user can navigate to
the option “Create attribute”, hear “Selected option
create attribute”, press Enter, hear “Type a name for
the attribute”, type “name”, press Enter and hear
“Attribute name created”.
3.2.5 Converting the ERD
The conversion from ERD to relational tables is
based on the algorithms explained by Heuser (2009)
and Elmasri et. al. (2011). For the prototype
presented in this article, the more general rules have
been prioritized, which work for a greater variety of
situations. A different approach could include the
situational rules resulting in a more efficient
relational model. This converter was designed to
specifically meet the requirements of the presented
web application, being developed with Javascript, so
it can be executed in the browser and using the
JSON format.
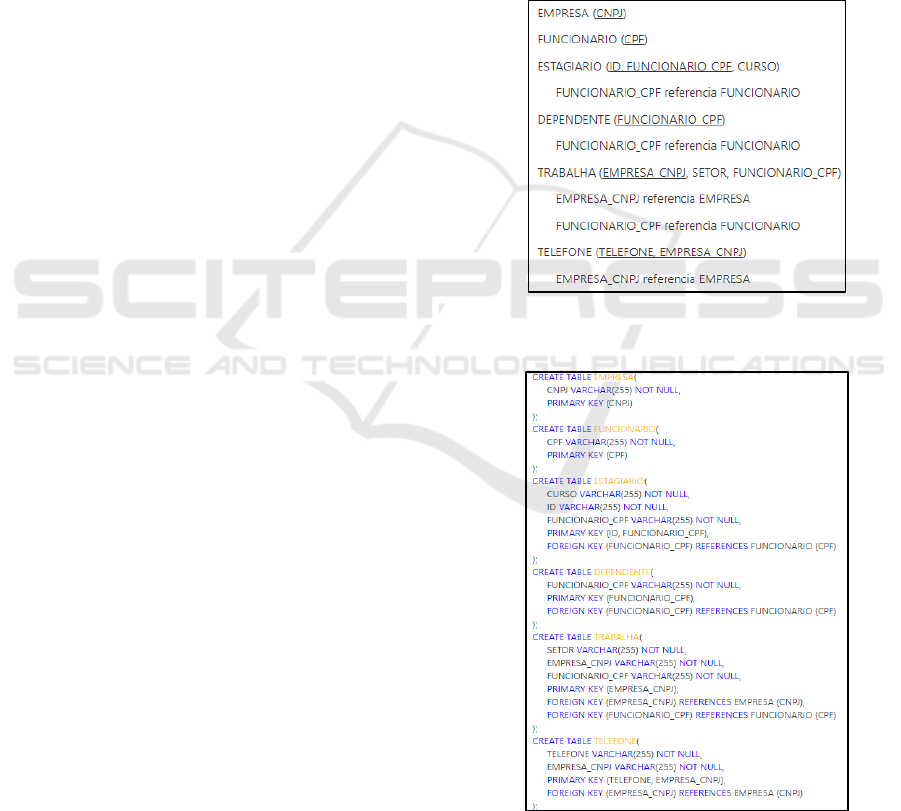
Figure 5: Visualization of the relational model generated
from the diagram in the Figure 2.
Figure 6: Visualization of the physical model generated
from the diagram in the Figure 2.
Web Application for Model, Share and Conversion of Entity-relationship Diagrams for Person Visually Impaired
409

To exhibit the result provided by the conversion,
two processors were developed: one that formats the
output as a relational scheme and another that
generates a script compatible with the database
management system MySQL. Basically, both
processors generate a HTML (Hypertext Markup
Language) fragment based on the diagram content,
in a way that, combined with CSS (Cascading Style
Sheets) rules, that fragment, when injected in the
page, produces the familiar visualization of the
relational (Figure 5) and physical models (Figure 6).
Since it is plain text, this is compatible with the
integrated screen-reader and the responsive layout.
4 CONCLUSIONS
The tool presented in this article can be capable of
demonstrating that using the computer as a
facilitator of the learning process can also include
students with special needs. Thus, it is expected that
this application, when finalized, will lower the
barriers to the access of academic courses in the
field of Informatics for visually impaired people.
In the current development phase, the team is
preparing for usability tests with real users divided
in two groups: people with visual impairment and
without. For the next phase, the addition of basic
functionalities of the virtual classroom is already
planned. Thus, teachers can create assignments for
their students and they can answer with diagrams
made in any of the available interfaces.
Additionally, for future projects there are many
possibilities, as mobile compatibility for the
graphical interface, local executable versions of the
software capable of running without internet access
(using almost the same source code) and
improvements of efficiency and customization for
the results produced by the converters.
ACKNOWLEDGEMENTS
We would like to thank the Conselho Nacional de
Desenvolvimento Científico e Tecnológico (CNPq),
the Fundação de Amparo à Pesquisa do Estado da
Bahia (Fapesb) and the Universidade Salvador
(Unifacs) for their support to this research project.
REFERENCES
Bootswatch. (2014). Bootswatch/License. (online)
Available at: https://github.com/thomaspark/
bootswatch/blob/master/LICENSE (Accessed 5 Dec.
2017).
Brito, G. S. and Purificação, I. (2012). Educação e novas
tecnologias: um (re)pensar. Curitiba: InterSaberes.
Carvalho, J.O.F. (2001). Soluções tecnológicas para
viabilizar o acesso do deficiente visual à Educação a
Distância no Ensino Superior. PhD. Universidade
Estadual de Campinas.
Chen, P. P. (1976). The entity-relationship model—toward
a unified view of data. ACM Trans. Database Syst. 1,
1 (March 1976), 9-36.
Codd, E. F. (1970). A relational model of data for large
shared data banks. Commun. ACM 13, 6 (June 1970),
377-387.
Dagre. (2014). Dagre/License. (online) Available at:
https://github.com/cpettitt/dagre/blob/master/LICENS
E (Accessed 5 Dec. of 2017).
Elmasri, R and Navathe, S. B. (2011). Sistemas de banco
de dados. Tradução por Daniel Vieira; revisão técnica
Enzo Seraphim e Thatyana de Faria Piola Seraphim.
6th ed. São Paulo: Addison Wesley.
Gil, A. C. (2002). Como elaborar projetos de pesquisa.
4th ed. São Paulo: Atlas.
Guedes, R. A., Paixão, R. S. S. and Sena, C. P. P. (2016).
Ferramenta de Apoio ao Processo de Ensino
Aprendizagem para Pessoas com Deficiência Visual
na Construção do Diagrama Entidade Relacionamento.
In: XVI Escola Regional de Computação Bahia -
Alagoas - Sergipe, 2016, Maceió - AL. Anais do
Workshop de Inclusão Digital da ERBASE
(WInDBASE). pp. 5-14.
Heuser, C. A. (2009). Projeto de Banco de Dados. 6. ed.
Porto Alegre: Bookman.
JointJS. (2017). License. (online) Available at:
http://www.jointjs.com/license (Accessed 5 Dec.
2017).
JQuery. (2017) License. (online) Available at:
https://jquery.org/license (Accessed 5 Dec. 2017).
Lazar, J., Allen, A., Kleinman, J., Malarkey, C., 2007.
What Frustrates Screen Reader Users on the Web: A
Study of 100 Blind Users. Int. J. Human–Computer
Interact. 22, 247–269.
Mazzoni, A. A., Torres, E. F. and Andrade, J. M. B.
(2001) Admissão e permanência de estudantes com
necessidades educativas especiais no ensino superior.
Acta Scientiarum Human and Social Sciences, v. 23, p.
121-126.
Magalhães, R. L. and Neto, M. M. F. (2010). AprenDER:
Ferramenta de Apoio à Construção de Diagrama
Entidade Relacionamento para Deficientes Visuais.
Rio de Janeiro: Instituto Federal Fluminense, pp.1-10.
Nurseitov, N. et al. (2009). Comparison of JSON and
XML Data Interchange Formats: A Case Study. Caine,
v. 2009, pp. 157-162.
SDH/PR - Secretaria de Direitos Humanos da Presidência
da República. (2012) Cartilha do censo 2010 - Pessoa
com deficiência. Brasília.
Sommerville, I. (2011). Engenharia de Software. Tradução
por Ivan Bosnic e Kalinka G. de O. Gonçalves;
CSEDU 2018 - 10th International Conference on Computer Supported Education
410

revisão técnica Kechi Hirama. 9. ed. São Paulo:
Pearson Hall.
Santarosa, C., Sonza, A.P. (2003). Ambientes digitais
virtuais: acessibilidade aos deficientes visuais, in: 1o
Ciclo de Palestras Sobre Novas Tecnologias Na
Educação. CINTED-UFRGS, Porto Alegre.
Vicci, C. (2014). Banco de dados. São Paulo: Pearson
Education do Brasil.
W3C. (2014). Web Speech API Specification. (online)
Available at: https://dvcs.w3.org/hg/speech-api/raw-
file/tip/webspeechapi.html (Accessed at 5 Dec. 2017).
Web Application for Model, Share and Conversion of Entity-relationship Diagrams for Person Visually Impaired
411
