
Evaluation of Small Modular Wind Energy Conversion System
Christos S. Ioakimidis
1,*
, Fivos Galatoulas
1
and Robert R. Porter
2
1
ERA Chair (*Holder) 'Net-Zero Energy Efficiency on City Districts, NZED' Unit, Research Institute for Energy,
University of Mons, 56 Rue de l’Epargne, Mons, Belgium
2
Department of Mechanical, Materials and Aerospace Engineering, Illinois Institute of Technology, Chicago, IL,U.S.A.
Keywords: Case Study, Energy economics, Financial Study, Wind Amplified Rotor Platform, Wind Power.
Abstract: A probabilistic method based on the Weibull distribution for predicting the economic performance and
reliability of small autonomous wind energy conversion (WEC) systems is described. These systems contain
WARP (Wind Amplified Rotor Platform), an adaptable design of wind generator, along with the WARP-GT
(generation-transmission) system which combines both electricity generation through wind energy
conversion and electric power transmission. Furthermore, this work explores the use of pumped-storage,
aiming to firm up the intermittent nature of the system. Results of this prediction are applied in the cost
estimation of an investment from the private owner view. The cost estimation is based on a power law ratio
for industrial equipment. Results are presented for two case studies located in Greek islands.
1 INTRODUCTION
Wind energy use has several attractive features.
Typically, high wind regimes occur in areas with
low priority land use classification. The energy in
the wind can be easily converted to rotary
mechanical energy by aero turbines and to electrical
energy by coupling generators. The collection area is
perpendicular to the ground with surface area equal
to the area swept by the blades.
Since the power density in moving air (wind)
varies as the cube of the wind speed, the power
output of a wind energy system will have wide
variation similar to the variations in the wind speed.
Therefore, to provide a reliable supply (electrical,
mechanical, or thermal) to consumers, one has to
employ some type of energy storage and
reconversion system to smooth out the variations
and supply energy during calm periods. An
alternative approach is to have a conventional
backup system of sufficient capacity, which by itself
could supply the consumers if necessary.
As a result of the increasing interest in the use of
wind energy systems the European Union has given
a series of incentives to individuals and companies
in member countries to install privately owned wind
arrays. The partial subsidy of the initial investment
cost by the EU along with the provisions for sales of
the excess wind generation back to the electric
utilities has made investing in wind generation
profitable in places with high average wind
velocities (>4.5 m/s) (Tigas et al., 2015). The Greek
islands appear prosperous for investment since they
are in an area of Europe with high mean wind speeds
(>7.5 m/s).
The objective of this study is to undertake a
three-step assignment to investigate applications of a
Wind Amplified Rotor Platform (WARP)
(Weisbrich et al., 1995), and the feasibility of
employing wind power for the Greek islands as a
possible energy source and fuel saved, using
probabilistic methods. The method of cost analysis
employs a power law applied to plant-capacity for
fixed cost. The probable accuracy of estimation is
perhaps
30%, which is adequate for a preliminary
feasibility study.
Finally, this work explores the use of “pumped-
storage”, to firm up the intermittent nature of wind-
generated power. Pumped-storage is defined as the
use of hydroelectric or thermal power to pump water
into a reservoir during periods of low demand and to
let it out during periods of high demand. This
involves the use of a turbine/pump, which can either
pump water up, or have water released through it to
produce power. The operation is considered
worthwhile, because the pumping energy can be
purchased at low cost, while the produced peaking
power has a high value. Using a wind turbine in
278
Ioakimidis, C., Galatoulas, F. and Porter, R.
Evaluation of Small Modular Wind Energy Conversion System.
DOI: 10.5220/0006774502780285
In Proceedings of the 7th International Conference on Smart Cities and Green ICT Systems (SMARTGREENS 2018) , pages 278-285
ISBN: 978-989-758-292-9
Copyright
c
2019 by SCITEPRESS – Science and Technology Publications, Lda. All rights reserved

conjunction with pumped storage would involve
using the irregular wind power penetration to pump
water to a reservoir, from which it would be released
to generate power as needed. This would make
possible to turn intermittent, unreliable power into
firm power, at a cost in efficiency.
2 NOMENCLATURE
v Velocity (m/s)
K
h
Shape parameter at height h
C
h
Scale parameter at height h (m/s)
h
Wind shear exponent at the reference height
(dimensionless)
ICC Initial capital cost (€)
A
O&M
Annual operation and maintenance cost (€)
COE Cost of energy (€/kWh)
A Annual Investment Cost (€)
E
ഥ
Expected average power (kW)
E
W
Annual energy production (kWh)
E
w,I
Annual energy production (kWh) by
i
th
-WARP
3 WIND ENERGY ANALYSIS
WARP and its variant for generation and
transmission (WARP-GT) have been analyzed and
studied in a large scale system before by (Weisbrich
et al., 1995) and compared with the large model
designs of MOD-1, MOD-2, MOD-5A, WTS-4, and
Aeolus. The modular WARP contains a tower which
the turbine generators are mounted on at various
heights, as illustrated in Figure 1. The greater the
height, the greater the wind and power output per
generator. Turbine generators can vary from 20 to 70
kW. We chose a 25-kW generator model in case A,
and a 30-kW generator model in case B. The
resulting cost for a 50-module 4.5 MW unit is €850 /
kW. In the island of Krete (case A) we will consider
3 identical units with 3 modules in the same tower,
each one at different heights, namely 11.2 m, 15.8
m, and 20.4 m, adjusted at three different wind
speeds having a total capacity of 450 kW. In the
island of Syros (case B) we will consider 11
identical towers, each one of 300 kW capacity,
consisting of 5 modules at different heights and a
total capacity of 3,300 kW.
Figure 1: WARP Turbine module and rotator layout
[retrieved from (Weisbrich et al., 1999)].
Unlike other wind energy conversion (WEC)
systems, WARP has the following characteristics:
Lower cut-in velocity at which time power
is generated by the turbines and directed to
the utility grid (assumed here v
ci
= 0).
The power output is a function of the height
of the tower.
The upper cut-out velocity for each of the
turbines at the different heights is the same,
i.e. v
co
= 22.2 m/s.
At any particular fixed reference height, the wind
speed and direction is not constant but can fluctuate
greatly. In our case, we have average mean wind
speeds for a period of 10 years. The mean velocities
are generally counted and tabulated so that a
velocity frequency curve can be drawn. Actual field
measurements of wind velocity can be
mathematically approximated by several probability
density functions, most notably by the Weibull and
Rayleigh distributions.
The Rayleigh distribution long-time mean wind
speed is given by the following equation:
P(v)
v
2v
e
2
v
4v
2
2
(1)
where v is the windspeed, P(v) is the probability or
percent time wind is of velocity v, and
v
is the
long term mean windspeed.
Although Rayleigh distribution incorporates
mean wind velocity, it is only a one-parameter
distribution, which according to many statisticians is
inadequate to describe precisely a wind speed
distribution for wind power studies.
Nowadays one of the most useful distributions
for wind power studies is the Weibull distribution.
The standard deviation is given below:
Evaluation of Small Modular Wind Energy Conversion System
279

= { (2/K+1) - [(1/K+1)]
2
}
1/2
(2)
where is the Gamma function and for various
values of K between the range 1.2 - 6.0 the standard
deviation has the values from 0.7872 - 0.1850. The
authors in (Simiu et al., 1996) suggest that if K = 2
the Weibull distribution reduces to Rayleigh
distribution. For higher values of K, as we have in
our cases, there is a decrease in the standard
deviation that gives better results in our prediction of
the wind characteristics. The study in (Ramler et al.,
1979) shows that there is an empirical relation
between the mean wind speed and the shape
parameter for standard deviation, 0.3 0.7, that
can describe the shape parameter K. According to
these studies, we know that the Weibull distribution
in its general form is appropriate to estimate wind
characteristics and is given by the formula:
Pv
K
K
v
v
e
K
K
K
K
v
v
K
()
1
1
1
1
1
(3)
where
K 1.09 + 0.2
v
C
v
K
1
1
(4)
Wind speeds at elevations other than the
reference elevation are given as follows:
r
r
h
h
vv
(5)
where v is the velocity at height h, v
r
is the velocity
at reference height h
r
, is the wind shear
exponent that equals
0
(1-(log v
r
/log v
0
)), with
0
= (Z
0
/ h
r
), Z
0
= surface roughness length (0.2
m), and v
0
= 67.1 m/s.
The mean value from the annual windspeed
distribution for the reference elevation of 10 m is
8.25 m/s for the island of Krete and 7.5 m/s for the
island of Syros. At other elevations, the wind
gradient power law is used to modify the Weibull
parameters as follows:
K
K
h
h
v
h
r
r
1
0
0
log
log
(dimensionless)
(6
)
CC
h
h
hr
r
h
in m/s
(7
)
where,
h
r
v
v
0
0
1
log
log
(dimensionless).
(8
)
A variable that effects turbine performance is the
change in air density, which depends on pressure
and temperature through elevation and weather.
Elevation ranges from 11.2-20.4 m for case A, and
from 11.2-29.5 m for case B. The effect of pressure
and temperature can be described with the equation
of state for ideal gases:
= P / RT
(9)
where P is the absolute barometric pressure, is the
mass density, R is the gas constant, and T is the
absolute temperature.
Since R is constant, two states can be linked in
the following relation
P / T = P
0
/
0
T
0
(10)
where subscript
0
denotes sea level standard
condition. Thus
0
/ =(P / P
0
) (T
0
/ T). (11)
With T
0
= 298 K, we assume T = 300 K for
the examined period. From Atmospheric Standards,
the ratio P / P
0
for the above heights has no
significant change. Thus we assume that air density
is constant at a value of = 1.225 kg/m
3
.
From the specific windspeed duration curves,
computing the output power at that particular
windspeed and integrating over the appropriate time
duration will yield the annual energy output:
E EvPvdv EvPvdv
()() ()()
.
0
22 2
0
(12)
where the total available wind power is:
EvA
1
2
3
(13)
Since the wind turbine only produces power
when the wind speed is between cut-in (= 0 for
WARP) and the cut-out wind speed, the integration
of Equation (13) needs to be performed only over
these limits.Results of this analysis with the
characteristics of the rotors for each unit in the two
cases are given in Tables 1 and 2.
Figures 2-3 illustrate the comparison of the
output power using Weibull vs Rayleigh distribution
SMARTGREENS 2018 - 7th International Conference on Smart Cities and Green ICT Systems
280
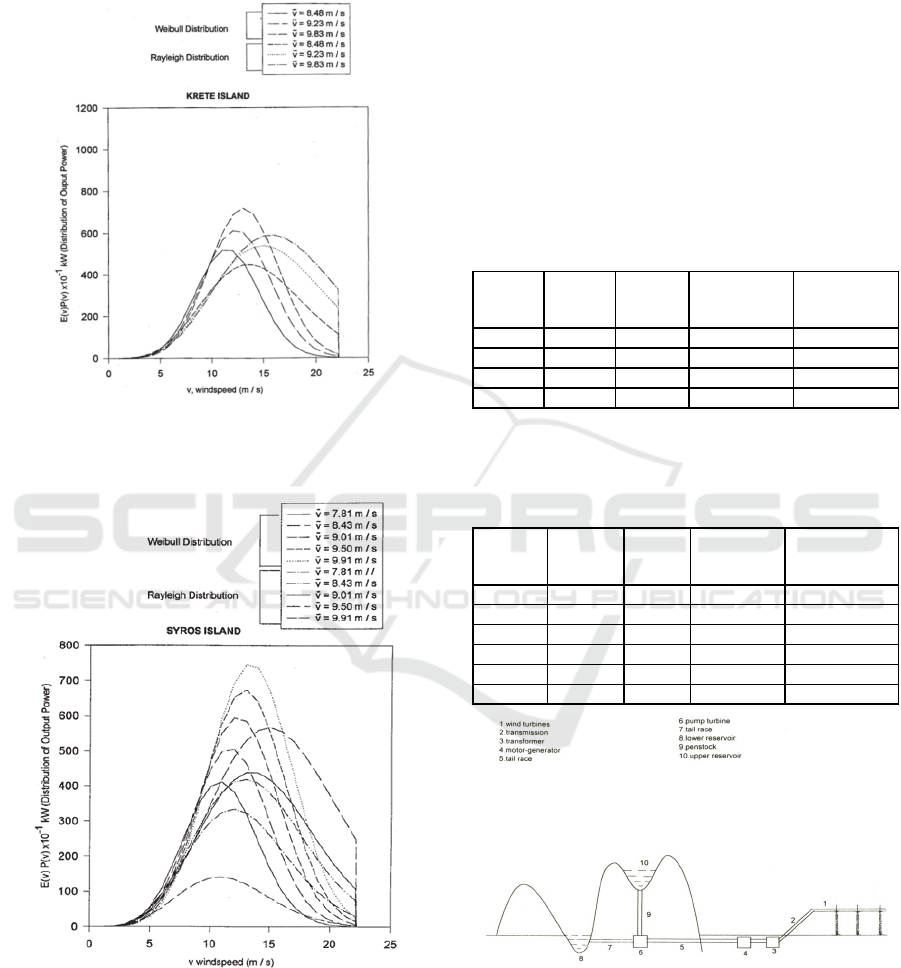
for the two islands. It is readily apparent that
Rayleigh distribution is much more conservative and
has generally lower probability of velocity curves
than using the two parameter Weibull distribution.
Figure 2: Output Power Comparison for the Island of
Krete Using Weibull-Rayleigh Distribution (Case A, Total
Load Demand 12,503 MWh).
Figure 3: Output Power Comparison for the Island of
Syros Using Weibull-Rayleigh Distribution (Case B, Total
Load Demand 53,908 MWh).
3.1 Pumped Storage Sizing
A suitable site for a wind-powered pumped-storage
facility requires wind, a reasonable storage facility,
and head, in addition to water (Figure 4). The site
concentrating the above elements identified in this
paper, is the island of Krete. To simulate pumped-
storage production, hourly, daily or yearly average
windspeed was needed (Caralis et al., 2012). Again,
it was selected according to the yearly average wind
speed of 8.25 m/s at the elevation of 10 m.
Table 1: Wind-Site Unit Performance/Turbine
Characteristics-Wind Speed Distribution-8.25 m/s mean
windspeed-Shear = 0.247, Density = 1.225 kg/m3, vco =
22.2 m/s, 3 modules of 2 turbines each.
Hub-
Height
(m)
Module
#
kW per
turbine
kWh/turbine
per year
Total
kWh/turbine
per yea
r
11.2 1 25 33,000 66,000
15.8 2 25 43,000 86,000
20.4 3 25 52,000 104,000
Total: 256,000
Table 2: Wind-Site Performance/Turbine Characteristics -
Wind Speed Distribution - 7.5 m/s mean windspeed -
Shear = 0.258, Density = 1.225 kg/m3, vco = 22.2 m/s, 5
modules of 2 turbines each.
Hub-
Height
(m)
Module
#
kW
per
turbine
kWh/turbi
ne per year
Total
kWh/turbine
per yea
r
11.2 1 30 26,600 53,200
15.8 2 30 34,500 69,000
20.4 3 30 42,500 85,000
25 4 30 49,600 99,200
29.5 5 30 56,300 112,600
Total: 419,000
Figure 4: Modular Wind-Powered Pumped-storage system
design.
Next, one uses the power produced by the
turbines to pump water into the pumped-storage
reservoir. This involves converting the hourly power
input into the volume of water lifted into the
Evaluation of Small Modular Wind Energy Conversion System
281

reservoir each day of each month in the time period
(Ter-Gazarian, 1994). The output is volume of water
lifted 300 meters in one second with 100%
efficiency. In this case, an efficiency factor of 80%
was selected for the use of windmills pumping water
into the pumped-storage reservoir. Thus the volume
of water lifted in 300 meters per day by the 256,000
kWh wind turbine installation is V = 72.6 m
3
.
At a head of 300 meters, 1,571 m
3
would
generate 1,000 kWh, or 1 MWh. The release of 72.6
m
3
would then generate 0.0462MWh per day or
16,876 kWh. If the average home uses 15,500 kWh
per year, then this pumped storage facility could
handle the needs of about 1 household, with one
windmill, once it was filled. For a small n, say n =
50, n windmills could handle the needs of 50 homes
or a peak load demand of (15,500)(50) / (3,600) =
208 kW which is the peak load demand of a medium
size village on a Greek island.
4 METHOD OF ECONOMIC
ANALYSIS
In this study, the power system is assumed
sufficiently large compared to the wind penetration,
so that there is no restriction to the power produced
by the wind generation.
In case A, the wind turbines are connected to the
local distribution network, while in case B the wind
farm is scheduled by the utilities to be connected to
the power system. Cost of capacity is taken to be
dependent on a power x of capacity. The power x
has been found by (Peters et al., 1968) to vary
between 0.6-0.8 for many process facilities. In this
case, we take it as 0.8 which reflects the economy of
scale generally encountered in recent history.
The work in (Weisbrich et al., 1995) gives
results of a 50 MW wind power production for
WARP-GT and WARP for two different cases of
mean windspeeds of 5.8 and 8.0 m/s respectively.
The total initial capital cost includes the turbine
system cost and balance of station as well as the land
area of the windmills. For WARP-GT with 5.8 m/s
mean windspeed and 20 units each of 2.5 MW
capacity and 50 module per unit, the total initial
capital cost for 45 MW is €36,394,000, while for 8.0
m/s mean windspeed and the same number of
module per unit, but now for 8 units each 6.2 MW
totalling 49.6 MW, the total initial capital cost is
€17,415,300. For the first mean windspeed
mentioned, for 151 units, each of 330 kW, and 11
modules, totalling 49.83 MW, the total initial capital
cost is €30,894,700. For 8 m/s mean windspeed with
the same number of modules on each of the 56 units,
each unit of 900 kW capacity, totalling 50.4 MW,
total initial capital cost is €18,217,000.
There is a correlation for the 11 modules per unit
between mean wind speeds and initial capital cost.
Since this correlation is not linear, we will use a
power correlation given by the formula
ln y = ln b + m ln x (14)
where y is initial cost and x is windspeed.
If we try to find the values of m and ln b these
are: m=-2.2922 and ln b=21.5562. Thus the power
correlation becomes:
ln y = 21.5562 - 2.2927 ln x (15)
for x=8.0 m/s mean windspeed.
Using this correlation, we first extrapolate for
v=8.25 m/s mean windspeed for the average
capacity of 50.115 MW and we find an initial capital
cost of €17,275,700.
We repeat the process but now for 50 modules
per unit. The power correlation between the mean
wind speeds and the total initial capital costs for
v=8.25 m/s with the average capacity of 47.3 MW,
results in a €16,207,100 total initial capital cost.
5 RESULTS
5.1 Case A: WARP-GT Krete
For the WARP-GT on the island of Krete, there are
two values that result by using the power correlation
and subsequently the power ratio law.
€16,207,100 = a 47,300
0.8
a = €2,950 / kW
0.8
with 50 modules per
unit, and
€17,275,700 = a 50,115
0.8
a= €3,000 / kW
0.8
with 11 modules per
unit.
Since the examples that will be used in this study
are for a small-scale system, we assumed that our
study is closer to the one by (Weisbrich et al., 1995)
of 11 modules per unit. As can be seen from the
results above, there is not a large difference cost per
kW using the 50 modules per unit or the 11 module
per unit case. For a 450 kW capacity the initial
capital cost is:
ICC = €(3,000) (450)
0.8
=€400,000 (16)
We now express cost in terms of a power law
ICC = b N
0.8
and a module power law ICC = c N
0.8
.
SMARTGREENS 2018 - 7th International Conference on Smart Cities and Green ICT Systems
282

For the first of the three units using the power factor,
the initial capital cost is:
b = €400,000 / 3
0.8
= €165,000 (17)
In addition the cost of the first module per unit,
since each unit contains 11 modules is:
c = €165,000/ 11
0.8
= €24,000 (18)
The annualized operation and maintenance cost
is taken as 0.5% of the initial capital cost. For a 450
kW capacity:
A
O&M
= (0.005) (€400,000) = €1,990 (19)
The WARP’s initial capital cost is annualized in
real currency by multiplying it with the following
annualization factor:
11
n
,
1
1
1
i
u
(20)
where n is the expected wind generator service time,
i is the market interest rate, u is the inflation rate and
is the real interest rate. In this case n = 15 years, i
= 12%, u = 5.7 %, results in
= 0.135. So the
annualized investment cost is:
A = (0.135) (€400,000) = €54,000 (21)
The total wind park production (in kWh) is:
EE E
ww
i
N
w
w
,i ,i
,,
11
3
256 000 3 768 000
(22)
The cost of energy is thus:
kWh
AA
COE
MO
/072.0€
3000,256
990,1000,54
&
(23)
The mean power or (utilization factor) as
percentage of the installed power is: 768,000 /
(450)(8,760) = 19.5 % or 0.195.
The Benefit Cost Ratio (B/C) in WARP-GT,
which allows us to see if an investment is profitable
or not is given by the formula:
CosteMaintenancCostAnnualized
yearperPPCthetoSalesWindfromRevenues
CB
ratio
(24)
The revenues from wind sales to the utility
company, which in this case is the Public Power
Corporation (PPC) are computed for each day as
follows:
Revenues of wind sales per day = C
T
(25)
where C
T
(€/kWh) is the cost rate of the wind energy
sold to the PPC. In this context, the purchase and
sales rates from the Producer Price Indices were
€0.09945/kWh and €0,172/kWh respectively
(Eurostat, 2017). So continuing our economic
analysis we have:
1 >1.3
56,000
)256,282)(3(0.09945)(
CB
ratio
(26)
Since B/C
ratio
>1, this means that the installation
of these three identical units is a profitable
investment. The revenues in the period of the 15
years will be given by the formula:
A
rev
venues of Wind Sales to PPC
Annualized Factor
Re
(27)
As an alternate economic evaluator, the simple
payback period (SPP) of our investment is the period
that we will gain profits from the wind sales to the
PPC. SPP with 100% availability is given by:
Years
AA
ICC
SPP
MOrev
3.5
)990,1()3)(000,256)(0994.0(
000,400
&
(28)
Table 3: WARP System and COE for the Island of Krete -
450 kW Wind Power Production - 8.25 m/s mean
windspeed - 3 module.
No. of Units 3
kW / Unit 150
Total ICC (Initial Capital Cost) €400,000
Cost per kW €3,000
Cost per Unit €165,000
Cost per Module €24,000
A
O&M
Cost €1,990
Annual Energy Production (net) 770,000 kWh / yr
Cost-of Energy €0.072/kWh
B/C
ratio
1.3>1 (profitable)
A
rev
€565,000
SPP 5.3 years
5.1.1 Pumped Storage
For a 7.5 MW capacity the initial capital cost is:
ICC = €(3,000)(7,500)
0.8
= €3,800,000 (29)
The annualized operation and maintenance cost is
the 0.5% of the initial capital cost. For a 7,500 kW
capacity:
A
O&M
= (0.005)(3,800,000) = €19,000 (30)
The WARP’s initial capital cost is annualized by
multiplying it with the following annualization
factor as in Eq. (21). In this case n = 20 years, i =
12%, u = 5.7%, results in = 0.085. Therefore, the
annualized investment cost is for n = 50:
A=€ (3,800,000)(0.085) = €320,000 (31)
The cost of energy is thus:
Evaluation of Small Modular Wind Energy Conversion System
283

€0.026/kWh
(50) (256,000)
19,000 + 320,000
Ε
AA
COE
M&O
(1)
(32)
In the case of the system of Krete, for the
pumped storage facility we need total generation of
92.6 kW/year.
A lower value for the cost of a pumped storage
generating facility might be obtained by considering
an 8 MW unit, which, including a spherical valve,
motor-generator, governor, and shipping and
handling, would cost on the order of €1,160,000,
without concrete, (Loewus et al., 1984).
Hence we have:
Cost of eq. a = Cost of eq. b
0.86
beq.ofCap.
aeq.ofCap.
(33)
resulting in €55,000 for the specific investment. In
this case n = 50 years, i = 12%, u = 5.7%, results in
= 0.0625. So the annualized investment cost is:
A
O&M
= (55,000) (0.0625) = €3,400
(34)
he cost of energy for the pumped-storage system is:
kWh/0107.0€
333,436
400,3
=COE
(2)
(35)
From grid prices found in (Eurostat, 2017) and
the fact that in order to be profitable, a storage
system must have a cost of energy between the
difference of generation prices in specified
timezones, the under study system, exhibits a COE
(2)
less than this difference, thus a wind-powered
pumped-storage system using WARPs is feasible.
The total cost for the pumped-storage
combination (without land acquisition, maintenance
on the pump-generator, and some major
construction) can be estimated as:
COE
(1)
+ COE
(2)
= €0.0367 / kWh
(36)
The results using the power law ratio are very close
with a different economic analysis used for
hydropower existing power plants, in other papers
described by the formula used by (Gordon, 1978):
C
T
= 9,600 kW
0.82
H
R
-0.35
(37)
where C
T
is the equipment cost, kW is the total plant
capacity in kilowatts; and H
R
is the rated head in
meters. This equation gives satisfactory equipment
cost estimates for a plant capacity range from 50 kW
to 40,000 kW, with the exception of sites with less
than 3.7 m of head and high flows.
This equation with the use of the power law ratio
can be transformed as:
Cost of eq. a = Cost of eq. b
0.64
beq.capac.
aeq.capac.
(38)
which gives similar results.
5.2 Case B: WARP GT Syros
In the case of WARP-GT for the island of Syros we
follow the same process as in case A. Using the data
by (Weisbrich et al., 1995), we know that for
vms 58./
and for 11 module per unit, the total
initial capital cost is €30,895,000. For
vms 80./
with the same number of modules per unit, the total
initial capital cost is €18,220,000.
The power correlation for a 50 module per unit,
of a 47.3 MW average capacity power plant, for
mean windspeed of
vms 75./
has a total initial
capital cost of €20,215,000. For a 50.115 MW
average capacity power plant, but with 11 module
per unit, the total initial capital cost, for
vms 75./
is computed to be €20,300,000.
Having 11 identical WARP-GT the initial capital
cost is:
ICC = (3,500)
0.8
(300)(11) = €2,260,000
(39)
To annualize the ICC we multiply it with an
annualized factor given by the formula mentioned
before for case A. In this case, n = 10 years, i = 12%,
u = 5.7%, results in = 0.102 Hence the annualized
investment cost is:
A=€(2,260,000)(0.102)= €230,000
(40)
Table 4 summarizes the main I&O&M figures.
Mean power as percentage of the installed power is:
420 000 11
3 300 8 760
100% 15 9%
,
,,
.
or 0.159
(41)
The decrease in the mean power compared with
case A gives us a good opportunity to note that a
larger installation does not necessarily means more
mean power. The benefit to cost ratio for the specific
installation is calculated in Equation (43), and gives
a result greater than 1, suggesting that the
investment is profitable.
11.9
242,000
11420,0000.09945
CB
ratio
(42)
For the WARP system following the same
procedure the results can be seen in Table 4.
Table 4: WARP System and COE for the Island of Syros -
3,300 kW Wind Power Production - 7.5 m/s mean
windspeed - 5 module.
No. of Units 11
kW / Unit 300
Total ICC (Initial Capital Cost) €2,260,000
SMARTGREENS 2018 - 7th International Conference on Smart Cities and Green ICT Systems
284

Table 4: WARP System and COE for the Island of Syros -
3,300 kW Wind Power Production - 7.5 m/s mean
windspeed - 5 module (cont.).
Cost per kW €3,500
Cost per Unit €332,000
Cost per Module €49,000
A
O&M
Cost €12,000
Annual Energy Production 4,600,000 kWh/yr
Cost-of Energy €0.052/kWh
B/C
ratio
1.9>1 (profitable)
A
rev
€4,500,000
SPP 5.1 years
6 CONCLUSIONS
The Weibull distribution has been developed and
applied for predicting the performance and the
reliability of small autonomous systems consisting
of WARP and WARP-GT. Applications in wind
power plants using two examples show SPP from
5.1 to 5.3 years. While these payback periods are
somewhat long compared with convention energy
systems, for renewable energy they are sufficiently
promising to justify further investigation.
The use of a combined pumped-storage wind-
powered facility has been developed in a large scale
system using a modular windmill consisting of a
total wind capacity of 7.5 MW. An application of
this system was made using a Greek island as an
example, while its wind characteristics had already
been given in a previous paper. Despite the fact that
the difference of the day-time generation cost and
the night-time generation cost is not large, the results
of this large scale system show that this investment
could be profitable. Hence as a system, this
combination can be applied at many Greek islands in
the summer periods, where usually there is an
increase of the load demand. The use of this storage
energy for the peak load demand would then reduce
or even replace fossil fuel, which is costly at the
Greek islands while an economic analysis based on a
power law ratio could be applied.
ACKNOWLEDGEMENTS
This research was funded by the EC under the FP7
RE-SIZED 621408 (Research Excellence for
Solutions and Implementation of Net-Zero Energy
City Districts) project.
REFERENCES
Caralis, G., Papantonis, D. and Zervos, A., 2012. The role
of pumped storage systems towards the large-scale
wind integration in the Greek power supply system.
Renewable and Sustainable Energy Reviews, 16(5),
pp.2558-2565.
Eurostat, 2017, Electricity prices for household consumers
- biannual data (from 2007 onwards) [nrg_pc_204]
retrieved from
http://appsso.eurostat.ec.europa.eu/nui/show.do?datase
t=nrg_pc_204&lang=en Accessed: 23-10-2017
Gordon, J.L., 1978. Small hydro sets can yield competitive
energy.
Energy Int.;(United States), 15(8).
Loewus, D. and Millham, C., 1984. Simulating the
productivity of a wind-powered pumped-storage
power facility.
Energy engineering, 81(6), pp.4-28.
Peters, M.S., Timmerhaus, K.D., West, R.E., Timmerhaus,
K. and West, R., 1968.
Plant design and economics
for chemical engineers
(Vol. 4). New York: McGraw-
Hill.
Ramler, J.R. and Donovan, R.M., 1979. Wind turbines for
electric utilities: Development status and
economics.DOE/NASA/1028-79/23, NASA TM-
79170, Orlando, Florida
Simiu, E. and Scanlan, R.H., 1996.
Wind effects on
structures
. John Wiley and Sons, p.529.
Tigas, K., Giannakidis, G., Mantzaris, J., Lalas, D.,
Sakellaridis, N., Nakos, C., Vougiouklakis, Y.,
Theofilidi, M., Pyrgioti, E. and Alexandridis, A.T.,
2015. Wide scale penetration of renewable electricity
in the Greek energy system in view of the European
decarbonization targets for 2050. Renewable and
Sustainable energy reviews, 42, pp.158-169.
Ter-Gazarian, A.G., 1994.
Energy storage for power
systems
(No. 6). Iet. Peter Peregrinus Ltd
Weisbrich, A.L., Ostrow, S. and Padalino, J., 1995. COE
Projections for the Modular WARPtm Wind Power
System for Wind Farms & Electric Utility Power
Transmission. In
Proceedings of the American Power
Conference (Vol. 57, pp. 832-832)
. Illinois Institute of
Technology.
Weisbrich, A.L., Simsbury, W., Rainey, D.L. and Olson,
P.W., 1999. WARP Solar/Wind Power: Green, User-
Friendly and Cost Effective for the New Millennium
International Power Markets. In
Proceedings of the
American Power Conference
(Vol. 61, pp. 232-237).
Illinois Institute of Technology.
Evaluation of Small Modular Wind Energy Conversion System
285
