Design and Implementation of a Data Acquisition System for R Peak
Detection in Electrocardiograms
Gabriela Idali Ibarra Fierro
1
, Ricardo Rodriguez-Jorge
1
,
J. Mizera-Pietraszko
2
and Edgar A. Martinez-Garcia
1
1
Engineering and Technology Institute, Autonomous University of Ciudad Juarez,
Av. del Charro 450 Norte, Ciudad Juarez, Mexico
2
Institute of Mathematics and Informatics, Opole University, pl. Kopernika 11a 45-052 Opole, Poland
gabriela.idali.ibarra@gmail.com, {ricardo.jorge, edmartin}@uacj.mx, jmizera@math.uni.opole.pl
Keywords:
Electrocardiogram, Hilbert Transform, Adaptive Threshold, R-peak Detection.
Abstract:
This paper presents a data acquisition system for the R peak detection in electrocardiograms. R wave is one
of the most important sections of the QRS complex, which has an essential role in diagnosis of heart rhythm
irregularities. This paper employs Hilbert transform and adaptive threshold technique for the detection of R-
peak. The performance of the system was tested using standard ECG waveform records from the MIT-BIH
arrhythmia database. In addition, tests were carried out using the sensors Single Lead Heart Rate Monitor for
real-time data processing.
1 INTRODUCTION
The electrocardiographic signal (ECG), a representa-
tion of heart activity, ECG is the most popular de-
vice used in medicine and found the most precise
tool in monitoring heart activity by the medical prac-
titioners or cardiologists. More specifically, ECG is a
strictly repetitive quasi-periodic signal synchronized
by the heart, as a generator of bioelectric (Khandpur
R., 2003). The ECG corresponds to a single heart-
beat consisting of temporally distinct wave shapes: P
wave, QRS complex, T wave and U wave. Algorithms
for ECG beats detection focus on the QRS complex
because of its short duration and high amplitude of R
peak in the QRS complex (Pooja S. et al., 2017).
Accurate determination of the QRS complex, in
particular, accurate detection of the R wave peak, is
essential in computer-based ECG analysis. The po-
sition of its peak (R-peak) is the most evident fea-
ture. The distance between consecutive R-peaks (RR
period) is an important parameter in the analysis of
heart pathologies (Crema C., et al., 2016). RR pe-
riod can be used for monitoring heart rate variability
(HRV), one of the most valuable markers for detect-
ing arrhythmias and noticing abnormal heart rhythm
(bradycardia/tachycardia) (Crema C., et al., 2016).
The study of the ECG morphology is usually per-
formed starting from the detection of the time po-
sitions of R-peaks (Crema C., et al., 2016). How-
ever, this measurement is quite strenuous/challenging
(Farahabadi H. et al., 2012). Several methods are used
by experts to detect the R-peak. Difficulties arise pri-
marily from signal noise, abnormalities that accom-
pany the ECG signals, and the diversity of QRS wave
forms.
In the last several years, research into R-peak de-
tection using different approaches has been increas-
ing, for example, Shin-Chi Lai (Chi Lai S. et al.,
2014), presented a low-cost electrocardiogram signal
recorder design based on an Arduino platform. The
results showed that the algorithm is completely effec-
tive and can achieve higher-quality scores than those
of other related approaches. Another relevant study,
presented in (Farahabadi H. et al., 2012), developed
an R-peak detection algorithm suitable for implemen-
tation in portable ECG acquisition systems. The al-
gorithm is based on Hilbert transform, wavelet trans-
form and adaptive thresholding, which showed less
sensitivity to noise in comparison to other methods.
The purpose of this paper is design and build a
data acquisition system for the detection of represen-
tative waves of an electrocardiogram by implement-
ing the Hilbert transform and adaptive thresholds.
The tests are performed with the standard databases
MIT-BIH Arrhythmia and Single Lead Heart Rate
Monitor to evaluate the results obtained from the im-
plemented methods in this document.
2 MATERIALS AND METHODS
In this section, we present the architecture of the
graphic interface developed for acquisition of ECG
signals. Our approach is presented in stages, each of
which explains the design and creation of the adap-
tative thresholds for the detection of representative
points in the signal.
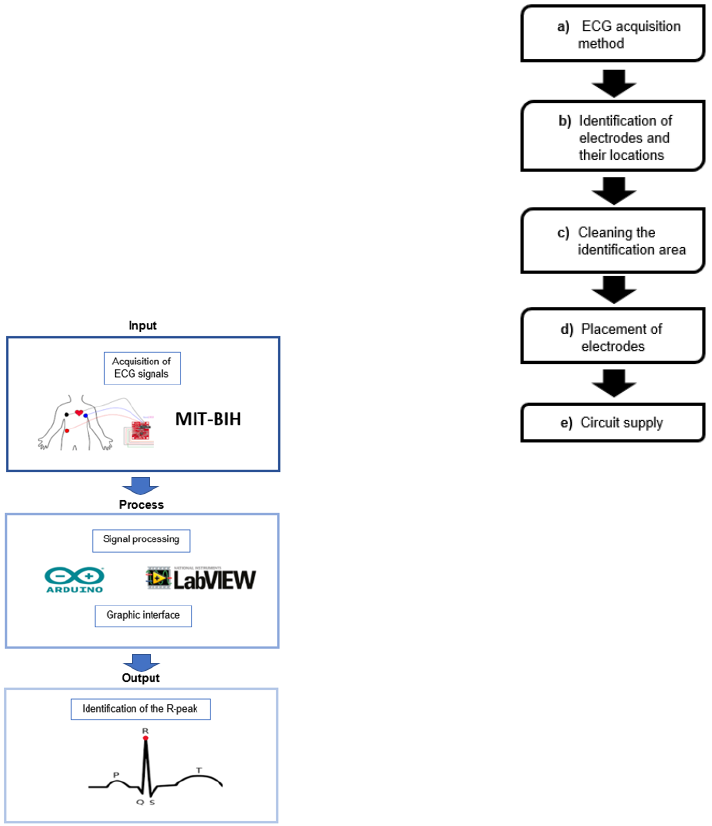
2.1 General Architecture
The general architecture of the methodology is pre-
sented in following block diagram (Figure 1).
Figure 1: General architecture.
2.2 ECG Signal Acquisition
The ECG signal acquisition process is presented in a
stage diagram (Figure 2), that shows each of the steps
of the implementation.
a) ECG acquisition method. The signals are cap-
tured by means of pads placed on the surface of
the skin.
b) Identification of electrodes and their locations.
The pads are placed on the surface of the arms and
on the right leg.
c) Cleaning the identification area. The areas
where the pads are placed are cleaned to ensure
a good connection.
Figure 2: Stages of signal acquisition.
d) Placement of electrodes. The sensor pads are
placed according to the manufacturer’s recom-
mendations. The closer to the heart the pads are,
the more precise measurement is.
e) Circuit supply. The power supply of the sensor
is carried out through the board pins.
2.3 Sensor Connection of the Single
Lead Heart Rate Monitor
The sensor board has a special design that can be
adapted to the Arduino. The connections between
the sensor and Arduino are predetermined for opti-
mal performance. The specifications for the product
operation are presented in detail below.
2.3.1 Pin Connections in the Arduino
The AD8232 Heart Rate Monitor has nine connec-
tions from the IC that can be soldered to pins, wires,
or other connectors to operate the monitor with an Ar-
duino or another board (Analog Devices, 2013). We
connect five out of the nine pins to the Arduino board.
The five pins are labeled GND, 3.3v, OUTPUT, LO-,
and LO+ (Table 1).
2.3.2 Sensor Pad Placement
After the electronic connections are established or
made, the pads are placed on the indicated body parts.
The following recommendations can help improve the
signal quality (Quiceno A. et al., 2007):
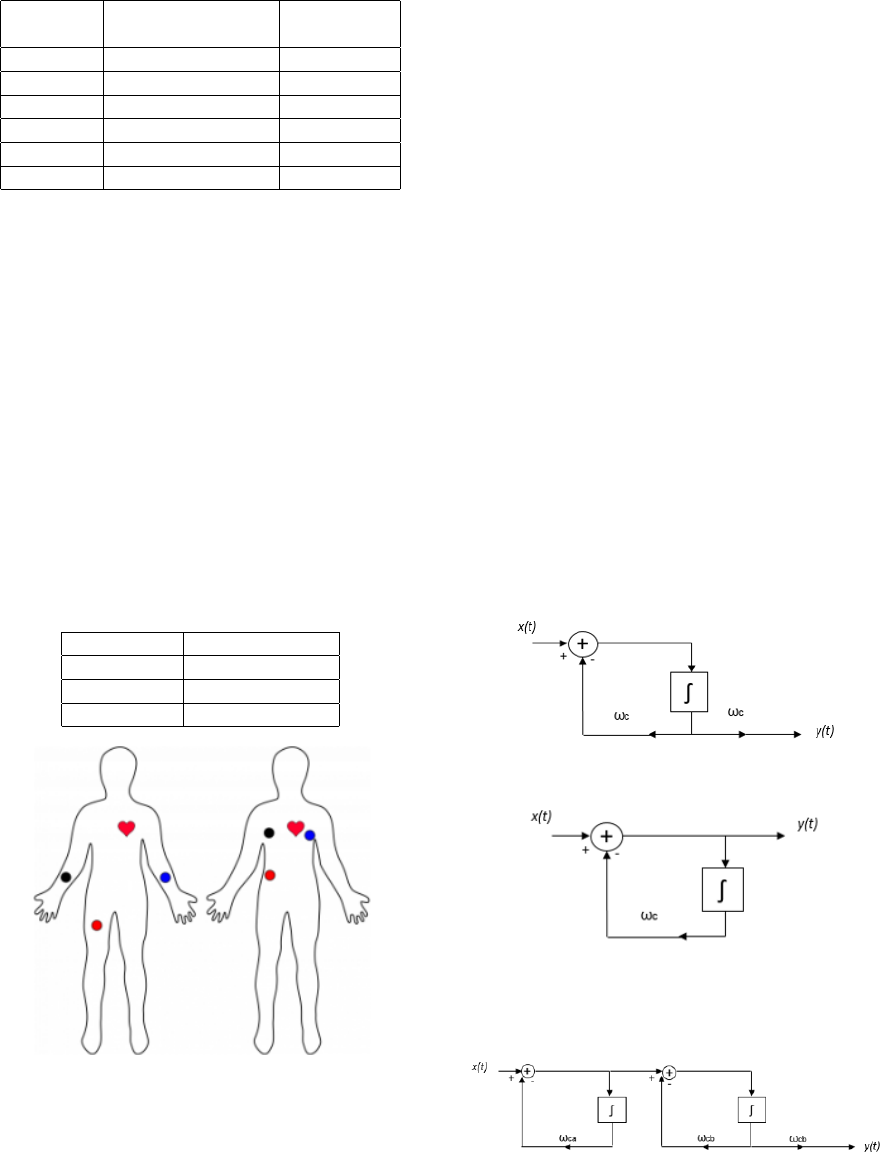
Table 1: Connection specifications (Analog Devices, 2013).
Board
Label
Pin Function
Arduino
Connection
GND Ground GND
3.3v 3.3v Power Supply 3.3v
OUTPUT Output Signal A0
LO- Leads-off Detect - 11
LO+ Leads-off Detect + 10
SDN Shutdown Not used
• It is recommended to snap the sensor pads onto
the leads before placing the pads on the body.
• The closer to the heart the pads are, the better the
measurement, as shown in Figure 3.
• The cables are color coded to help identify the
proper placement (Table 2).
• Minimize movement while taking a measurement.
• Use fresh pads for each measurement. The pads
loose the ability to pass signals after multiple ap-
plications.
• The sensor placement may have to be adjusted for
each individual.
• Hair is not a good conductor.
Table 2: Color identification (Analog Devices, 2013).
Cable color Signal
Black RA (Right Arm)
Blue LA (Left Arm)
Red RL (Right Leg)
Figure 3: Typical sensor placement (Analog Devices,
2013).
2.4 R-peak Detection
QRS complex detection is the basis of the of seg-
mentation of ECG signals (Quiceno A. et al., 2007).
The R-peak can be detected along with the P, T, and
sometimes U waves. The QRS complex is a heart-
beat detector that can be used to measure the RR in-
terval to analyze heart rate variability and to detect
arrhythmias. Various R-peak detection methods have
been reported by researchers, but these methods do
not work very well in pathological signals where the
morphology of the QRS complex changes radically
and ectopic beats occur frequently (Quiceno A. et al.,
2007).
To be able to detect the representative R wave,
we used three methods capable of distinguishing the
dominant peaks of a signal and to improve the detec-
tion results: first, ECG filtering to remove noise; sec-
ond, the Hilbert transform to detect dominant peak
points in the signal; finally, an adaptive thershold to
detect R-peaks.
2.4.1 ECG Filtering
A bandpass filter, is a type of filter that allows a cer-
tain range of frequencies to pass while attenuating
other frequencies. This type of filter is built by com-
bining a low-pass filter (Figure 4) and high-pass filter
(Figure 5).
These filters are represented by standard continu-
ous time system building blocks, integrators, ampli-
fiers and sum connections.
Figure 4: Low-pass filter (Roberts M., 2018).
Figure 5: High-pass filter (Roberts M., 2018).
These two systems can be connected in series to
form a bandpass filter, as shown in Figure 6.
Figure 6: Bandpass filter (Roberts M., 2018).

2.4.2 Differentiation
The first derivative is applied to identify the minimum
slope of the ECG signal, i.e., the falling of the signal
from R to S. In addition, the first derivative indicates
the maximum slope points, i.e., the rising of the signal
from Q to R. The first derivative is expressed in the
following equation:
˙y(t) =
∆y
∆t
=
y(t) − y(T
previous
)
(t − T
previous
)
|t > T
previous
(1)
where t is the current time and T
previous
is the time
of the last output.
2.4.3 Hilbert Transform
The Hilbert transform is one of the most important
and common transforms used for the detection of the
QRS complex and the R wave (Rabbani et al., 2011).
The Hilbert transform is defined as (Benitez D. et al.,
2001):
ˆy(t) = H{ ˙y(t)} =
1
π
Z
∞
−∞
˙y(τ)
t − τ
dτ (2)
Using Fourier identities, it is possible to show that
the Fourier transform of the Hilbert transform of ˙y(t)
is given by (Benitez D. et al., 2001):
F
n
ˆ
(y)
o
= − j sgn f F
{
˙y(t)
}
(3)
In the frequency domain, the result is obtained by
multiplying the spectrum of ˙y(t) by j(+90
◦
) for neg-
ative frequencies and by − j(−90
◦
) for positive fre-
quencies.The result in the time domain can be ob-
tained by performing the inverse Fourier transform.
Therefore, the Hilbert transform of the original func-
tion ˙y(t) represents its harmonic conjugate, as shown
in Figure 7 (Benitez D. et al., 2001).
Figure 7: Complex representation of the envelope (Benitez
D. et al., 2001).
The analytic signal or pre-envelope of a real sig-
nal ˙y(t) can be given by expression (Benitez D. et al.,
2001):
y(t) = ˙y(t) + j ˆy(t) (4)
While the envelope B(t) of y(t) is defined as (Ben-
itez D. et al., 2001):
B(t) =
q
˙y
2
(t) + ˆy
2
(t) (5)
2.4.4 Adaptive Threshold
The adaptive threshold is composed of a pair of
thresholds called an upper limited threshold (u
th
) and
the lower limited threshold (l
th
). The upper limited
threshold is defined by Eq. (6).
u
th
= 0.65 × a (6)
The lower limited threshold is defined by Eq. (7).
l
th
= 0.15 × a (7)
where the maximum value is obtained at B(t). In
each stage of the threshold, the numbers of the peaks
detected above the upper and lower thresholds and
the total number of the detected peaks are calculated
(Rodriguez R. et al., 2017).
Nu
th
= Number of R-peaks detected by u
th
.
Nl
th
= Number of R-peaks detected by l
th
.
The threshold values are updated by means of the
iteration equation; meanwhile, the numbers of the
peaks detected by the upper and lower limits are dif-
ferent. The value of u
th
is updated using (Rodriguez
R. et al., 2017):
u
th
(t + 1) = u
th
(t) − w∆ (8)
The value of l
th
is updated using:
l
th
(t + 1) = l
th
(t) + w∆ (9)
where error weight w = 0.125 , and ∆ = u
th
(t) −
l
th
(t), which is the difference between the two defined
limits (Rodriguez R. et al., 2017).
3 EXPERIMENTAL RESULTS
This work was developed in LabVIEW. Three tests
were conducted to cross-check the functionality. Case
study 1 and 2 were performed with the MIT-BIH
database, and case study 3 was conducted with Sin-
gle Lead Heart Rate Monitor sensors.
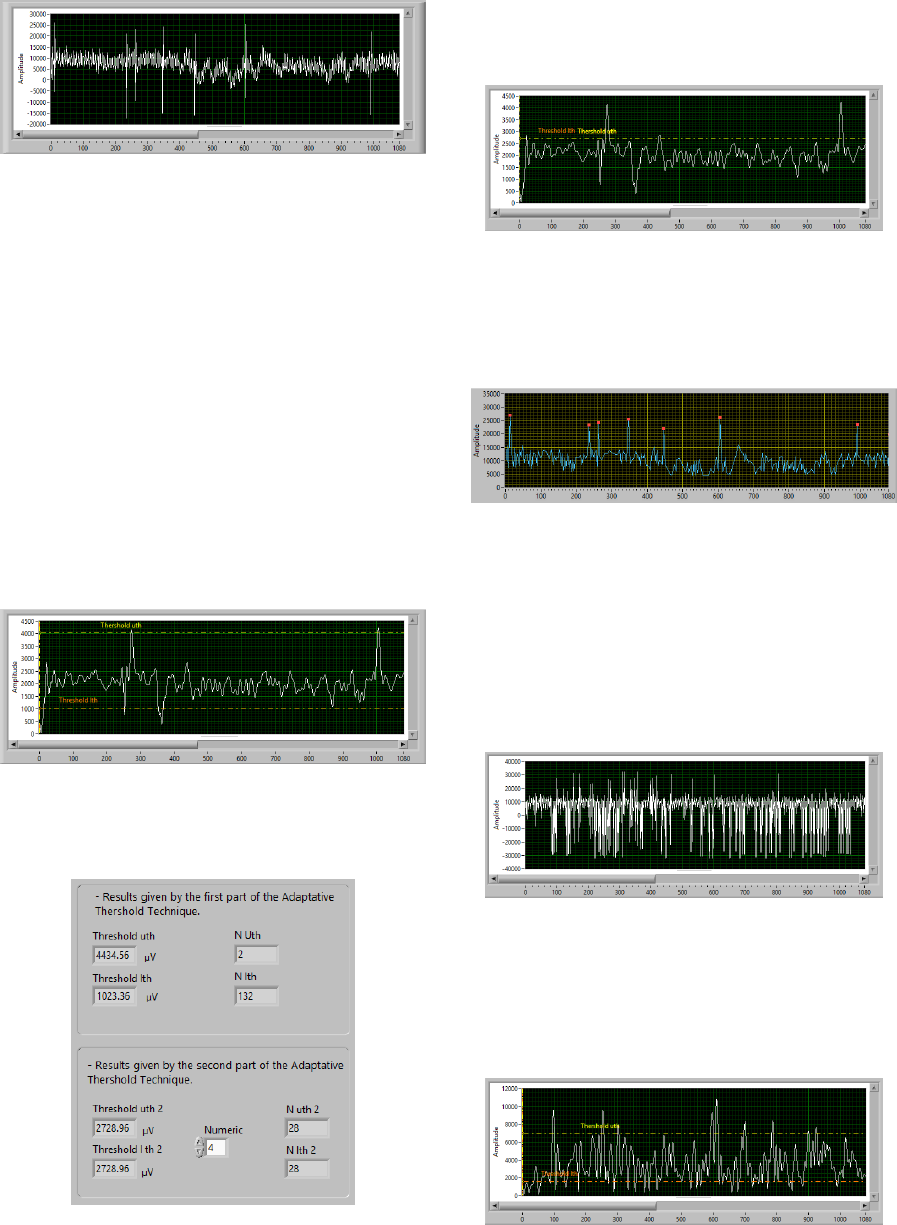
Figure 8: Original ECG signal from the MIT-BIH arrhyth-
mia database (Case Study 1).
3.1 Case Study 1
To run the tests, we selected the 100.art file from the
MIT-BIH database (Figure 8).
The graph consists of two axes, with 1080 steps
for the horizontal axis (X) and µV for the vertical axis
(Y). The graph shows the noise plot; therefore, the re-
sults are inefficient for the development of the thesis.
We included a bandpass filter with a frequency of 5 to
15 Hz to remove the noise.
In the second part, we applied a bandpass filter
and calculated the first derivative. Then, the Hilbert
Transform was applied, resulting in a signal enve-
lope with better resolution. Furthermore, the adaptive
threshold technique was applied for the identification
of u
th
and l
th
(Figure 9).
Figure 9: Envelope of the ECG signal (Case Study 1).
Then, the second part of the thresholds was imple-
mented. The thresholds were positioned in the same
Figure 10: The results obtained by the adaptive threshold
technique (Case Study 1).
way and the same number of the peaks were detected.
The thresholds u
th
and l
th
are positioned in the
same way (Figure 11).
Figure 11: Adaptive threshold application in the ECG signal
envelope (Case Study 1).
The R-peaks of the ECG signal were detected
based on the location of the peaks obtained from the
envelope of the signal (Figure 12).
Figure 12: R-peaks of the ECG signal (Case Study 1).
3.2 Case Study 2
In case study 2, we selected the 104.art file from the
MIT-BIH database. As in case 1, the graph consisted
of two axes: 1080 steps for the horizontal axis (X) and
µV for the vertical axis (Y). We included a bandpass
filter with a frequency of 5 to 15 Hz (Figure 13).
Figure 13: Original ECG signal from the MIT-BIH arrhyth-
mia database (Case Study 2).
We implemented the first derivative and the
Hilbert transform to obtain a signal envelope with a
better resolution. Furthermore, the adaptive threshold
technique was applied to identify u
th
and l
th
.
Figure 14: Envelope of the ECG signal (Case Study 2).

The thresholds were updated with the second part
of the adaptive threshold technique and the same
numbers of peaks were obtained with the upper and
lower thresholds. Figure 15 presents the obtained
peaks and the values for each threshold.
Figure 15: The results obtained by the adaptive threshold
technique (Case Study 2).
The thresholds u
th
and l
th
were updated to the
same values as in Figure 15. The initial values of the
thresholds were u
th
= 0.5 and l
th
= 0.1. After some
testing, the initial values were changed to 0.65 and
0.15, which resulted in substantial improvement in R-
peak identification.
Figure 16: Adaptive threshold application in the envelope
of the ECG signal (Case Study 2).
The R-peaks of the ECG signal were detected
based on the locations of peaks obtained from the sig-
nal envelope (Figure 17).
Figure 17: Original signal with the peak identification (Case
Study 2).
3.3 Case Study 3
The signal for the last test case was recorded in real
time from a Single Lead Heart Rate Monitor sensor.
Figure 18 shows the placement of the pads in the in-
dicated areas. Figure 19 presents the sensor and Ar-
duino Mega connections. The data were recorded on
a 19-year-old man.
Figure 18: Pad placement and sensor connections (Case
Study 3).
Figure 19: Arduino Mega and Single Lead Heart Rate Mon-
itor sensor connections (Case Study 3).
The real-time signal is shown in Figure 20. The
x-axis shows the time, and the y-axis shows the sig-
nal amplitude in mV. The recorded signal has mini-
mal noise because the sensor included a filter, which
resulted in a well-defined signal. Figure 21 presents
the envelope of the signal obtained from the Hilbert
transform. The scale of the envelope changes in rela-
tion to the ECG signal because the first derivative is
used.
Figure 20: ECG signal recorded by the sensor (Case Study
3).
Figure 21: Envelope of the ECG signal (Case Study 3).
4 CONCLUSIONS AND FUTURE
WORK
A method for R complex detection in ECG signals
is presented. The proposed method has a significant
effect on the detection of R-peaks and outperforms
other methods. The paper proposed a system capable
of detecting the representative R-peaks in an ECG,
taking as test cases the MIT-BIH arrhythmia database
and the Single Lead Heart Rate Monitor sensor. This
detection is necessary for the analysis and diagnosis
of several cardiac abnormalities. However, because of
several artifacts and the variable morphology of each
person’s ECG signal, different techniques have been
applied for the R-peak detection.
Different stages have been applied in the devel-
opment of the R-peak detection method, such as im-
plementation of a bandpass filter (for the signal from
the MIT-BIH arrhythmia database), the first deriva-
tive, the Hilbert transform, and the adaptive threshold
technique.
The developed system enables the identification of
R-peaks in ECG signals. However, there are several
potential directions for future research. Therefore, the
following directions for future research are porposed:
• Real-time signal classification to identify different
types of arrhythmias.
• System implementation in mobile devices for mo-
bile telemedicine.
• Signal averaging to enhance the representative
waves of ECG signals.
ACKNOWLEDGEMENTS
This project is supported by Research Grant No.
DSA/103.5/16/10473 awarded by PRODEP and the
Autonomous University of Ciudad Juarez. Title - De-
tection of Cardiac Arrhythmia Patterns through Adap-
tive Analysis.
REFERENCES
Rabbani H., Parsa M., Farahabadi E. and Farahabadi A.,
R-Peak Detection in Electrocardiogram Signal Based
on an Optimal Combination of Wavelet Transform,
Hilbert transform, and Adaptative Thersholding, Jour-
nal of Medical Signals and Sensors, vol. 1, no. 2, pp.
91-98, ago. 2011.
Khandpur R. (2003). Biomedical instrumentation. New
Delhi: Tata McGraw-Hill Publishing Company.
Pooja S., Agrawal M., and Singh L., Automatic Detection
of the R Peaks in Single-Lead ECG Signal, Circuits
Syst Signal Process, New York, March 27, 2017, pp.
4637-4652.
Crema C., Depari A., Flammini A. and Vezzoli A., Efficient
R-Peak Detection Algorithm for Real-time Analysis
of ECG in Portable Devices, IEEE Sensors Applica-
tions Symposium (SAS), Catania, Italy, pp. 1-6, ago.
2016.
Farahabadi H., Farahabadi E. and Rabbani H., Detection of
QRS Complex in Electrocardiogram Signal Based on
a Combination of Hilbert Transform, Wavelet Trans-
form and Adaptive Thresholding, IEEE International
Conference on Biomedical and Health Informatics,
Hong Kong, China, Jan. 5-7, 2012, pp. 170-173.
Chi Lai S., He You S., Wei D. and Tin Gao S., Low-Cost and
Low-Complexity Electrocardiogram Signal Recorder
Design Based on Arduino Platform, Tenth Interna-
tional Conference on Intelligent Information Hid-
ing and Multimedia Signal Processing, Kitakyushu,
Japan, August 27-29, 2014, pp. 309-312.
Analog Devices. (2013). AD8232 Heart Rate
Monitor Hookup Guide. Web page:
https://learn.sparkfun.com/tutorials/ad8232-heart-
rate-monitor-hookup-guide
Quiceno A., Castellanos G., Avendao L. and Ferrero J., Op-
timizaci
´
on en el Desempe
˜
no de Algoritmos de De-
tecci
´
on de Complejos QRS, Revista Avances en Sis-
temas e Inform
´
atica, vol. 4, no. 1, pp. 145-154, ago.
2007.
Roberts M. (2018). Signals and Systems. New York:
McGraw-Hill Education.
Benitez D., Gaydecki P., Zaidi A. and Fitzpatrick A., The
Use of the Hilbert Transform in ECG Signal Analy-
sis, Computers in Biology and Medicine, pp. 400-406,
2001.
Rodriguez R., Mart
´
ınez E., Torres R., Bila J. and Mizera-
Pietraszko J., Adaptive Threshold, Wavelet and
Hilbert Transform for QRS Detection in Electrocar-
diogram Signals, Lecture Notes on Data Engineering
and Communications Technologies, vol. 13, pp. 1-10,
2017.
