
ASK: A Framework for Data Acquisition and Activity Recognition
Hui Liu and Tanja Schultz
Cognitive Systems Lab, University of Bremen, Bremen, Germany
Keywords:
Biosignals, Signal Processing, Automatic Annotation and Segmentation, Human Activity Recognition.
Abstract:
This work puts forward a framework for the acquisition and processing of biosignals to indicate strain on
the knee inflicted by human everyday activities. Such a framework involves the appropriate equipment in
devices and sensors to capture factors that inflict strain on the knee, the long-term recording and archiving of
corresponding multi-sensory biosignal data, the semi-automatic annotation and segmentation of these data, and
the person-dependent or person-adaptive automatic recognition of strain. In this paper we present first steps
toward our goal, i.e. person-dependent recognition of a small set of human everyday activities. The focus
here is on the fully automatic end-to-end processing from signal input to recognition output. The framework
was applied to collect and process a small pilot dataset from one person for a proof-of-concept validation and
achieved 97% accuracy in recognizing instances of seven daily activities.
1 INTRODUCTION
Arthrosis is the most common joint disease world-
wide and is associated with a significant reduction
in the quality of life. The largest proportion is made
of gonarthrosis, which causes high economic damage
due to sick leave, surgeries, invalidity and early re-
tirement. Due to the demographic change, increasing
numbers are expected and since replacement surgery
carries secondary risks, early treatment becomes of
more importance.
Moderate movement is one of the main building
blocks of such treatment. It fosters functional mainte-
nance of the joints by muscular stabilization and im-
provement of proprioception. In addition, movement
is essential for the nutrition of both healthy and dis-
eased cartilage. However, the movement should not
overload the diseased knee joint, as this activates go-
narthrosis and leads to an inflammation in the joint,
which in turn causes more pain.
The main challenge is therefore to find the right
dose of movement, which positively affects the func-
tionality of the joint while preventing movement-
induced overload of the damaged joint.
We envision an application based on a technical
system which continuously keeps track on the dose of
everyday activity movements aka the strain inflicted
on a user’s knee. Therefore, the technical system is
required to capture everyday activities based on rel-
evant biosignals, to process and recognize the per-
formed everyday activities and estimates the resulting
strain on the knee. For this purpose we established a
framework called ASK (Activity Signals Kit).
Human activity recognition is intensively studied
and a large body of research shows results of recog-
nizing all kinds of human daily activities, including
running, sleeping or performing gestures.
For this purpose a large variety of biosignals are
captured by various sensors, e.g. (Mathie et al., 2003)
applied wearable triaxial accelerometers attached to
the waist to distinguish between rest (sit) and active
states (sit-to-stand; stand-to-sit and walk). Five bi-
axial accelerometers were used in (Bao and Intille,
2004) to recognize daily activities such as walking,
riding escalator and folding laundry. In (Kwapisz
et al., 2010) the authors placed an Android cell phone
with a simple accelerometer into the subjects’ pocket
and discriminated activities like walking, climbing,
sitting, standing and jogging. Furthermore, (Lukow-
icz et al., 2004) combined accelerometers with micro-
phones to include a simple auditory scene analysis.
Muscle activities captured by ElectroMyoGraphy
(EMG) is another useful biosignal. It even provides
the option to predict a person’s motion intention prior
to actually moving a joint, like investigated in (Fleis-
cher and Reinicke, 2005) for the purpose of an actu-
ated orthosis. Moreover, some researchers like (Rowe
et al., 2000) and (Sutherland, 2002) applied electrogo-
niometers to study kinematics.
The majority of studies applies one type of sensors
262
Liu, H. and Schultz, T.
ASK: A Framework for Data Acquisition and Activity Recognition.
DOI: 10.5220/0006732902620268
In Proceedings of the 11th International Joint Conference on Biomedical Engineering Systems and Technologies (BIOSTEC 2018) - Volume 4: BIOSIGNALS, pages 262-268
ISBN: 978-989-758-279-0
Copyright © 2018 by SCITEPRESS – Science and Technology Publications, Lda. All rights reserved

as, i.e. either accelerometers, EMG sensors or elec-
trogoniometers. However, the combination of sensors
and thus the fusion of biosignals may improve the ro-
bustness of the system or the accuracy of recognition.
(Rebelo et al., 2013) studied the classification of iso-
lated human activities based on all of the three above
described sensors (acceleration, EMG, goniometer)
attached to the knee. They successfully recognized
seven types of activities, i.e. sit, stand, sit down,
stand up, walk, ascend and descend, with an accu-
racy of about 98% in person dependent recognition.
While these results are very encouraging, it still re-
mains challenging to robustly recognize a large va-
riety of human everyday activities in the real world.
The first step to achieve this goal is to build a frame-
work for recording, annotating and processing biosig-
nals and applying the processed biosignal data to ac-
tivity recognition and strain prediction. Such a frame-
work includes:
• a high-quality wireless biosignal data recording
device with appropriate sensors,
• a mobile data acquisition and archiving system,
• an alignment method to semi-automatically anno-
tate the biosignal data,
• a real-time system to robustly recognize everyday
activities,
• a strain prediction system based on recognized ac-
tivities and biomechanical as well as medical ex-
pert knowledge.
In this paper we focus on a proof-of-concept vali-
dation of everyday activity recognition. For this pur-
pose we collected a pilot dataset consisting of biosig-
nals captured by two accelerometers, four EMG sen-
sors and one electrogoniometer. Subsequently, the
dataset was used to evaluate the recognition system.
To model human activities we followed the ap-
proach as described in (Rebelo et al., 2013) and used
Hidden-Markov-Models (HMM). HMMs are widely
used to a wide range of activity recognition tasks,
such as in (Lukowicz et al., 2004) and (Amma et al.,
2010). In the latter, the authors present a wearable
system that enables 3D handwriting recognition based
on HMMs. In this so-called Airwriting system the
users write text in the air as if they were using an
imaginary blackboard, while the handwriting gestures
are captured wirelessly by accelerometers and gyro-
scopes attached to the back of the hand (Amma et al.,
2010).
In this paper we focus on a seven basic daily ac-
tivities to validate our framework, i.e. the activities
”sit”, ”stand”, ”sit-to-stand”, ”stand-to-sit”, ”walk”,
”curve-left” and ”curve-right”. Five of these activi-
ties correspond to those described in (Rebelo et al.,
2013), while the remaining two activities ”ascend”
and ”descend” in (Rebelo et al., 2013) were replaced
by ”curve-left” and ”curve-right”. Thus, the total
number of seven activities is the same in both stud-
ies.
2 THE ACTIVITY SIGNALS KIT
(ASK)
The goal of our pilot study is to validate the end-to-
end activity recognition system of the ASK frame-
work. We first selected a suitable device and sen-
sors to continuously capture the activity data. Subse-
quently the are automatically archived and processed
for the recognition and validation steps.
2.1 Equipment and Setup
2.1.1 Device
We chose the biosignalsplux Research Kits
1
as
recording device. One PLUX hub
2
records signals
from 8 channels (each up to 16 bits) simultaneously.
We used two hubs for recording data and connected
the hubs with a synchronization cable which syn-
chronizes signals between the hubs at the beginning
of each recording. This procedure ensures the time-
alignment of sensor data during the entire recording.
2.1.2 Biosignals and Sensors
Similar to (Mathie et al., 2003), we used two triaxial
accelerometers
3
, four bipolar EMG sensors
4
(instead
of six) and both channels of one biaxial electrogo-
niometer
5
together. Instead of using only one channel
of the electrogoniometer as in (Mathie et al., 2003),
we used both channels to measure both the frontal and
sagital plain since we need to recognize rotational ac-
tivities like ”curve-left” and ”curve-right”.
One channel on the hub1 was plugged with a
pushbutton
6
. It is used for the semi-automatic anno-
tation mechanism (See Section 2.3.1). The signals of
all sensors were recorded wirelessly at different sam-
pling rate. Table 1 shows the sampling rate of each
sensor.
1
biosignalsplux.com/researcher
2
store.plux.info/components/263-8-channel-hub-820201701
.html
3
biosignalsplux.com/acc-accelerometer
4
biosignalsplux.com/emg-electromyography
5
biosignalsplux.com/ang-goniometer
6
biosignalsplux.com/pushbutton
ASK: A Framework for Data Acquisition and Activity Recognition
263
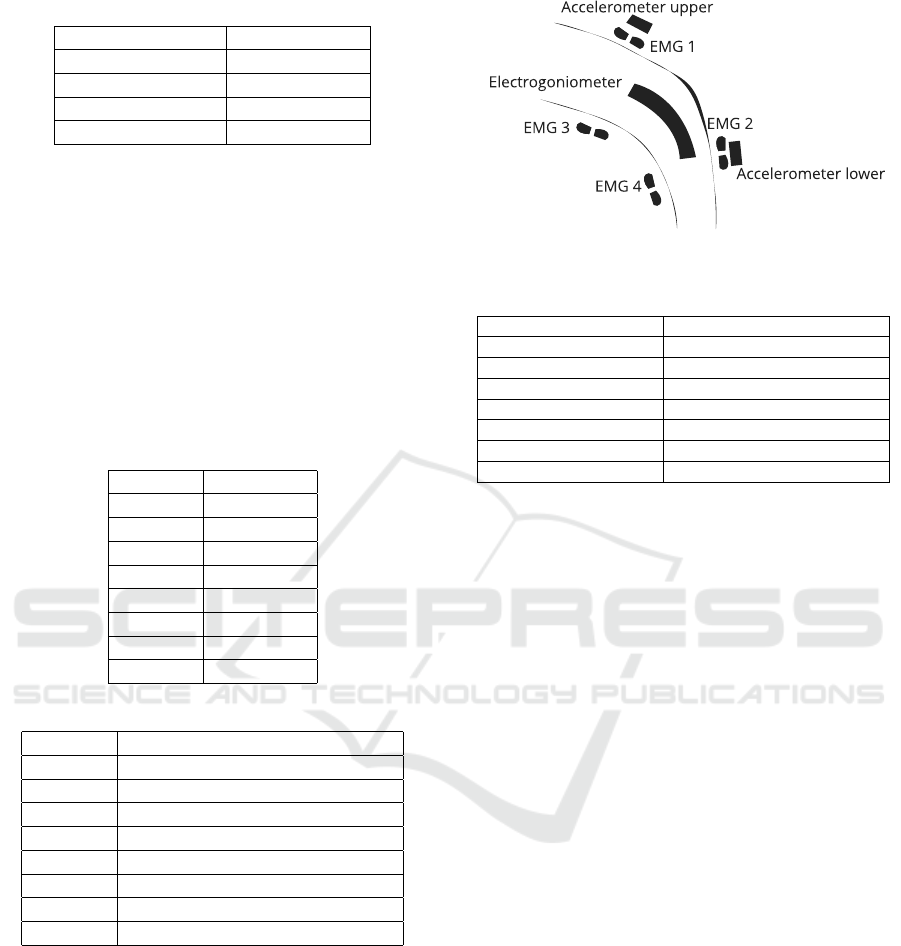
Table 1: Sampling rates of sensors.
Sensor Sampling rate
Accelerometer 100Hz
Electrogoniometer 100Hz
EMG 1000Hz
Pushbutton 1000Hz
Accelerometer and Electrogoniometer signal are
both slow signals, while the nature of EMG signals
require higher sampling rates. ”Pushbutton” is not
a biosignal but a signal which supports annotation.
While this signal only requires low sampling rates, we
plugged it into the ”faster” hub at 1000Hz because the
”slower” channels were already taken. Low-sampled
channels at 100Hz are up-sampled to 1000Hz to be
synchronized and aligned with high-sampled chan-
nels. Table 2 and Table 3 show the arrangement of
the sensors on both hubs.
Table 2: Channel layout of PLUX Hub1 (”faster”).
Channel Sensor
1 EMG 1
2 EMG 2
3 EMG 3
4 EMG 4
5 Pushbutton
6 -
7 -
8 -
Table 3: Channel layout of PLUX Hub2 (”slower”).
Channel Sensor
1 Accelerometer (upper) X-axis
2 Accelerometer (upper) Y-axis
3 Accelerometer (upper) Z-axis
4 Electrogoniometer - sagital plain
5 Accelerometer (lower) X-axis
6 Accelerometer (lower) Y-axis
7 Accelerometer (lower) Z-axis
8 Eletrogoniometer - frontal plain
2.1.3 Sensor Placement
Figure 1 and Table 4 describe the sensor placement.
2.2 Data Acquisition
The official OpenSignals software from the company
PLUX supports neither annotation nor real-time data
piping, where the former doesn’t meet our needs
of automatic segmentation at the present stage, and
the latter prohibits the real-time end-to-end activ-
ity recognition of our goal. In this regard we pro-
Figure 1: Schematic view of Sensor placement on the Knee.
Table 4: Sensor placement and captured muscles.
Sensor Position / Muscle
Accelerometer (upper) Thigh, proximal ventral
Accelerometer (lower) Shank, distal ventral
EMG 1 Musculus vastus medialis
EMG 2 Musculus tibialis anterior
EMG 3 Musculus biceps femoris
EMG 4 Musculus gastrocnemius
Electrogoniometer Knee of the right leg, lateral
grammed an ASK software with graphic user interface
and abundant functionalities using the driver library
provided by PLUX. The ASK software connects and
synchronizes several PLUX hubs easily and automat-
ically, then collects data from all hubs simultaneous
and constantly. All recorded data are archived orderly
with date and time stamps for further use. More func-
tionalities of the ASK software like semi-automatic
annotation, automatic segmentation, automatic recog-
nition and validation are introduced in the following
sections.
2.3 Annotation and Segmentation
We implemented a semi-automatic annotation mech-
anism within the framework of the ASK software.
When the annotation mode is switched on in the ASK
software, a pre-defined acquisition protocol is loaded,
which prompts the user to perform the activities one
after the other. For this purpose each activity is dis-
played on the screen one-by-one while the user con-
trols the activity recording by pushing, holding and
releasing the pushbutton (See Figure 2).
2.3.1 Annotation Mechanism
The user follows the instructions of the ASK soft-
ware step-by-step. For example the prompted activ-
ity states ”walk”, the user sees the instruction ”Please
hold the pushbutton and do: walk”. The user prepares
for it, then pushes the button and starts to ”walk”
She/he keeps holding the pushbutton while walking
BIOSIGNALS 2018 - 11th International Conference on Bio-inspired Systems and Signal Processing
264
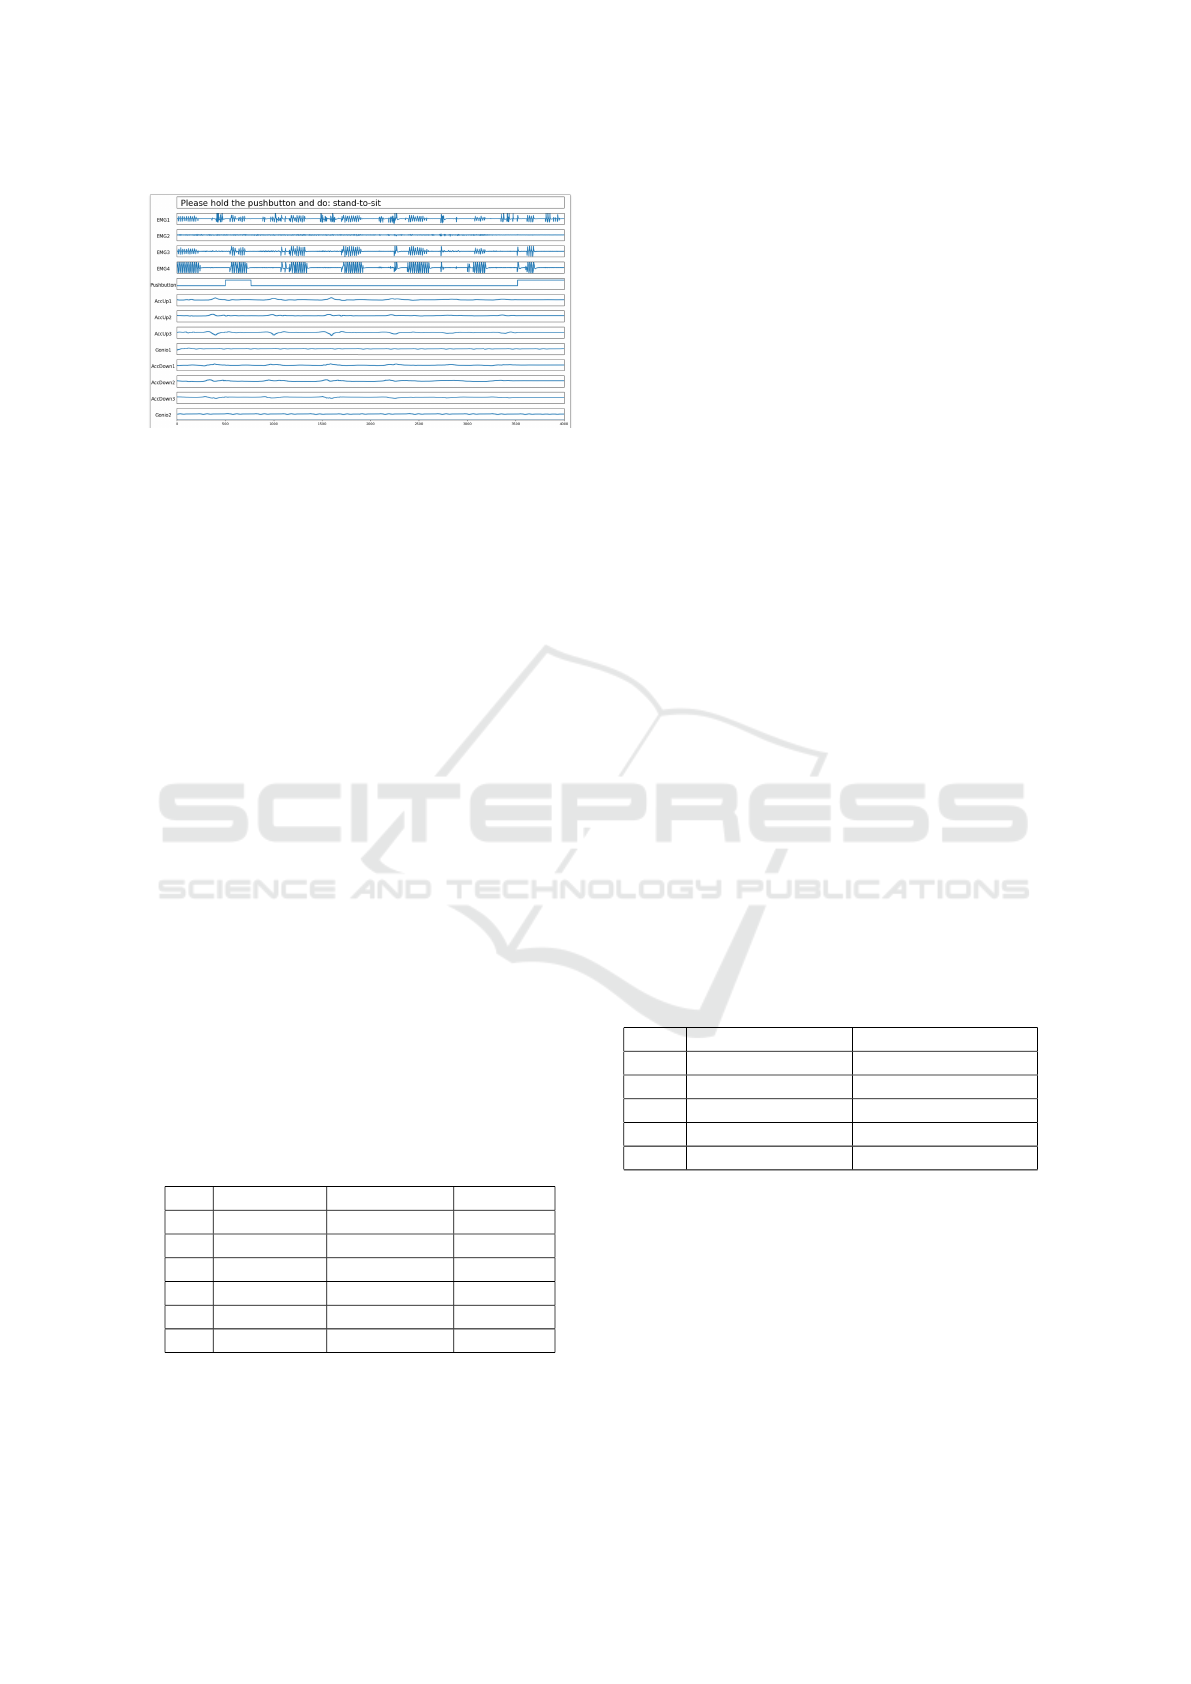
Figure 2: Screenshot of the ASK software with annotation
mode: the next activity to do is ”stand-to-sit”.
for a duration at will, then releases the pushbutton to
finish this activity. With the release, the system dis-
plays the next activity instruction, e.g. ”curve-left”,
the process continues until the predefined acquisition
protocol is fully processed.
2.3.2 Acquisition Protocol
For the proof-of-concept of our framework, we in-
tended to efficiently record a first pilot dataset. There-
fore, we organized the seven activities in two clusters
- ”stay-in-place” and ”move-around”, which results
in two activity lists for the acquisition protocol as fol-
lows:
Activity list 1 ”Stay-in-place” (40 repetitions):
sit → sit-to-stand → stand → stand-to-sit.
Activity list 2 ”Move-around” (25 Repetitions):
walk → curve-left → walk * (turn around) * walk
→ curve-right → walk * (turn around).
2.3.3 Segmentation
The ASK software records all sensor data along with
the timestamps/frame numbers of each button push
and button release. These data are archived in csv files
as annotation results for each activity. Table 5 shows
an annotation result example of a recording with ac-
tivity list ”Stay-in-place”.
Table 5: Example of Annotation file.
No Activity From frame To frame
1 sit 3647 6163
2 sit-to-stand 6901 9467
3 stand 11388 14181
4 stand-to-sit 16265 18882
5 sit 19396 22119
... ... ... ...
Since we synchronized all data at 1000Hz, i.e.
each frame represents data from 1 millisecond. As
shown in Table 5, the first activity segment labeled
”sit” lasts 2.517 seconds. The corresponding 2517
frames are used in one block for training the activity
model ”sit”, as described below.
The time at the beginning of each recording and
time between the release and push of the button, e.g.
0s–3.646s or 6.164s–6.900s in Table 5 corresponds to
the preparation time. Therefore, the respective frames
are neither used for model training nor applied to de-
coding. However, these samples are still meaningful
for continuous recognition and natural scenarios.
2.3.4 Caveats on the Annotation Mechanism
The semi-automatic annotation mechanism in the
ASK Framework was implemented to reduce the time
and costs of manual annotation. However, this mech-
anism is not suitable for the acquisition and recogni-
tion of everyday activities in real life. (Rebelo et al.,
2013) used simultaneous video recordings of the ex-
periments to create references. Though it seems that
video or other capturing technologies are required for
ground truth generation, the ASK semi-automatic an-
notation mechanism is still valid method to support
the tuning of preprocessing parameters, pre-training
models and proof-of-concepts.
3 EXPERIMENTAL DATA
We applied the described framework to the collection
of a pilot data set for a proof-of-concept study.
We collected four recordings from one male subject,
two for each activity list. Table 6 summarizes the
recordings.
Table 6: Content and duration of recordings.
No. Activity list Total length (sec)
1 1-”Stay-in-place” 189.442
2 1-”Stay-in-place” 197.951
3 2-”Move-around” 177.809
4 2-”Move-around” 309.076
Sum Seven activities 874.278 (14.57min)
Due to the organization of activity sequences in
terms of activity lists, recordings were done very ef-
ficiently with only small amounts of wasted frames
(”preparation time”) or redundancy. The total length
of the four recordings adds up to about fifteen min-
utes. While this pilot data set is very small, we per-
formed activity recognition experiments to validate
the implemented framework.
With the annotation mode switched on, the ASK
software allows to accumulate recording statistics
such as the number of occurrences and total length
ASK: A Framework for Data Acquisition and Activity Recognition
265

Table 7: Experimental Data: Activity Analysis.
Activity Occurrences Minimum length Maximum length Total length
sit 25 1.637s 7.777s 79.916s
stand 23 1.491s 17.818s 81.405s
sit-to-stand 24 1.444s 2.566s 47.308s
stand-to-sit 23 1.189s 2.836s 44.109s
walk 67 1.351s 4.566s 172.933s
curve-left 17 1.811s 12.997s 61.950s
curve-right 16 1.563s 18.117s 66.250s
Total 195 Global min.: 1.189s Global max.: 18.117s 553.871s (9.23min)
for each activity over all segmentations. As can be
seen from Table 7 the recorded data are reasonably
balanced, with some noticeable exceptions:
• walk: the amount and duration of the activity
”walk” is considerably larger than other activities;
• sit-to-stand & stand-to-sit: these two activities
are inherently shorter than the other activities;
• curve-left & curve-right: the maximum length
of these two activities is unusual but under con-
trol. The subject walked in circle sometimes in
order to produce data of some special situation for
testing the stability of the decoder.
From Table 7 we can also see that, no activity in
the pilot dataset is shorter than 1.189 seconds. This
a priori information helps us to decide some impor-
tant parameters such as window length and window
overlap length of our recognition model.
4 EXPERIMENTAL RESULTS
AND ANALYSIS
Based on the recorded pilot dataset and the automat-
ically generated reference labels for each segment
from the ASK software, we performed several experi-
ments to validate our activity recognition system.
4.1 Processing and Feature Extraction
First, a mean normalization is applied to the acceler-
ation and EMG signals to reduce the impact of Earth
acceleration and to set the baseline of the EMG sig-
nals to zero. Next, the EMG signal is rectified, a
widely adopted signal processing method.
Prior to feature extraction the signals are win-
dowed using a rectangular window function with
overlapping windows. Based on initial experiments
we chose a window length of 400ms with a window
overlap of 200ms since these values gave best recog-
nition results on a tuning test set.
Subsequently, features were extracted for each of
the resulting frames. We denote number of samples
per window by N and the samples in the window by
(x
1
, ..., x
N
). We adopted the features from (Rebelo
et al., 2013) and extracted for each window the
average for the accelerometer and electrogoniometer
signal, defined as:
avg =
1
N
N
∑
n=1
x
n
, (1)
For the EMG signal we extracted for each window
the Root Mean Square:
RMS =
s
1
N
N
∑
k=1
x
2
n
(2)
As we focus in this work on the validation of our
framework, the studies of the feature selection, com-
bination and evaluation is out of the scope of this pa-
per but will be investigated in follow-up studies.
4.2 Modeling, Training and Decoding
We applied our HMM-based inhouse decoder BioKIT
to model and recognize the described activities.
BioKIT supports the training of Gaussian-Mixture-
Models (GMMs) to model the HMM emission prob-
abilities. Each activity is modeled by a one-state
HMM, where each state is modeled by 9 Gaussians.
This setup gave best results on a tuning test set. To
evaluate the recognition error rate, we performed a
10-fold cross validation, i.e. we applied 10 folds with
each time 90% of data for training the GMM and 10%
for testing the resulting models.
4.3 Recognition Results for Validation
We performed a leave-one-out cross-validation for
our pilot dataset. Figure 3 shows the confusion matrix
of the recognition results using all sensors in Table 2
and Table 3.
BIOSIGNALS 2018 - 11th International Conference on Bio-inspired Systems and Signal Processing
266
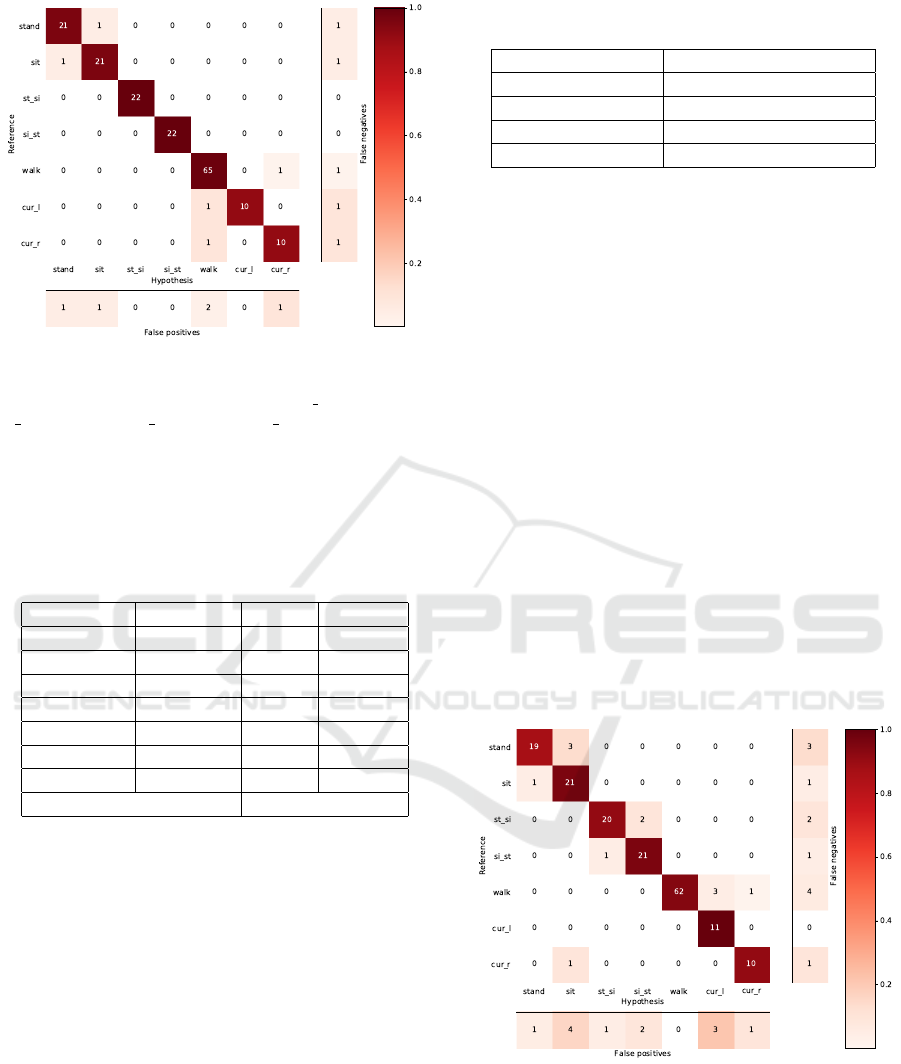
Figure 3: Confusion matrix for recognition results based
on signals from two accelerometers, four EMG sensors and
both channels of one electrogoniometer. st si: stand-to-sit;
si st: sit-to-stnd; cur l: curve-left; cur r: curve-right.
Table 8 gives the criteria Precision, Recall, F-
Score and Classification Accuracy of the recognition
results.
Table 8: Recognition results based on signals from two ac-
celerometers, four EMG sensors and both channels of one
eletrogoniometer.
Activity Precision Recall F-Score
stand 0.95 0.95 0.95
sit 0.95 0.95 0.95
stand-to-sit 1.00 1.00 1.00
sit-to-stand 1.00 1.00 1.00
walk 0.97 0.98 0.98
curve-left 1.00 0.91 0.95
curve-right 0.91 0.91 0.91
Classification accuracy 0.97
The activity recognition results for our pilot small-
scale dataset are encouraging. The classification ac-
curacy reached 97%. Activities ”sit-to-stand” and
”stand-to-sit” were correctly recognized. Since both
are transitional activities, signal changes might be
more prominent than in other activities. ”Stand” and
”sit” give mixed result, for they are both static activ-
ities. The activities ”walk”, ”curve-left” and ”curve-
right” exhibit to be confusable, which corresponds to
our expectation. .
4.4 Single Sensor Results
We performed experiments on single sensor setups.
Table 9 summarizes the single-sensor recognition re-
sults.
Results from Table 9 indicate that the use of ac-
celerometers alone achieves an accuracy of 0.93, out-
Table 9: Single-Sensor recognition accuracy for each activ-
ity.
Sensor Recognition Accuracy
Accelerometer 0.93
EMG 0.63
Electrogoniometer 0.74
All 0.97
performing the single-sensor results when using EMG
or electrogoniometer. However, both enhance the per-
formance if we compare the results between all sen-
sors combination and accelerometers alone.
Figure 4 - 6 illustrate the confusion matrices of the
decoding results.
5 CONCLUSION
In this paper, we introduced a framework ASK for
biosignal data acquisition, processing and human ac-
tivity recognition. The framework includes the selec-
tion of appropriate equipment, the acquisition soft-
ware for long-term recording and archiving, the semi-
automatic annotation and segmentation, and the auto-
matic activity recognition based on Hidden-Markov-
Models. As a first step toward our goal, we evaluated
the framework based on a pilot dataset of human ev-
eryday activities. Initial results of a person-dependent
recognition system achieved 97% accuracy of seven
everyday activities.
Figure 4: Confusion matrix from recognition based on ac-
celerometer signal.
ASK: A Framework for Data Acquisition and Activity Recognition
267
Figure 5: Confusion matrix from recognition based on
EMG signal.
Figure 6: Confusion matrix from recognition based on elec-
trogoniometer signal.
ACKNOWLEDGEMENTS
We would like to thank Filipe Silva from PLUX wire-
less biosignals S.A for his great help and support with
the PLUX devices, sensors and drivers.
REFERENCES
Amma, C., Gehrig, D., and Schultz, T. (2010). Airwrit-
ing recognition using wearable motion sensors. In
First Augmented Human International Conference,
page 10. ACM.
Bao, L. and Intille, S. S. (2004). Activity recognition from
user-annotated acceleration data. In Pervasive com-
puting, pages 1–17. Springer.
Fleischer, C. and Reinicke, C. (2005). Predicting the in-
tended motion with emg signals for an exoskeleton
orthosis controller. In 2005 IEEE/RSJ International
Conference on Intelligent Robots and Systems (IROS
2005), pages 2029–2034.
Kwapisz, J. R., Weiss, G. M., and Moore, S. A. (2010).
Activity recognition using cell phone accelerometers.
In Proceedings of the Fourth International Workshop
on Knowledge Discovery from Sensor Data, pages 10–
18.
Lukowicz, P., Ward, J. A., Junker, H., Stger, M., Trster, G.,
Atrash, A., and Starner, T. (2004). Recognizing work-
shop activity using body worn microphones and ac-
celerometers. In In Pervasive Computing, pages 18–
32.
Mathie, M., Coster, A., Lovell, N., and Celler, B. (2003).
Detection of daily physical activities using a triaxial
accelerometer. In Medical and Biological Engineer-
ing and Computing. 41(3):296-301.
Rebelo, D., Amma, C., Gamboa, H., and Schultz, T. (2013).
Activity recognition for an intelligent knee orthosis.
In 6th International Conference on Bio-inspired Sys-
tems and Signal Processing, pages 368–371. BIOSIG-
NALS 2013.
Rowe, P., Myles, C., Walker, C., and Nutton, R. (2000).
Knee joint kinematics in gait and other functional ac-
tivities measured using exible electrogoniometry: how
much knee motion is sucient for normal daily life?
Gait & posture, 12(2):143–155.
Sutherland, D. H. (2002). The evolution of clinical
gait analysis: Part ii kinematics. Gait & Posture,
16(2):159–179.
BIOSIGNALS 2018 - 11th International Conference on Bio-inspired Systems and Signal Processing
268
