
Countering Bias in Tracking Evaluations
Gustav H
¨
ager, Michael Felsberg and Fahad Khan
Computer Vision Lab, Link
¨
oping University, Sweden
Keywords:
Tracking, Evaluation.
Abstract:
Recent years have witnessed a significant leap in visual object tracking performance mainly due to powerful
features, sophisticated learning methods and the introduction of benchmark datasets. Despite this significant
improvement, the evaluation of state-of-the-art object trackers still relies on the classical intersection over
union (IoU) score. In this work, we argue that the object tracking evaluations based on classical IoU score are
sub-optimal. As our first contribution, we theoretically prove that the IoU score is biased in the case of large
target objects and favors over-estimated target prediction sizes. As our second contribution, we propose a new
score that is unbiased with respect to target prediction size. We systematically evaluate our proposed approach
on benchmark tracking data with variations in relative target size. Our empirical results clearly suggest that
the proposed score is unbiased in general.
1 INTRODUCTION
A significant progress has been made in challenging
computer vision problems, including object detection
and tracking during the last few years (Kristan et al.,
2016), (Russakovsky et al., 2015). In object detection,
the task is to simultaneously classify and localize an
object category instance in an image whereas visual
tracking is the task of estimating the trajectory and
size of a target in a video. Generally, the evaluation
methodologies employed to validate the performance
of both object detectors and trackers are based on the
intersection over union score (IoU). The IoU provi-
des an overlap score for comparing the outputs of
detection/tracking methods with the given annotated
ground-truth. Despite its widespread use, little rese-
arch has been done on the implications of IoU score
during object detection and tracking performance eva-
luations.
Recent years have seen a significant boost in
tracking performance both in terms of accuracy and
robustness. This significant jump in tracking perfor-
mance is mainly attributed to the introduction of ben-
chmark datasets, including the visual object tracking
(VOT) benchmark (Kristan et al., 2016). In the VOT
benchmark, object trackers are ranked according to
their accuracy and robustness. The accuracy is deri-
ved from the IoU score (Jaccard, 1912),(Everingham
et al., 2008), while the robustness is related to how
often a particular tracker loses the object. Different
to VOT, the online tracking benchmark (Wu et al.,
2015) (OTB) only takes accuracy into account by
again using evaluation methodologies based on IoU
criteria. Both the VOT and OTB benchmarks contain
target objects of sizes ranging from less than one per-
cent to approximately 15% of the total image area.
The lack of larger objects in object tracking bench-
marks is surprising, as it directly corresponds to situ-
ations where the tracked object is close to the camera.
However, in such cases, the de facto tracking evalu-
ation criteria based on IoU score will be sub-optimal
due to its bias towards over-estimated size prediction
of targets. In this work, we theoretically show that
the standard IoU is biased since it only considers the
ground-truth and target prediction area, while igno-
ring the remaining image area (see figure 1).
When dealing with large size target objects, a
naive strategy is to over-estimate the target size by
simply outputting the entire image area as a pre-
dicted target region (see figure 1). Ideally, such a
naive strategy is expected to be penalized by the stan-
dard tracking evaluation measure based on the IoU
score. Surprisingly, this is not the case (Felsberg
et al., 2016). The IoU based standard evaluation met-
hodology fails to significantly penalize such an over-
estimated target prediction case, thereby highlighting
the bias within the IoU score.
In this paper, we provide a theoretical proof that
the standard IoU score is biased in case of large target
objects. To counter this problem, we propose an unbi-
Häger, G., Felsberg, M. and Khan, F.
Countering Bias in Tracking Evaluations.
DOI: 10.5220/0006714805810587
In Proceedings of the 13th International Joint Conference on Computer Vision, Imaging and Computer Graphics Theory and Applications (VISIGRAPP 2018) - Volume 5: VISAPP, pages
581-587
ISBN: 978-989-758-290-5
Copyright © 2018 by SCITEPRESS – Science and Technology Publications, Lda. All rights reserved
581

Figure 1: An example image, where the target (red) covers
a large area of the image. The tracker outputs a target pre-
diction (blue) covering the entire image. The standard IoU
score will be equal to the ratio between the size of the target
and the total image size, assigning an overlap score of 0.36.
Our proposed unbiased score assigns a significantly lower
score of 0.11, as it penalizes the severe over-estimation of
the target size.
ased approach that accounts for the total image area.
Our new score is symmetric with respect to errors in
target prediction size. We further validate our propo-
sed score with a series of systematic experiments si-
mulating a wide range of target sizes in tracking sce-
narios. Our results clearly demonstrate that the pro-
posed score is unbiased and is more reliable than the
standard IoU score when performing tracking evalua-
tions on videos with a wide range of target sizes.
2 RELATED WORK
A significant leap in performance has been witnes-
sed in recent years for both object detection and
tracking (Kristan et al., 2014),(Everingham et al.,
2008). Among other factors, this dramatic impro-
vement in tracking detection performance is attribu-
ted to the availability of benchmark datasets (Kristan
et al., 2014),(Russakovsky et al., 2015). These ben-
chmark datasets enable the construction of new met-
hods by providing a mechanism for systematic per-
formance evaluation with existing approaches. The-
refore, it is imperative to have a robust and accurate
performance evaluation score that is consistent over
different scenarios. Within the areas of object de-
tection and tracking (Everingham et al., 2008), (Wu
et al., 2013),(Russakovsky et al., 2015), standard eva-
luation methodologies are based on the classical in-
tersection over union (IoU) score. The IoU score,
also known as Jaccard overlap (Jaccard, 1912), ta-
kes into account both the intersection and the union
between the ground-truth and target prediction. The
score compares the distance between a pair of binary
feature vectors. Despite its widespread use, the IoU
score struggles with large size target objects.
Other than the IoU score, the F1 score is com-
monly employed in medical imaging and text proces-
sing. The F1 score is computed as the geometric mean
of the precision and recall scores and can be viewed
as analogous to the IoU score. However, a drawback
of F1 score measure is its inability to deal with highly
skewed datasets, as it does not sufficiently account the
true negatives obtained during the evaluation (Powers,
2011). Most tracking benchmarks are highly skewed,
as they contain significantly more pixels annotated as
background than the target object. Surprisingly, this
problem has not been investigated in the context of
object detection and visual tracking.
In the context of object detection, the issue of
skewed data is less apparent since the overlap bet-
ween the target prediction and ground-truth is only
required to be greater than a certain threshold (ty-
pically 0.5). Different to object detection, the eva-
luation criteria in object tracking is not limited to a
single threshold value. Instead, the tracking perfor-
mance is evaluated over a range of different threshold
values. Further, the final tracking accuracy is com-
puted as an average overlap between target prediction
and the ground-truth over all frames in a video. In this
work, we investigate the consequences of employing
IoU metric in visual object tracking performance eva-
luation.
3 OVERLAP SCORES
Here we analyze the traditional intersection over
union (IoU) O. We prove that it is biased with re-
gard to the prediction size. The reasoning is built on
the notion of four different regions of the image given
by the annotation bounding box, S
a
, and the detection
bounding box, S
d
. These areas are: A
da
= |S
a
∩ S
d
|
(true positive), A
d ¯a
= |S
d
∩
¯
S
a
| (false positive), A
¯
da
=
|
¯
S
d
∩S
a
| (false negative), and A
¯
d ¯a
= |
¯
S
d
∩
¯
S
a
| (true ne-
gative).
3.1 Bias Analysis for Intersection over
Union
The classical IoU, O measures the overlap as the ratio
of the intersection area between detection and ground
truth, and union area:
O =
A
ad
A
ad
+ A
¯ad
+ A
a
¯
d
(1)
VISAPP 2018 - International Conference on Computer Vision Theory and Applications
582

Figure 2: One dimensional image (black) with the annota-
tion (red) and the bounding box (green). Image coordinates
range from 0 to 1.
While the IoU behaves satisfactorily for objects
of smaller size, it does not function well when ob-
jects are larger enough to cover a significant portion
of the image. For an annotation of covering most of
the image area it is possible for the tracker to set the
prediction size to cover the full image, and still main-
tain good overlap.
We will now show that the IoU is biased with re-
spect to the size of the prediction. To simplify the
derivation, we consider without loss of generality a
one dimensional image. As the IoU only considers
areas of prediction and ground truth, extending the
reasoning to two dimensional images can be done tri-
vially. A visualization of the one dimensional image,
with the annotated bounding interval in red and the
detection interval in green can be seen in figure 2.
In one dimension the annotation is an interval star-
ting at A
s
, and ending in A
e
. The prediction interval
starts at D
s
and ends at D
e
. A small perturbation of
D
s
or D
e
, will change the overlap interval I
ad
, or the
false positive interval I
¯ad
respectively. As we will now
show the IoU is not the optimal choice for overlap
comparison as it does not treat errors in position and
size equally.
We assume that the overlap is non-empty, i.e.,
D
s
< A
e
∧ D
e
> A
s
. We then get four different ca-
ses of imperfect alignment (I
a
∩ I
d
= I
ad
and I
a
∪ I
d
=
I
ad
+ I
¯ad
+ I
a
¯
d
; figure 2 shows case 4.):
case boundaries I
a
∩ I
d
I
a
∪ I
d
1. D
s
< A
s
∧ D
e
> A
e
A
e
− A
s
D
e
− D
s
2. D
s
< A
s
∧ D
e
< A
e
D
e
− A
s
A
e
− D
s
3. D
s
> A
s
∧ D
e
< A
e
D
e
− D
s
A
e
− A
s
4. D
s
> A
s
∧ D
e
> A
e
A
e
− D
s
D
e
− A
s
By considering a change in position of the boun-
ding box ε
p
, [D
s
;D
e
] 7→ [D
s
+ε
p
;D
e
+ε
p
], and a small
change in size ε
s
, [D
s
;D
e
] 7→ [D
s
− ε
s
;D
e
+ ε
s
], we
compute the effect they will have on the resulting IoU,
respectively. Starting with the size change, the IoU
for case 4 becomes:
O =
A
e
− (D
s
− ε
s
)
D
e
+ ε
s
− A
s
=
A
e
− D
s
+ ε
s
D
e
− A
s
+ ε
s
. (2)
Taking the derivative with respect to ε
s
yields
∂O
∂ε
s
=
(D
e
− A
s
+ ε
s
) − (A
e
− D
s
+ ε
s
)
(D
e
− A
s
+ ε
s
)
2
(3)
At the stationary solution, i.e., ε
s
= 0, we thus obtain
lim
ε
s
→0
∂O
∂ε
s
=
(D
e
− A
s
) − (A
e
− D
s
)
(D
e
− A
s
)
2
=
(I
ad
+ I
¯ad
+ I
a
¯
d
) − I
ad
(I
ad
+ I
¯ad
+ I
a
¯
d
)
2
> 0
(4)
Where we have used the fact that: A
e
− D
s
= I
ad
, and
D
e
− A
s
= I
ad
+ I
¯ad
+ I
a
¯
d
Following the same procedure for the case of a
change in position we get for ε
p
:
O =
A
e
− (D
s
+ ε
p
)
D
e
+ ε
p
− A
s
=
A
e
− D
s
− ε
p
D
e
− A
s
+ ε
p
. (5)
lim
ε
p
→0
∂O
∂ε
p
= −
(D
e
− A
s
) + (A
e
− D
s
)
(D
e
− A
s
)
2
=
−
(I
ad
+ I
¯ad
+ I
a
¯
d
) + I
ad
(I
ad
+ I
¯ad
+ I
a
¯
d
)
2
< 0
(6)
Computing both derivatives for all cases 1.-4. re-
sults in the following table:
case ε
s
ε
p
1. −
2I
ad
(I
ad
+I
¯ad
+I
a
¯
d
)
2
< 0 0
2.
(I
ad
+I
¯ad
+I
a
¯
d
)−I
ad
(I
ad
+I
¯ad
+I
a
¯
d
)
2
> 0
(I
ad
+I
¯ad
+I
a
¯
d
)+I
ad
(I
ad
+I
¯ad
+I
a
¯
d
)
2
> 0
3.
2(I
ad
+I
¯ad
+I
a
¯
d
)
(I
ad
+I
¯ad
+I
a
¯
d
)
2
> 0 0
4.
(I
ad
+I
¯ad
+I
a
¯
d
)−I
ad
(I
ad
+I
¯ad
+I
a
¯
d
)
2
> 0 −
(I
ad
+I
¯ad
+I
a
¯
d
)+I
ad
(I
ad
+I
¯ad
+I
a
¯
d
)
2
< 0
The zero entries above imply that if the annotation
lies completely inside the detection (case 1.) or the
detection lies completely inside the annotation (case
3.), an incremental shift does not change the IoU me-
asure. The negative/positive derivatives of ε
s
in case
1. and 3. lead to a compensation of a too large/too
small detection. The positive/negative derivatives of
ε
p
in case 2. and 4. lead to a compensation of a
detection-displacement to the left/right. The proble-
matic cases are the positive derivatives of ε
s
in case
2. and 4.: In the case of a displacement error, the IoU
measure is always improved by increasing the size of
the detection. For the majority of cases a slight in-
crease in detection size will improve the overlap, only
for the first case when the detection is overlapping on
both sides will it decrease the overlap score. This is in
contrast to the change in position where it is equally
likely to decrease the overlap depending on the di-
rection selected. This results in a biased estimate of
the object size.
3.2 Unbiased Intersection over Union
In order to remove this bias we also account for the
true negatives, that is the parts of the image that is
Countering Bias in Tracking Evaluations
583

neither annotated as belonging to the target, or con-
sidered to be part of the object by the tracker. We do
this by computing an IoU score for the object as usual,
but also the inverse IoU, that is IoU with respect to the
background. We then weight these two together using
the relative weights w
o
and w
bg
, derived from the size
of the object in the image. The new unbiased overlap
metric is:
ˆ
O =
A
ad
A
ad
+ A
¯ad
+ A
a
¯
d
w
o
+
A
¯a
¯
d
A
¯a
¯
d
+ A
a
¯
d
+ A
¯ad
w
bg
(7)
It is now no longer possible to simply increase the
bounding box size and obtain a better IoU, since ex-
cessive background will be penalized by the second
term. The severity of the penalty is balanced by the
w
bg
factor. All that remains is then to set the cor-
responding weights in a principled manner. A naive
approach would be to set the weighting based on the
relative size of the object in the image. However since
we wish to equalize the impact of estimating the size
wrongly in the case of displacement errors, we can
use this to calculate a better weighting. We do this by
returning to the one dimensional case used before, but
with our new measure that includes the background:
O
bg
=
I
¯a
¯
d
I
¯a
¯
d
+ I
¯ad
+ I
a
¯
d
=
1 − D
e
+ A
s
1 − A
e
+ D
s
(8)
The overlap with the background is calculated as the
size of the image, minus the size of the annotated area.
As in figure 2 the size of our image is 1. For the
IoU with background, we repeat all derivatives from
above. The most interesting two cases 2./4. result in
case ε
s
2. −
(I
¯a
¯
d
+I
¯ad
+I
a
¯
d
)−I
¯a
¯
d
(I
¯a
¯
d
+I
¯ad
+I
a
¯
d
)
2
< 0
4. −
(I
¯a
¯
d
+I
¯ad
+I
a
¯
d
)−I
¯a
¯
d
(I
¯a
¯
d
+I
¯ad
+I
a
¯
d
)
2
< 0
(9)
Combining this with the size-derivative for the
IoU in case 2. and 4., we obtain a the following requi-
rement for the weights w
o
and w
bg
= 1 − w
o
0 = w
o
(I
ad
+ I
¯ad
+ I
a
¯
d
) − I
ad
(I
ad
+ I
¯ad
+ I
a
¯
d
)
2
−
(1 − w
o
)
(I
¯a
¯
d
+ I
¯ad
+ I
a
¯
d
) − I
¯a
¯
d
(I
¯a
¯
d
+ I
¯ad
+ I
a
¯
d
)
2
(10)
Simplifying this expression with some algebraic
manipulation gives the weight for the annotation as:
w
o
=
(I
ad
+ I
a
¯
d
+ I
¯ad
)
2
(I
ad
+ I
a
¯
d
+ I
¯ad
)
2
+ (I
¯a
¯
d
+ I
¯ad
+ I
a
¯
d
)
2
(11)
This gives an unbiased overlap estimate for an
image of finite size according to (7) when using the
derived weights for foreground and background.
0.0 0.2 0.4 0.6 0.8 1.0
image area / object area
0
5000
10000
15000
20000
25000
30000
35000
40000
Object / image size ratio for tracking datasets
Figure 3: Histogram over ratio of image covered by the
image for common tracking datasets (OTB100 (Wu et al.,
2015), VOT 2015 (Kristan et al., 2015), VOT-TIR 2015
(Felsberg et al., 2015), VOT 2016 (Kristan et al., 2016))
. The vast majority of frames in all datasets have objects
covering less than a few percent of the image. In close to
100k frames from 4 different datasets, none contains an ob-
ject covering more than 50% of the image area.
4 EXPERIMENTAL EVALUATION
First we investigate the statistics of current tracking
datasets with respect to object size, and conclude that
the distribution of relative object sizes is significantly
skewed towards smaller objects.
Surprisingly current tracking benchmark datasets
(Wu et al., 2015), (Kristan et al., 2015), (Kristan et al.,
2016) contain almost no frames where the tracked ob-
ject covers a significant portion of the image, a histo-
gram over the ratio of image covered by the annotated
object can be seen in figure 3. Construing an entire
new dataset from scratch is out of the scope of this
work, instead we derive a new dataset by cropping
parts of the image around the object. This effectively
increases the relative size of the object in each video.
We experimentally validate our unbiased inter-
section over union score in two ways. First we ge-
nerate a large number of synthetic scenarios where
the tracker prediction has the correct center coordi-
nate, with varying size. We investigate by comparing
the performance of well known state of the art tracker
CCOT (Danelljan et al., 2016) with a naive method
that always outputs the entire image on a set of se-
quences with a wide range of object sizes.
In order to demonstrate the bias inherent in the tra-
ditional IoU, we compare the overlap given by it with
that of our new overlap score. From figure 4 it is appa-
rent that the penalty for an excessively large bounding
box decreases with increased size of the box, until the
size of the box itself is saturated at an IoU overlap of
0.6. For our unbiased overlap score the penalty for in-
creasing the size decreases far more rapidly, at a simi-
lar rate as to decreasing the size of the bounding box,
until it saturates at a lower point. The bounding box
VISAPP 2018 - International Conference on Computer Vision Theory and Applications
584
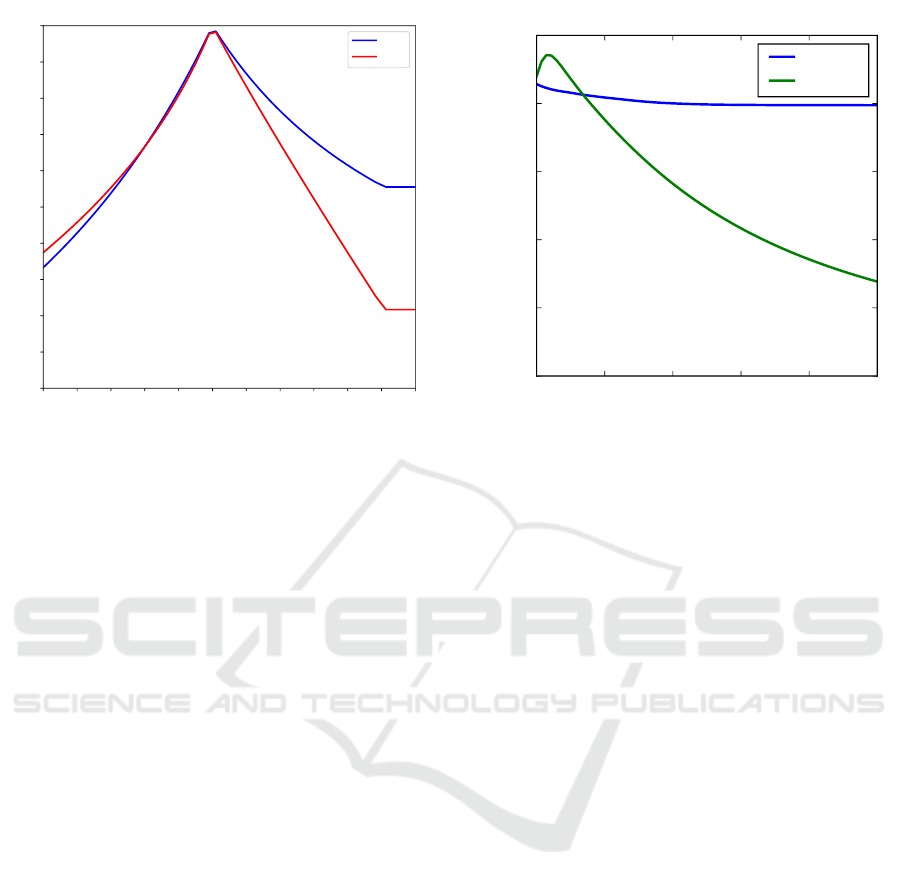
0.5 0.6 0.7 0.8 0.9 1.0 1.1 1.2 1.3 1.4 1.5 1.6
Scale Factor
0.0
0.1
0.2
0.3
0.4
0.5
0.6
0.7
0.8
0.9
1.0
Overlap
Effect of scale change with no offset
IoU
Our
Figure 4: Scale factor plotted against overlap for a correctly
centered bounding box. The right side of the curve clearly
shows that the IoU score (blue) is not symmetric. While
over-estimating the size of the object is penalized, it is not
as harsh as over-estimation. Our unbiased score (red), while
not perfectly symmetric is still significantly better, particu-
larly for larger objects.
size saturates as the edge hits the edge of the image
and is truncated. Truncating the bounding box is rea-
sonable since the size of the image is known, and no
annotations exist outside the image. For the IoU this
means that the lowest possible score is the ratio bet-
ween the object area and the total image area. For our
proposed overlap score the saturation point is much
lower as the minimal value is scaled by the size of the
object relative to the image.
In order to show the impact of the bias in IoU in
a more realistic situation we generate a number of se-
quences with varying object size. The sequences are
generated from the BlurCar1 sequence by cropping a
part of the image around the tracked object, effecti-
vely zooming in on the tracked object. We compare
the performance of the state-of-the art CCOT (Danel-
ljan et al., 2016), (the vot2016 winner (Kristan et al.,
2016)) with a naive baseline tracker. The naive ba-
seline tracker always outputs the full image as pre-
diction, except for the first row and column of pixels.
The average overlap for the Frame tracker and the
CCOT is shown in figure 5, the same plot but using
our unbiased score is shown in figure 6. An example
of a generated frame can be seen in figure 1.
While the CCOT obtains near-perfect results on
the sequence, it does not track every frame exactly
correct. For an object covering the entire frame, this
leads to an overlap slightly below 1. For a ratio be-
tween image and object close to 1 the naive method
1.0 1.2 1.4 1.6 1.8 2.0
Image / object ratio
0.0
0.2
0.4
0.6
0.8
1.0
Average overlap
CCOT vs naive (IoU score)
CCOT
Naive
Figure 5: Performance of the CCOT and the full frame trac-
ker with respect to relative object size using the standard
IoU score. For large objects covering most of the image, the
naive frame tracker outperforms the state-of-the-art CCOT.
Once the objects are approximately 80% of the image, the
CCOT approach begins to outperform the naive frame trac-
ker. However, the naive frame tracker still obtains a re-
spectable overlap until the object is smaller than 50% of
the image.
outperforms the CCOT, regardless of score used, as is
reasonable as the object covers the entire image. Ho-
wever it continues to outperform the CCOT until the
ratio is slightly below 1.2 when using the traditional
IoU score (figure 5). With an object covering 70% of
the image the IoU is still at 0.7, only 0.1 less than that
of the CCOT, despite not performing any tracking at
all. As the size of the object decreases so does the
IoU, however it remains quite good even for smaller
objects, when the object covers only half the image
by area the IoU is still 0.3 despite covering twice as
many pixels as the ground truth.
When performing the same experiment using our
proposed overlap score, the naive tracker is severely
penalized for over-estimating the object size. The cor-
responding plot to 5, can be seen in 6. Here the over-
lap score for the naive method is only higher than the
CCOT for those cases where the object is covering
practically the entire frame (image-to-object ratio less
than 1.05). In such situations even a minor mistake in
positioning is penalized more harshly. Once the ob-
ject becomes relatively smaller the CCOT tracker be-
gins to significantly outperform the naive method. Fi-
nally the penalty for the naive method is far more sig-
nificant, making the performance difference far more
obvious than when using the IoU metric.
In figure 7 we show some qualitative examples of
Countering Bias in Tracking Evaluations
585
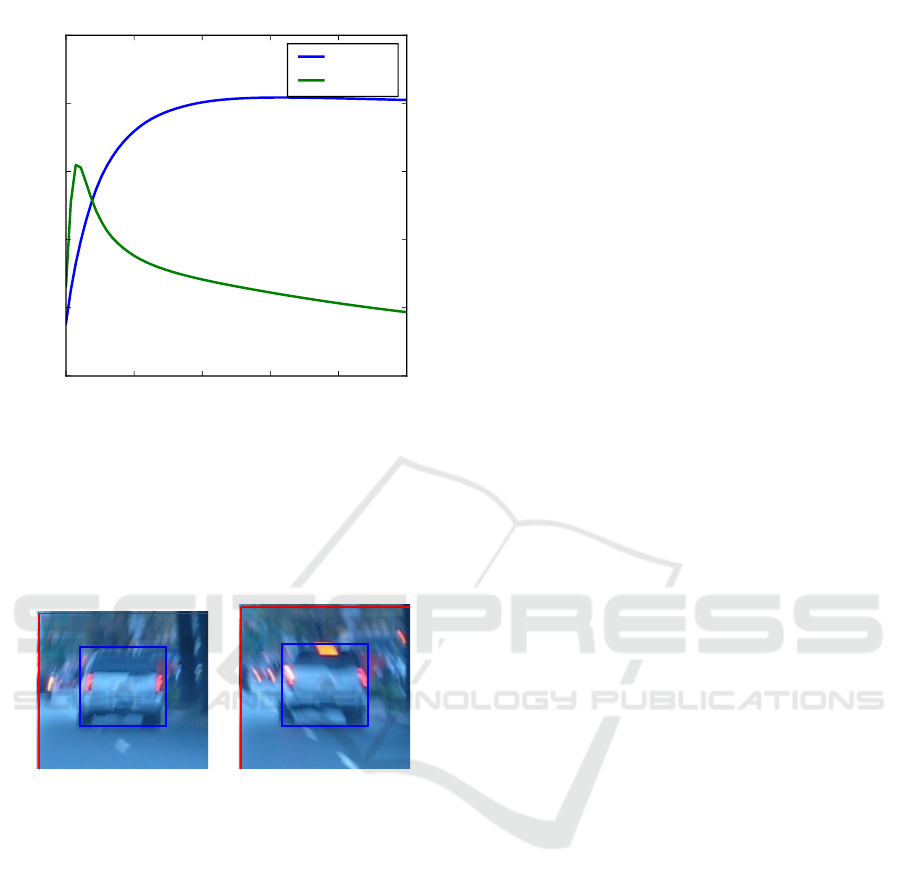
1.0 1.2 1.4 1.6 1.8 2.0
Image / Object ratio
0.0
0.2
0.4
0.6
0.8
1.0
Average overlap
CCOT vs naive (Our score)
CCOT
Naive
Figure 6: Performance of the CCOT and the full frame trac-
ker for relative object sizes using our proposed score. At
lower relative size (larger object), the naive frame tracker
outperforms the state-of-the-art CCOT approach as it is gua-
ranteed to cover the entire object, while the CCOT typically
has some offset error. At smaller object sizes, our proposed
score heavily penalizes the naive frame tracker.
Figure 7: Example frames from the CarBlur sequence, with
a naive method that outputs close to the entire image as each
detection (red box). The ground truth annotation is the blue
box. Due to severe motion blur and highly irregular mo-
vements in the sequence tracking is difficult. The traditi-
onal IoU score for this frame is 0.26 (left), while our new
unbiased metric provides a far lower score of 0.11 for both
the left and right images. This suggests that using the IoU
is not optimal in many cases.
frames from the cropped CarBlur sequence. As the vi-
deo is extremely unstable tracking is difficult, due to
motion blur and sudden movements. Here a predicted
bounding box generated by the naive tracker provides
a decent score of 0.22, despite always outputting the
entire frame. When instead using our unbiased score
the penalty for for over estimation of object size is
severe enough that the overlap score is more than hal-
ved. Here the IoU gives close to twice the overlap
score compared to our own approach.
5 CONCLUSIONS AND FURTHER
WORK
We have proven that the traditionally used IoU score
is biased with respect to over estimation of object si-
zes. We demonstrate this bias exists theoretically, and
derive a new unbiased overlap score. We note that
most tracking datasets are heavily biased in favor of
smaller objects, and construct a new dataset by crop-
ping parts of images at varying sizes. This demonstra-
tes a major issue with current tracking benchmarks as
situations with large objects directly correspond to si-
tuations when the tracked objects are close. We de-
monstrate the effect of using a biased metric in situa-
tions where the tracked object covers the majority of
the image, and compare to our new unbiased score.
Finally we have demonstrated the effect of introdu-
cing larger objects into tracking sequences by genera-
ting such a sequence, and comparing the performance
of a stationary tracker with that of a state of the art
method. While the CCOT significantly outperforms
the stationary tracker for smaller objects (as is ex-
pected), for larger objects the naive approach simply
outputting the entire image is quite successful. In the
future we aim to investigate the effect of this bias in
object detection scenarios. It would also be relevant
to construct a new tracking dataset where the tracked
objects size is more evenly distributed than what is
currently typical. Acknowledgements: This work was
supported by VR starting Grant (2016-05543), Veten-
skapsr
˚
adet through the framework grant EMC
2
, and
the Wallenberg Autonomous Systems and Software
program (WASP).
REFERENCES
Danelljan, M., Robinson, A., Khan, F. S., and Felsberg, M.
(2016). Beyond correlation filters: Learning continu-
ous convolution operators for visual tracking. In Euro-
pean Conference on Computer Vision, pages 472–488.
Springer.
Everingham, M., Van Gool, L., Williams, C. K., Winn, J.,
and Zisserman, A. (2008). The pascal visual object
classes challenge 2007 (voc 2007) results (2007).
Felsberg, M., Berg, A., Hager, G., Ahlberg, J., Kristan, M.,
Matas, J., Leonardis, A., Cehovin, L., Fernandez, G.,
Vojir, T., et al. (2015). The thermal infrared visual ob-
ject tracking vot-tir2015 challenge results. In Procee-
dings of the IEEE International Conference on Com-
puter Vision Workshops, pages 76–88.
Felsberg, M., Kristan, M., Matas, J., Leonardis, A., Pflug-
felder, R., Hager, G., Berg, A., Eldesokey, A., Ahl-
berg, J., ehovin, L., Vojr, T., Lukei, A., and Fernndez,
G. (2016). The thermal infrared visual object tracking
VISAPP 2018 - International Conference on Computer Vision Theory and Applications
586

vot-tir2016 challenge results. In Proceedings, Euro-
pean Conference on Computer Vision (ECCV) works-
hops, pages 824–849.
Jaccard, P. (1912). The distribution of the flora in the alpine
zone. New phytologist, 11(2):37–50.
Kristan, M., Leonardis, A., Matas, J., Felsberg, M., Pflug-
felder, R., ehovin, L., Vojr, T., Hager, G., Lukei, A.,
and Fernndez, G. (2016). The visual object tracking
vot2016 challenge results. In Proceedings, European
Conference on Computer Vision (ECCV) workshops.
Kristan, M., Matas, J., Leonardis, A., Felsberg, M., Ce-
hovin, L., Fern
´
andez, G., Vojir, T., Hager, G., Nebe-
hay, G., and Pflugfelder, R. (2015). The visual object
tracking vot2015 challenge results. In Proceedings of
the IEEE international conference on computer vision
workshops, pages 1–23.
Kristan, M., Pflugfelder, R., Leonardis, A., Matas, J., Ceho-
vin, L., Nebehay, G., Vojir, T., Fernandez, G., and Lu-
kezic, A. (2014). The visual object tracking vot2014
challenge results. In Proceedings, European Con-
ference on Computer Vision (ECCV) Visual Object
Tracking Challenge Workshop, Zurich, Switzerland.
Powers, D. M. W. (2011). Evaluation: from precision, re-
call and f-measure to roc, informedness, markedness
and correlation. International Journal of Machine Le-
arning Technology, 2(1):37–63.
Russakovsky, O., Deng, J., Su, H., Krause, J., Satheesh,
S., Ma, S., Huang, Z., Karpathy, A., Khosla, A.,
Bernstein, M., Berg, A. C., and Fei-Fei, L. (2015).
ImageNet Large Scale Visual Recognition Challenge.
International Journal of Computer Vision (IJCV),
115(3):211–252.
Wu, Y., Lim, J., and Yang, M.-H. (2013). Online object
tracking: A benchmark. In Proceedings of the IEEE
conference on computer vision and pattern recogni-
tion, pages 2411–2418.
Wu, Y., Lim, J., and Yang, M.-H. (2015). Object tracking
benchmark. PAMI.
Countering Bias in Tracking Evaluations
587
