
Evaluation of AW3D30 Elevation Accuracy in China
Fan Mo
1
, Junfeng Xie
1
and Yuxuan Liu
2
1
Satellite Surveying and Mapping Application Center, NASG, Beijing, China
2
School of Remote Sensing and Information Engineering, University of Wuhan, Wuhan, China
Keywords: Digital Surface Model, AW3D30, ALOS DSM, Elevation Accuracy Evaluation, National Control Point
Image Database.
Abstract: The AW3D30 dataset is a publically available, high-accuracy digital surface model; the model’s cited
nominal elevation accuracy is 5 m (1σ). In order to verify the accuracy of AW3D30, we selected China as
test area, and used field measurement points in the national control point image database as control data.
The elevation accuracy of the field measurement points in the national control point image database is better
than 1 m. The results show that the accuracy of the AW3D30 satisfies the requirement of 5 m nominal
accuracy, and elevation accuracy reached 2 m (1σ). Accuracy is related to both terrain and slope. Accuracy
is better in flat areas than in areas of complex terrain, and the eastern region of China is characterized by
better accuracy than the western region.
1 INTRODUCTION
The Advanced Land Observing Satellite (ALOS) is a
high-resolution three-line array stereo remote
sensing surveying satellite launched by Japan
Aerospace Exploration Agency (JAXA) on January
24, 2006. Its primary mission is to complete global
key area 1:25000 scale terrain mapping (Rosenqvist
et al., 2007; Shimada et al., 2010). The
Panchromatic Remote-sensing Instrument for Stereo
Mapping (PRISM) carried by ALOS has three 2.5-
meter resolution panchromatic cameras that are used
for front view, nadir view and rear view of earth
observation along the track direction, respectively.
Precise three-dimensional surface information can
be obtained through front intersection processing
(Takaku and Tadono, 2009; Rosenqvist et al., 2014).
On May 31, 2016, JAXA released the ALOS
Global Digital Surface Model “ALOS World 3D-30
m” (AW3D30). The model produced a global 30-
meter grid using ALOS stereoscopic images with
elevation nominal accuracy of 5 meters. The
AW3D30 currently possesses the highest accuracy
among global public digital elevation models. The
accuracy has been verified in many countries around
the world (Zhihua et al., 2017; Takaku et al., 2014;
Tadono et al., 2014).
In order to verify the accuracy of AW3D30
elevation data in China, we adopted the national
control point image database as an evaluation
benchmark. This image database is a core
component of the Environment and Disaster
Monitoring Engineering Based on Moonlet
Constellation. The database contains a total of about
350,000 generalized control points, including about
73,000 field measurement control points. The initial
aim of this database is to meet the need of matching
with satellite optical images. The overall accuracy of
the control point image database can meet plane and
elevation requirements of national 1:50,000 scale
mapping (Yu, 2012). The elevation accuracy of the
field measurement control points acquired by GPS-
RTK (Global Position System Real Time Kinematic)
included in the database is better than 1 m.
Therefore, by using the control point image database
as a control benchmark, we can precisely and
objectively evaluate the elevation accuracy of
AW3D30 data in China.
2 DATA DESCRIPTION
2.1 AW3D30
ALOS had been running on track for 5 years,
acquiring a large number of image data with global
coverage. AW3D30 data were generated from
approximately 3 million ALOS PRISM 2.5 m
180
Mo, F., Xie, J. and Liu, Y.
Evaluation of AW3D30 Elevation Accuracy in China.
DOI: 10.5220/0006674401800186
In Proceedings of the 4th International Conference on Geographical Information Systems Theory, Applications and Management (GISTAM 2018), pages 180-186
ISBN: 978-989-758-294-3
Copyright
c
2019 by SCITEPRESS – Science and Technology Publications, Lda. All rights reserved

resolution three-line array stereo imaging that, in
general, covered global land areas. Due to the
limitations of panchromatic camera imaging, there
are few images for global waters. Thus, the
AW3D30 data do not include information on ocean
elevations.
The original digital surface model (DSM) data
from AW3D30 are 5-meter grid digital images.
However, because of the amount of data generated
(and other reasons), JAXA only publicly released
the 30 meter grid AW3D30 data. The released
AW3D30 data contain two versions related to
differences in the 5 to 30 meter down-sample
processing: AVE and MED. AVE uses a mean filter
to down-sample the raw data, whereas MED uses a
median filter.
According to JAXA's release plan, AW3D30 data
are divided into three versions. Currently released
AW3D30 data belong to the version 1.1; the main
date parameters associated with this version are
shown in Table 1 (Takaku et al., 2016; Tadono et al.,
2016).
Table 1: Listing of the primary parameters of the
AW3D30.
Parameter l Value
Image file
16-bit integer, gray value
represents elevation, the unit is
meter
Each view coverage
area
1° × 1°
Resolution 1" × 1"
Vertical accuracy 5 m (RMSE)
Coordinate system
Latitude and longitude (ITRF97
[GRS80])
Elevation type Normal
Since the elevation type of AW3D30 data are
normal height, it is necessary to introduce an geoid
height when performing an elevation accuracy
evaluation. In order to control the data on the same
elevation reference, we used the EGM2008 model to
calculate the geoid height of corresponding points
(Pavlis et al., 2013; Hirt et al., 2011).
2.2 Control Point Image Database
China covers a vast area characterized by large
climatic difference between the North and the South.
Due to its size, disasters are difficult to monitor in
real time, resulting in a greater threat to public’s
safety and economic security. For this reason, the
Ministry of Civil Affairs National Disaster
Reduction Center started the national control point
image database construction project in 2010. The
project took the China Institute of Surveying and
Mapping two years to complete. The control point
image database covers a total of 31 provinces
(Taiwan, Hong Kong and Macau are not covered).
The control point image database contains about
350,000 generalized control points, most of which
are pass points, as well as some field measurement
points and measurement points obtained from large-
scale aeronautical digital orthography model
(DOM). The accuracy of the pass points and the
large-scale aeronautical DOM image internal
collection points is lower than that of field
acquisition measurement points. Therefore, only the
field acquisition measurement points in the control
point image database were selected as experimental
control data. During the process of evaluating
elevation accuracy of the DSM, there is no need to
measure an image point; hence, there is no
measurement error in this process. The accuracy of
the selected elevation control data is better than 1 m
(Yu, 2012).
3 RESEARCH METHOD
3.1 Nationwide Comprehensive
Evaluation
At present, AW3D30 data cover all global lands,
including the entire territory of China. In order to
macroscopically verify the overall accuracy of the
AW3D30 elevation data in China, we selected all the
field measurement points in the national control
point image database to evaluate the elevation
accuracy of AW3D30 data in the coverage area.
Then, we individually calculated each province as an
independent sample to examine trends in the
accuracy of the nationwide AW3D30 data based on
a provincial division.
3.2 Typical Terrain Evaluation
China is vast, extending from a longitude of E73°33'
to E135°05' and latitude of N3°51' to N53°33'. In
general, China's terrain is elevated in the west and
low in the east, and exhibits a ladder-like
distribution. The mainland of China is
topographically complex, and can be subdivided into
five basic types of terrain: plateaus, mountains,
plains, hills and basins. The basic terrain types in
mainland China are shown in Table 2.
Evaluation of AW3D30 Elevation Accuracy in China
181

Given the imaging mechanism of ALOS PRISM
sensors, different terrain may exhibit different
mapping accuracy. Therefore, in order to validate
the elevation accuracy of AW3D30 data under
different terrain conditions, we selected typical areas
within the five terrain types for accuracy analysis,
and quantitatively evaluated the elevation accuracy
of AW3D30 data within each type of terrain.
Table 2: Basic types of terrain (landscapes) in China.
Terrain Elevation variations Typical areas
Plateau
Elevation >1000
meters, with gentle
hills
Qinghai-Tibet Plateau,
Inner Mongolia Plateau,
Loess Plateau, Yunnan-
Guizhou Plateau and
Pamirs
Mountain
Elevation >500
meters, with large
topographic variations
Great Himalayas,
Hengduan Mountains,
Nanling, Qinling and
Taihang Mountains
Plain
Elevation of <200
meters, relatively flat
terrain
Northeast plain, North
China Plain, middle and
lower of Yangtze River,
and Ganges River Plain
Hill
Relative height <200
meters, with gentle
variation in
topography
Jiangnan hills and
Shandong hills
Basin
Depression
characterized by low
areas in the middle,
high areas on both
sides
Tarim Basin, Junggar
Basin, Qaidam Basin,
Sichuan Basin and
Turpan Basin
3.3 Evaluation based on Terrain Slope
The base-height ratio of a space-borne optics stereo
camera is generally small compared with aerial
photogrammetry. As a result, on-orbit imaging is
greatly affected by the terrain. In areas with large
topographic variations, the accuracy of stereoscopic
plotting is often poor; therefore, accuracy of the
AW3D30 in topographically complex areas needs to
be examined under different slope conditions
(Hodgson, 2005). The slope of the terrain was
calculated using the following expression (Zhihua et
al., 2017):
()
()( )
2
21
22
21 21
arctan
zz
S
xx yy
−
=
−+−
(1)
where
()
111
,,
x
yz
and
()
222
,,
x
yz
indicate the
two-point three-dimensional coordinate values along
the slope to be calculated.
3.4 Evaluation Method
We selected the field measurement control points in
the national control point image database as control
data for the accuracy evaluation. We directly used
coordinates information
()
,,XYZ
in the database as
an evaluation benchmark, rather than the control
point image. Specifically, values of
()
,XY
were
substituted into the AW3D30 data. These data can
be interpolated to get corresponding elevation
information.
Bilinear interpolation method
is applied
(Qinghua et al., 2010; Arun, 2013). As shown in
figure 1, the point
()
,
Z
XY
′
can be calculated from
four vertex values of its grid
,ij
P
,
1,ij
P
+
,
,1ij
P
+
and
1, 1ij
P
++
. The formula used in the calculation was:
()( )( )
() ()
,
1, , 1 1, 1
,1 1
11
ij
ij ij ij
ZXY x yP
xyP xyP xyP
++++
′
=−Δ −Δ +
Δ−Δ +−ΔΔ +ΔΔ
(2)
where
x
Δ
and
yΔ
are the coordinate increments of
point relative to point when the grid side
length is 1.
x
Δ
y
Δ
1i −
i
1i +
2i +
2
j
+
1
j
+
j
1
j
−
()
,
Z
XY
′
Figure 1: Diagram illustrating how bilinear interpolation
was defined.
By using this interpolation method, we were able
to obtain the elevation information that
corresponds to the point. Invalid points were
identified by the mask image among the AW3D30
auxiliary data, and gross errors in elevation
differences (where a point with an absolute
difference value between and greater than 100
m is defined as a gross error) were eliminated.
Finally, we analyzed the accuracy of the AW3D30
in different confidence intervals. The elevation
accuracy parameters mainly include the mean value,
absolute mean value, standard deviation and root
mean square error of the difference between and
(Athmania and Achour, 2014). The specific
formulas are as follows:
A
,ij
P
'
Z
'
Z
Z
'
Z
Z
GISTAM 2018 - 4th International Conference on Geographical Information Systems Theory, Applications and Management
182
The mean of the difference:
()
'
ii
mean
ZZ
V
n
−
=
(3)
Absolute mean value of the difference:
'
ii
abs
ZZ
V
n
−
=
(4)
Standard deviation:
()
2
'
iimean
std
ZZV
V
n
−−
=
(5)
Root mean square error:
()
2
'
ii
RMSE
ZZ
V
n
−
=
(6)
4 EXPERIMENT AND ANALYSIS
All field acquisition measurement points in the
control point image database were selected for
analysis, resulting in a total of about 73,000 points.
They were even distributed in China. These points
were substituted into the AW3D30 for obtaining
elevation information. The pixel value obtained was
the elevation value of the point. The difference
between the elevation value obtained and value of
the corresponding control point was then calculated
to analyze the elevation accuracy. Moreover,
differences between the histograms constructed for
the AVE and MED data are sustainable. A histogram
of elevation differences about AVE is shown in
Figure 2.
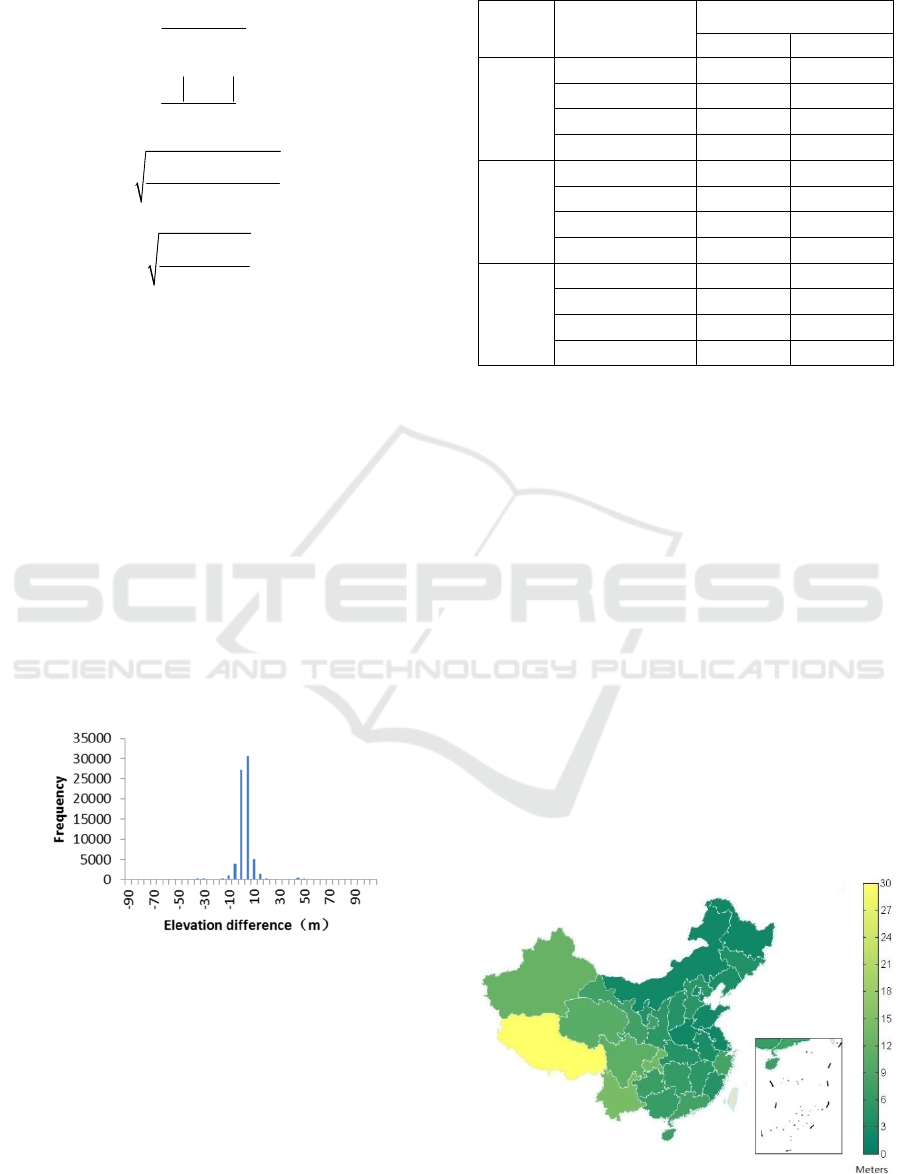
Figure 2: Histograms of elevation difference.
Elevation difference calculated as the elevation of
the control point minus the corresponding elevation
contained in the AW3D30 dataset. Figure 2 shows
that the elevation differences are normally
distributed, and mainly concentrated around 0.
Using all of the control points as benchmarks, we
calculated the mean, absolute mean value, standard
deviation and root mean square error of correspond-
ing AW3D30. The overall accuracy determined for
the entire country is shown in Table 3.
Table 3: Nationwide elevation accuracy in China.
Criteria Parameter
Value
AVE (m) MED (m)
1σ
Mean 0.2 0.13
Absolute mean 1.47 1.46
Standard deviation 1.73 1.73
RMSE 1.74 1.73
2σ
Mean 0.36 0.33
Absolute mean 3.11 4.57
Standard deviation 4.44 4.41
RMSE 4.46 4.42
3σ
Mean 0.79 0.75
Absolute mean 4.6 4.57
Standard deviation 9.11 9.09
RMSE 9.15 9.15
Accuracy of AW3D30 data in China fall within an
elevation accuracy of 5 m (1σ), locally reaching 2 m
(1σ). With regards to the 2σ confidence interval, the
elevation accuracy reaches 5 m; in the 3σ confidence
interval, elevation accuracy reaches 10 m. As
presented in Table 3, accuracy of the AVE and MED
data is similar.
In order to evaluate whether the accuracy of the
AW3D30 are related to the terrain, province was
selected as a unit of study. The root mean square
error of MED and control point data for each
province, along with trends obtained on the overall
accuracy are shown in figure 3 In general, accuracy
of the AW3D30 elevation date in the eastern region
is better than that in the western region, while
accuracy in the northern region is slightly better than
that in the southern region. Areas of high elevation
accuracy are mainly concentrated in two regions:
Inner Mongolia-northeast China and north China.
Tibet has the lowest accuracy in elevation, followed
by the regions of Yunnan-Sichuan-Qinghai-Xinjiang.
Figure 3: Geographical patterns in accuracy of AW3D30
data.
Evaluation of AW3D30 Elevation Accuracy in China
183
In order to understand the impact of different
terrain types on the accuracy of the AW3D30 data,
we analyzed the accuracy associated with each of
the five delineated terrains in China (Table 2). Large
sections representative of the typical terrain were
used as experimental areas. We selected two
experimental areas in every typical terrain, and these
areas are different in landform. The field measure-
ment points in the control point image database from
these areas were used to calculate elevation accuracy
parameters between the control point and AW3D30.
Points with gross errors were removed. The obtained
elevation accuracy within the 3σ confidence interval
was then determined (Table 4
)
.
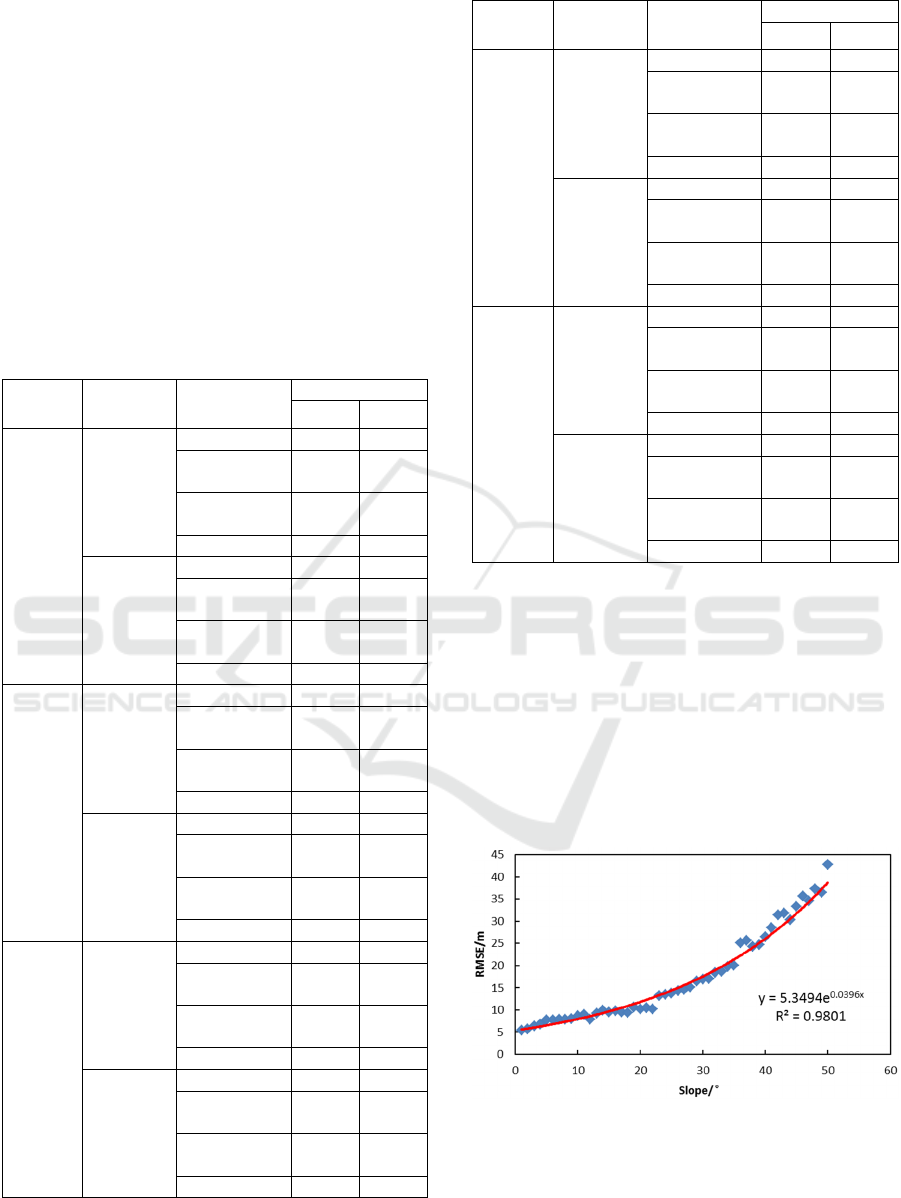
Table 4: Accuracy in AW3D30 stratified by terrain type.
Terrain Name Parameter
Value (m)
AVE MED
Plateau
Qinghai-
Tibet
Plateau
Mean −11.93 −11.89
Absolute mean
value
20.14 20.08
Standard
deviation
22.96 22.87
RMSE 25.87 25.77
Inner
Mongolia
Plateau
Mean −3.04 −3.08
Absolute mean
value
3.28 3.32
Standard
deviation
2.44 2.43
RMSE 3.9 3.94
Mountain
Hengduan
Mountains
Mean −3.4 −3.4
Absolute mean
value
10.08 10.04
Standard
deviation
17.24 17.25
RMSE 17.58 17.58
Taihang
Mountains
Mean −2.57 −2.6
Absolute mean
value
6.26 6.26
Standard
deviation
11.54 11.54
RMSE 11.82 11.82
Plain
Northeast
Plain
Mean 0 −0.03
Absolute mean
value
1.84 1.84
Standard
deviation
2.54 2.53
RMSE 2.55 2.53
North China
Plain
Mean 1.86 1.82
Absolute mean
value
2.46 2.41
Standard
deviation
2.45 2.42
RMSE 3.07 3.03
Terrain Name Parameter
Value (m)
AVE MED
Hills
Jiangnan
Hills
Mean 0.1 −0.03
Absolute mean
value
3.48 3.33
Standard
deviation
4.63 4.72
RMSE 4.64 4.72
Shandong
Hills
Mean −2.91 −2.92
Absolute mean
value
3.26 3.26
Standard
deviation
2.98 3.02
RMSE 4.17 4.21
Basin
Junggar
Basin
Mean −3.67 −3.69
Absolute mean
value
3.68 3.68
Standard
deviation
3.44 3.45
RMSE 4.4 4.42
Qaidam
Basin
Mean 3.54 3.57
Absolute mean
value
3.8 3.79
Standard
deviation
4.42 4.41
RMSE 4.56 4.56
Table 4 shows that the AW3D30 data coverage
in the plateaus and mountains are significantly worse
than in areas of plains, hills and basins (of which the
Inner Mongolia Plateau is highly precise, primarily
because the landscape consists of plateaus and the
terrain is flat). Elevation accuracy of the AW3D30
covering plateaus is not as good as for the mountains.
The plains have the best elevation accuracy,
followed by hills and basins. The accuracy of MED
is slightly better than that of AVE, especially in the
case of flat terrain.
Figure 4: Variation in root mean square error versus slope.
Figure 4 suggests that accuracy is a function of
slope, the elevation accuracy of AW3D30 is
different in different terrain slopes. In order to
analyze the specific impact, AVE AW3D30 data
GISTAM 2018 - 4th International Conference on Geographical Information Systems Theory, Applications and Management
184

were examined as an example by sorting the national
control points into different slope categories. The
slope was calculated by four values in AW3D30
around the control point in the database; specifically,
two points before and after the control point in the x
direction and two points before and after the control
point in the y direction. The sorting slope interval is
1°. We then calculated the corresponding root mean
square error in each slope category, plotted the root
mean square error value of the elevation according
to slope variation, and used the exponential curve for
fitting. Figure 4 shows that there is a strong
statistically significant (R
2
= 0.9801) positive
correlation between the elevation root mean square
error and the slope in the AW3D30.
5 CONCLUSIONS
Approximately 73,000 highly precise field
measurement points contained in the control point
image database were used as elevation reference
data. Accuracy of AW3D30 were analyzed at two
different spatial scales, all of which showed that
AW3D30 satisfies the nominal accuracy of 5 m (1σ)
elevation. In general, the elevation accuracy of
AW3D30 in China can reach 2 m (1σ), while most
of AW3D30 exhibit an accuracy of better than 10 m
(3σ). Moreover, an analysis of plateaus, mountains
and other areas characterized by large topographic
variations exhibited relatively poor accuracy. The
accuracy of AW3D30 data for hills, basins, plains
and other area with subdued topographic variations
was better. The results of the provincial analysis
show that the accuracy of the AW3D30 data
gradually declines from the eastern region to the
western region. Similarly, accuracy gradually
decreases from the northern region to the southern
region. The accuracy of AW3D30 also has a strong
correlation to slope. The results obtained in this
analysis demonstrate that the accuracy of AW3D30
in China can be effectively used in subsequent
scientific studies or engineering practices.
ACKNOWLEDGEMENTS
This work was supported by the Natural Science
Foundation of China (No. 41301525, No. 41571440
and No. 41771360), the High Resolution Remote
Sensing, surveying and mapping Application
Demonstration System Research Program (Issue No.
1), the NASG Young Academic Leaders Foundation
(No. 201607), National key research and
development program (No. 2017YFB0504201), and
the Authenticity Validation Technology of Elevation
Measurement Accuracy of GF-7 Laser Altimeter
(No. 42-Y20A11-9001-17/18).
REFERENCES
Arun, P., 2013. A comparative analysis of different DEM
interpolation methods. The Egyptian Journal of
Remote Sensing and Space Sciences, 16: 133-139.
Athmania, D., Achour, H., 2014. External Validation of
the ASTER GDEM2, GMTED2010 and CGIAR-CSI-
SRTM v4.1 Free Access Digital Elevation Models
(DEMs) in Tunisia and Algeria. Remote Sensing, 6:
4600-4620.
Hirt, C., Gruber, T., Featherstone, W., 2011. Evaluation of
the first GOCE static gravity field models using
terrestrial gravity, vertical deflections and EGM2008
quasigeoid heights. Journal of Geodesy, 85: 723-740.
Hodgson, M., 2005. An Evaluation of Lidar-derived
Elevation and Terrain Slope in Leaf-off Conditions.
Photogrammetric Engineering and Remote Sensing,
71: 817-824.
Pavlis, N., Holmes, S., Kenyon, S., et al., 2013. Correction
to ‘The Development and Evaluation of the Earth
Gravitational Model 2008 (EGM2008)’. Journal of
Geophysical Research, 118: 2633-2633.
Qinghua, G., Wenkai, L., Hong, Y., et al., 2010. Effects of
Topographic Variability and Lidar Sampling Density
on Several DEM Interpolation Methods.
Photogrammetric Engineering and Remote Sensing,
76: 701-712.
Rosenqvist, A., Shimada, M., Suzuki, S., et al., 2014.
Operational performance of the ALOS global
systematic acquisition strategy and observation plans
for ALOS-2 PALSAR-2. Remote Sensing of
Environment, 155: 3-12.
Rosenqvist, A., Shimada, M., Ito, N., et al., 2007. ALOS
PALSAR: A Pathfinder Mission for Global-scale
Monitoring of the Environment, IEEE Transactions on
Geoscience and Remote Sensing, 45: 3307-3316.
Shimada, M., Tadono, T., Rosenqvist, A., 2010. Advanced
Land Observing Satellite (ALOS) and Monitoring
Global Environmental Change. Proceedings of the
IEEE, 98: 780-799.
Tadono, T., Ishida, H., Oda, F., et al., 2014. Precise Global
DEM Generation by ALOS PRISM. ISPRS Annals of
the Photogrammetry. Remote Sensing Spatial
Information Science, II-4: 71-76.
Tadono, T., Nagai, H., Ishida, H., Iwamoto, H., et al.,
2016. Initial Validation of the 30 m-mesh Global
Digital Surface Model Generated by ALOS PRISM.
The International Archives of the Photogrammetry,
Remote Sensing and Spatial Information Sciences,
ISPRS, XLI-B4: 157-162.
Evaluation of AW3D30 Elevation Accuracy in China
185

Takaku J., Tadono, T., 2009. PRISM On-Orbit Geometric
Calibration and DSM Performance. IEEE Transcation
on Geoscience and Remote Sensing, 47: 4060-4073.
Takaku, J., Tadono, T., Tsutsui, K., 2014. Generation of
High Resolution Global DSM from ALOS PRISM. In
Proceedings of the International Archives of the
Photogrammetry, Remote Sensing and Spatial
Information Sciences. ISPRS TC IV Symposium, XL-4:
243–248.
Takaku, J., Tadono, T., Tsutsui, K., et al., 2016.
Validation of ‘AW3D’ Global DSM Generated from
ALOS PRISM. The International Archives of the
Photogrammetry, Remote Sensing and Spatial
Information Sciences, III-4: 25-31.
Yu, W., 2012. Geometry Processing Service Based on
Ground Control Point Image Database. Master’s
thesis, Shandong University of Science and
technology, Tsingtao.
Zhihua, H., Jianwei, P., Yaolin, H., 2017. Evaluation of
Recently Released Open Global Digital Elevation
Models of Hubei, China. Remote Sensing, 9: 262.
GISTAM 2018 - 4th International Conference on Geographical Information Systems Theory, Applications and Management
186
