
The Feasibility of using V2G to Face the Peak Demand in Warm
Countries
Ibrahem A. Almansour, Enrico H. Gerding and Gary Wills
Electronics and Computer Science, University of Southampton, U.K.
Keywords:
V2G, Peak Demand.
Abstract:
As a result of the very difficult weather in Saudi Arabia during the summer, there is too high power peak
demand in the grid and this is expected to increase in the next decade. To fix this problem, power consumers
should participate in the power production. Vehicle-to-grid (V2G), one of the efficient sustainable technolo-
gies, can offer this opportunity. It is defined as a concept where electric vehicle (EV) provides electric to the
grid when parked. This investigation looks at the feasibility of using V2G to mitigate the problem of highest
electricity peak demand in the summer period in one of the warmest countries of the world (Saudi Arabia). We
conduct a survey in order to serve this issue and we use information from Saudi Arabia electricity authority.
We found that, V2G is a promising solution to the peak demand challenge in the summer in Saudi Arabia since
there is about 80% of the sample interested in using V2G technology. Moreover, 90% of the participants used
their vehicles less than 4 hours daily. Furthermore, in the summer period, most of the participants park their
vehicles for the longest time between 13:00 to 18:00, which is the peak demand period.
1 INTRODUCTION
The massive increasing in the electricity peak de-
mand at the summer period is one of the most im-
portant issues should be considered by the electricity
companies around the world, specifically in the war-
mest countries. Electricity & Cogeneration Regula-
tory Authority (ECRA) state that the electricity peak
demand is too high in the summer in Saudi Arabia and
they expect that to increased massively in the next de-
cade (ECRA, 2011). One of the most promising solu-
tions that can be used to support the grid to face this
problem is Vehicle-to-grid (V2G) technology. It is
defined as a method whereby electric vehicles (EVs)
provide electricity power to the smart grid when not
being used. The majority of the vehicles are used just
10% of the time, so they can be used to offer the po-
wer electricity to the grid during this time when they
parked (Kempton and Tomi
´
c, 2005). Specially, if the
EV drivers know about that, they might gain money
because of the contributing in V2G systems, about
2500 3000 $ annually (Tomas, 2013).
As ECRA report, the daily load consumption
curve is increased massively through the summer pe-
riods in Saudi Arabia. Thus, one of the suggested so-
lutions which has been provided by ECRA is that a
cost of energy in the summer seasons should be dou-
bled that cost in winter seasons. Thus, it can be con-
cluded that, the peak demand in Saudi Arabia is very
high in the summer period and this issue is a diffi-
cult challenge for the Saudi Electricity Company that
should be considered. On the other hand, as we men-
tioned in the V2G definition, there is a chance to sup-
port the power grid by the EV when it parked so we
inspired by this idea and we conducted a survey that
investigate the feasibility of applying V2G in Saudi
Arabia in order to support the grid to face the very
high peak demand in the summer period. This matter
is becoming more important if we know that, ECRA
predicts that to increase significantly in the next de-
cade. The rest of the paper is organised as follows.
The related work will be discussed in Section 2. Next,
the research methodology will be described in Section
3. Then, Section 4 provides the Results and Discus-
sion. Finally, the findings and conclusion of our study
will be discussed in section 5.
2 RELATED WORK
Before we discuss the results of our survey, we have
to clarify that we choose to use vehicle usage behavior
instead of drivers behavior since the drivers behavior
238
A. Almansour, I., H. Gerding, E. and Wills, G.
The Feasibility of using V2G to Face the Peak Demand in Warm Countries.
DOI: 10.5220/0006661502380242
In Proceedings of the 4th International Conference on Vehicle Technology and Intelligent Transport Systems (VEHITS 2018), pages 238-242
ISBN: 978-989-758-293-6
Copyright
c
2019 by SCITEPRESS – Science and Technology Publications, Lda. All rights reserved
frequently use to define the drivers emotional which
is not discussed in our study.
Additionally, nowadays, the EVs on the street are
very rare. Therefore, it is difficult to collect the real
EV vehicle usage behavior consequently we assume
the V2G drivers behave like any other vehicle drivers
and this assumption has been used broadly in the stu-
dies that review EV drivers such as (Wu et al., 2010).
Moreover, our study is consistent with (Matar
et al., 2015) study which is aiming to reduce the fuel
consumption cost in Saudi Arabia without increasing
at the end customers costs side. In more details, their
work discusses the problem from the service provi-
ders sides but it has not considered how the sustaina-
ble technologies such as V2G could help in this issue.
Indeed, our work could be used as one of the robust
evidences for the efficiency of applying new policies
that encourage the consumers in Saudi Arabia to use
sustainable technologies and specifically V2G in or-
der to face the predicting massively increasing in the
power demand and without effect the power economy.
There are many researches in the literature that re-
view the travel behavior matter. For instance, there is
a published dataset of the National Household Travel
Survey (NHTS, 2016), Danish National Travel Sur-
vey (Christiansen and Skougaard, 2015), the Traffic
Choices Study dataset collected by the Puget Sound
Regional (Council, 2011), and the University of Win-
nipeg data (Danny Blair, 2011).
To the best of our knowledge, none of the abo-
vementioned datasets are appropriate for our study
goal since none of them are considered the feasibi-
lity of applying V2G in a warm country, specially, in
the summer season when the electricity peak demands
being very high and the drivers parked their vehicles
for long period because of this difficult weather.
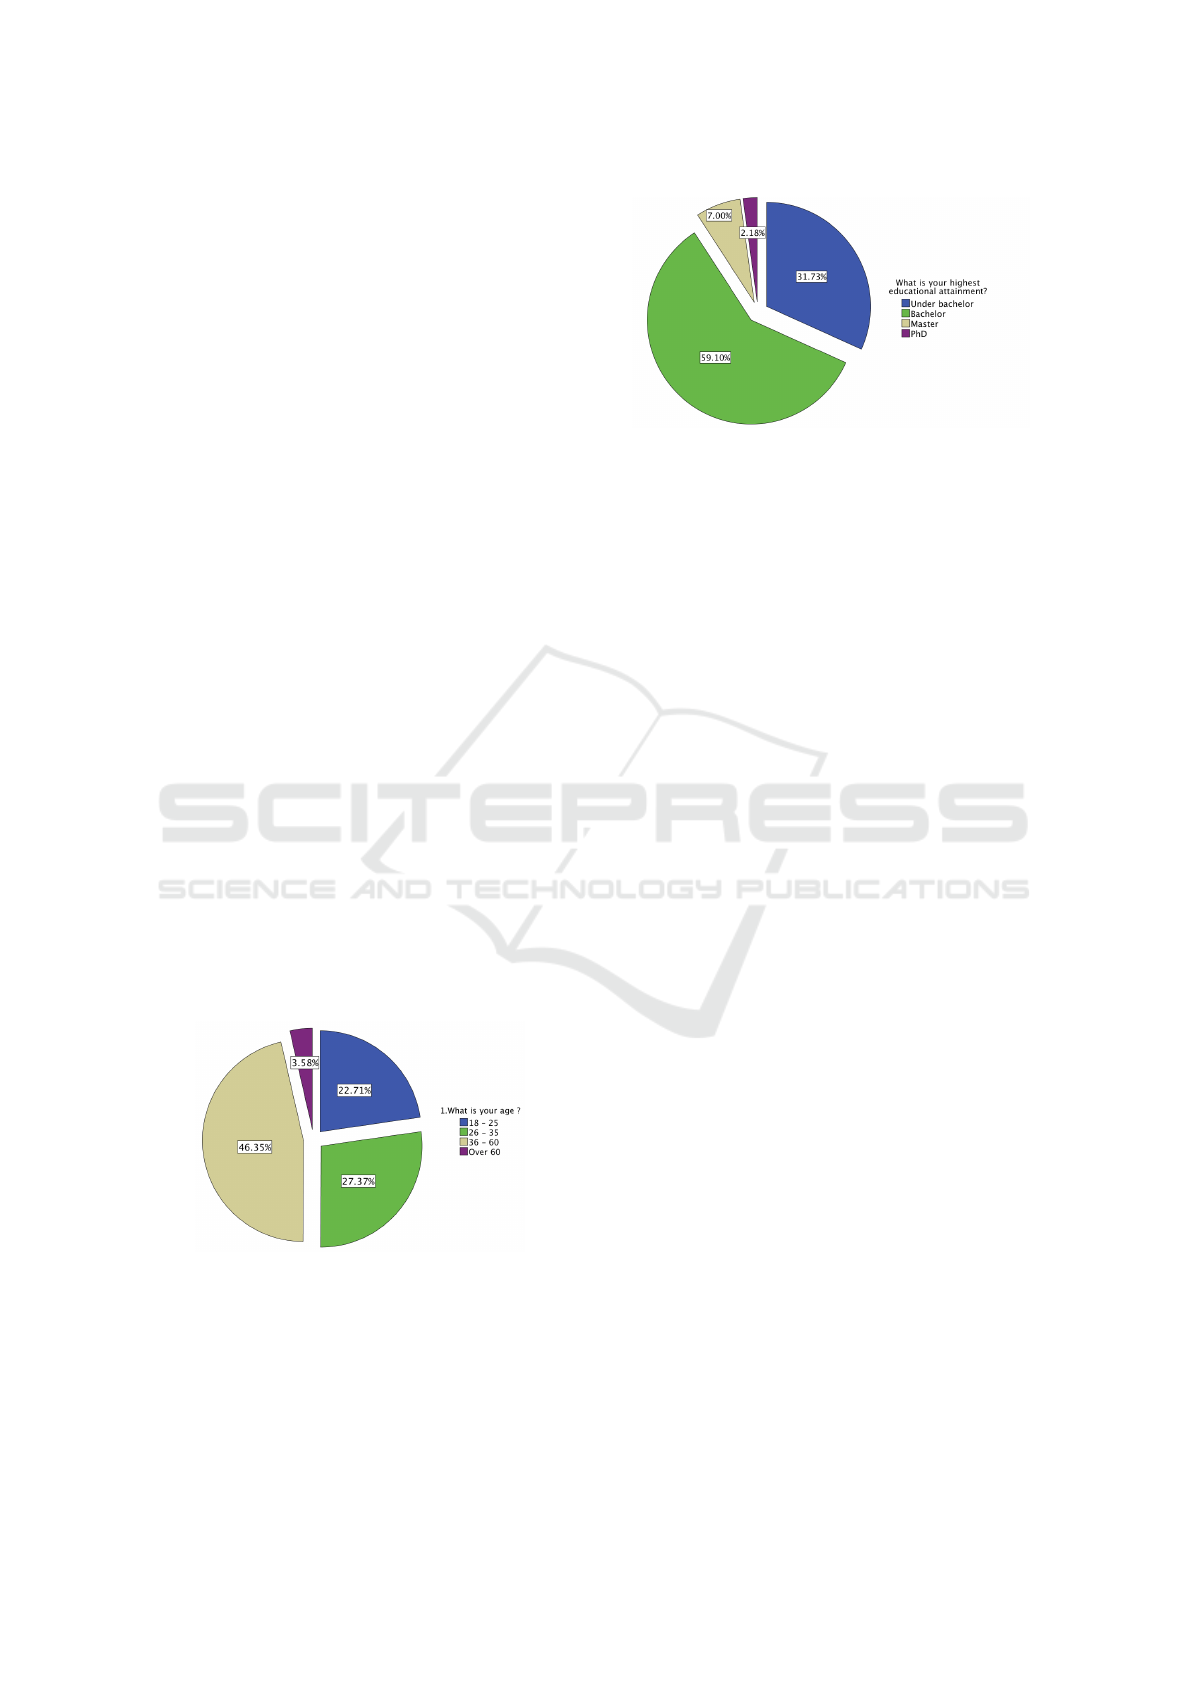
Figure 1: The participants’ age.
3 RESEARCH METHODOLOGY
This section describes the survey that has been used
in this study. After that, the study limitations are dis-
cussed.
Figure 2: The participants’ highest educational attainment.
3.1 Study Overview
We divide the survey into two sections. Firstly, we
ask the participants about their demographic informa-
tion. Afterward, we ask the participants about their
cars battery usage preferences (fuel in the conventio-
nal cars) but we are not going to discuss this part here
because it is out of this paper scope. However, this
part will be the core of our future work. Finally, we
examine the feasibility of applying V2G in Saudi Ara-
bia. In this study, online-based survey is used. Partici-
pants are invited through social networks, and e-mails
and are offered with a web link to the survey. Any in-
dividual has a Saudi driver license considered a proper
participant in this study. About 699 participants ans-
wered this survey. Further, the participants are chosen
randomly.
3.2 Study Limitations
This study is investigating the feasibility of applying
V2G to support the smart grid in the peak time in the
warm countries. It has some strengths points, howe-
ver, it has some weaknesses.
The first weakness point is that, the participants
are only the men and this since we consider the pe-
ople they have a driver license in Saudi Arabia and
till now only the men can drive officially in the Saudi
Arabia. Furthermore, we cannot capture the entire po-
pulation since this survey is an online survey therefore
we may miss some kinds of individuals such as the el-
derly men who have not used the Internet.
4 RESULTS AND DISCUSSION
Now, we are going to discuss the results in this
section. Firstly, Figure 1 illustrates, the majority of
the drivers who participate in this study are between
36 - 60 years old, 46.35%. On the other hand, the
minority is over 60 years old, 3.58% and this sensible
The Feasibility of using V2G to Face the Peak Demand in Warm Countries
239
since the individuals over 60 are less than the others in
term of using the social network where we distribute
our study.
Moreover, in the highest educational attainment
for the participants we found that, as the Figurer 2
shows the highest number of the participants is the in-
dividuals got the Bachelor degree. Afterward, the stu-
dents who are under bachelor. Next, with the signifi-
cant different of number, the individuals who got the
Master degree, and the minority are the participants
got the PhD. Actually, we believe this is a reasonable
distribution for educational attainment for the sample
in a normal social. Furthermore, about the half of par-
ticipants work in the public sector, and 20.37% work
in the private sector, and the rest of them do not work.
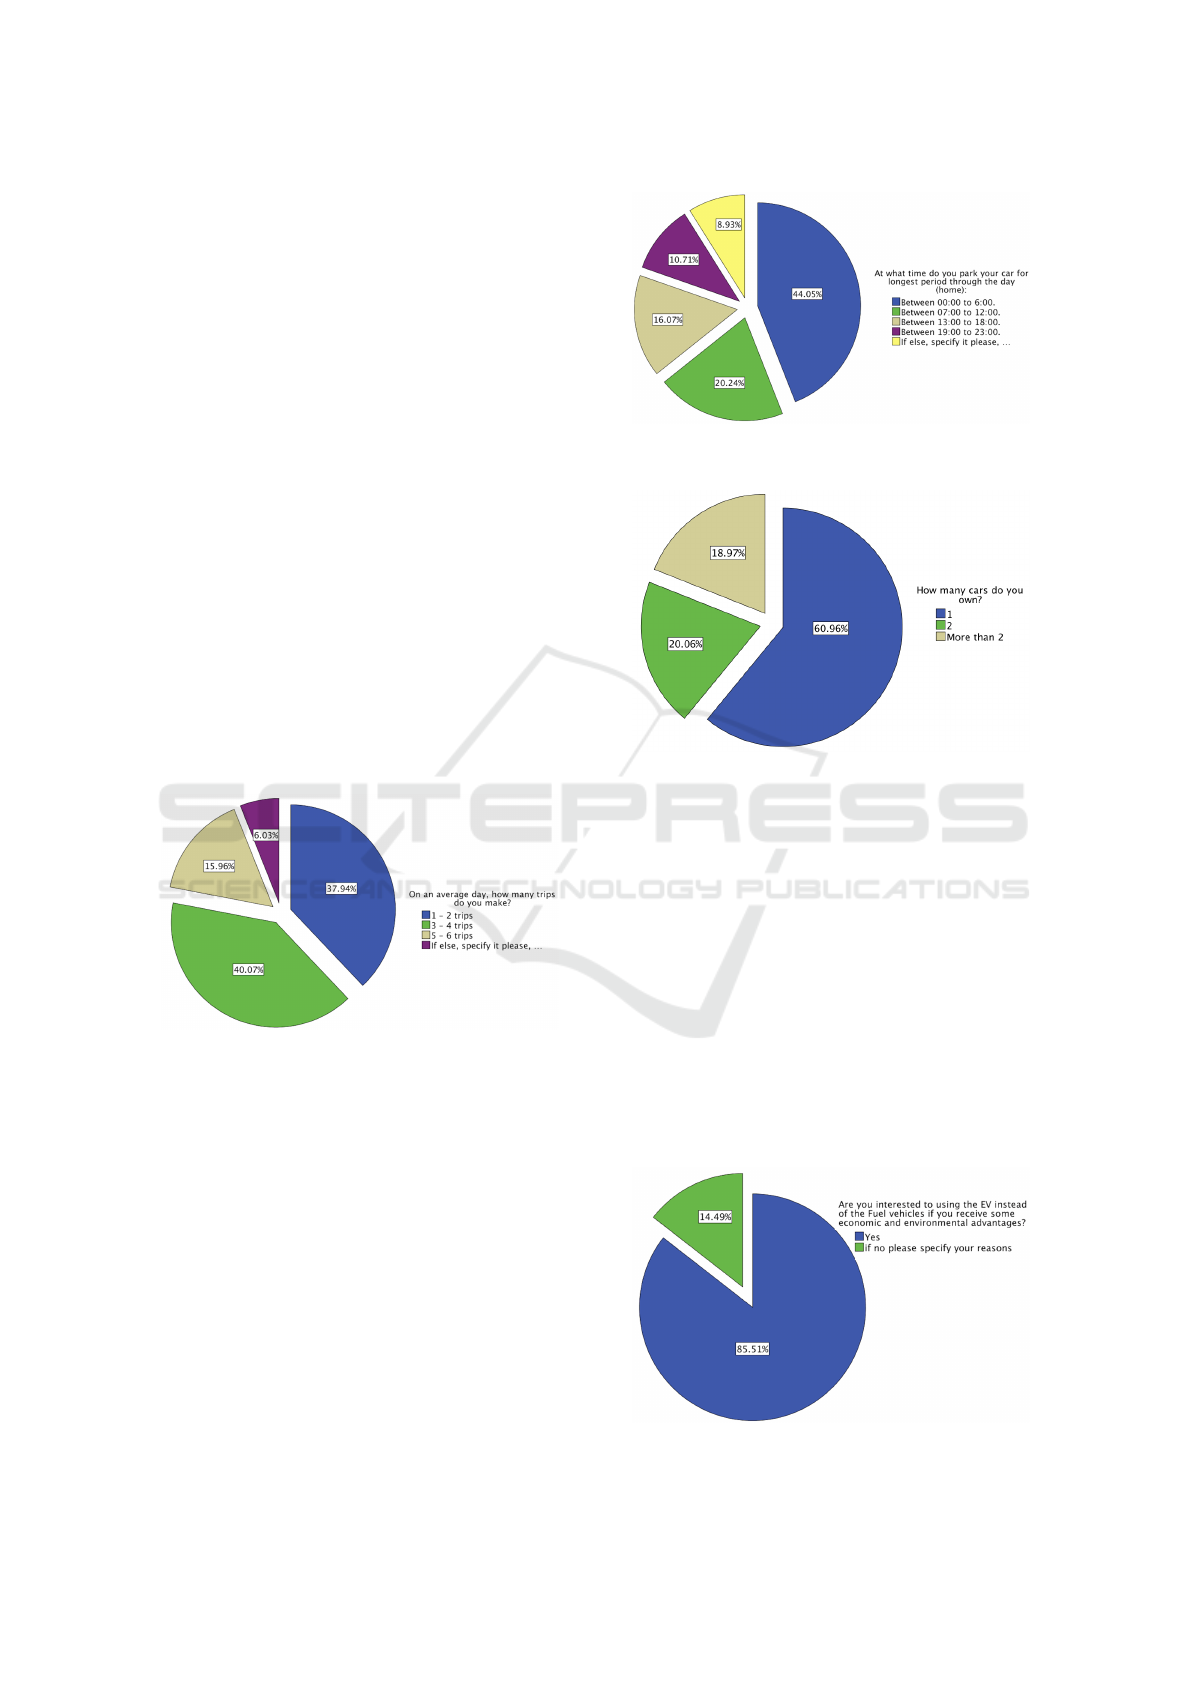
In terms of the daily trips number that the drivers
make we found that, as Figure 3 illustrates the drivers
who make 3 - 4 trips daily are the highest number of
the participants for about 40.07%. Additionally, the
second highest number is the individuals who make
1- 2 trips, about 37.94%. Afterward, the drivers who
make 5 - 6 trips are only about 16% of the sample.
To capture the fourth option and by applying thema-
tic analysis technique, the most repeated response is
greater than or equal to 10 times. Thus, we count that
as a forth option.
Figure 3: The number of trips the participants make daily.
Also, as Figure 4 shows about the half of the sam-
ple park their vehicle for the longest period between
00:00 to 6:00, and we think this is since the indivi-
duals sleep on this time. The second highest is bet-
ween 07:00 to 12:00 where the participants are in their
workplace or their school in this period. Lastly, on the
very close percentages, the individuals who park be-
tween 19:00 to 23:00, and those who park in other
periods which have not been described in this study.
Additionally, As Figure 5 shows, there are 40%
of the participants who have more than one vehicle
which make the V2G technology more efficient and
this will be discussed in the finding section (Section
5).
Ultimately, to examine the feasibility of applying
the V2G in Saudi Arabia, we asked twofold questions
Figure 4: The longest period through the day the partici-
pants park their cars.
Figure 5: The number of cars the participants own.
at the end of the study.
• Are you interested to using the EV instead of the
fuel vehicles if you receive some economic and
environmental advantages?
• If you will receive more economical advantages
from using V2G, are you interested to using the
V2G?
The majority of the participants chose to drive EV,
about 85% , as Figure 6 shows, which is good indica-
tion. For the remainders, by using the thematic ana-
lysis technique, these responses are the most repeated
response for the reason of the sample selects to do not
use the EV. The first reason is that, the participants
think that the EV is less than the conventional cars in
Figure 6: Choosing between EV or conventional vehicles.
VEHITS 2018 - 4th International Conference on Vehicle Technology and Intelligent Transport Systems
240
terms of performance. Furthermore, it requires long
time to recharge. Further, the EV until now is very ex-
pensive if we compare it with the conventional cars.
Finally, the existing Saudi Arabian infrastructures do
not support this kind of technology.
Before we discuss the study findings and provide
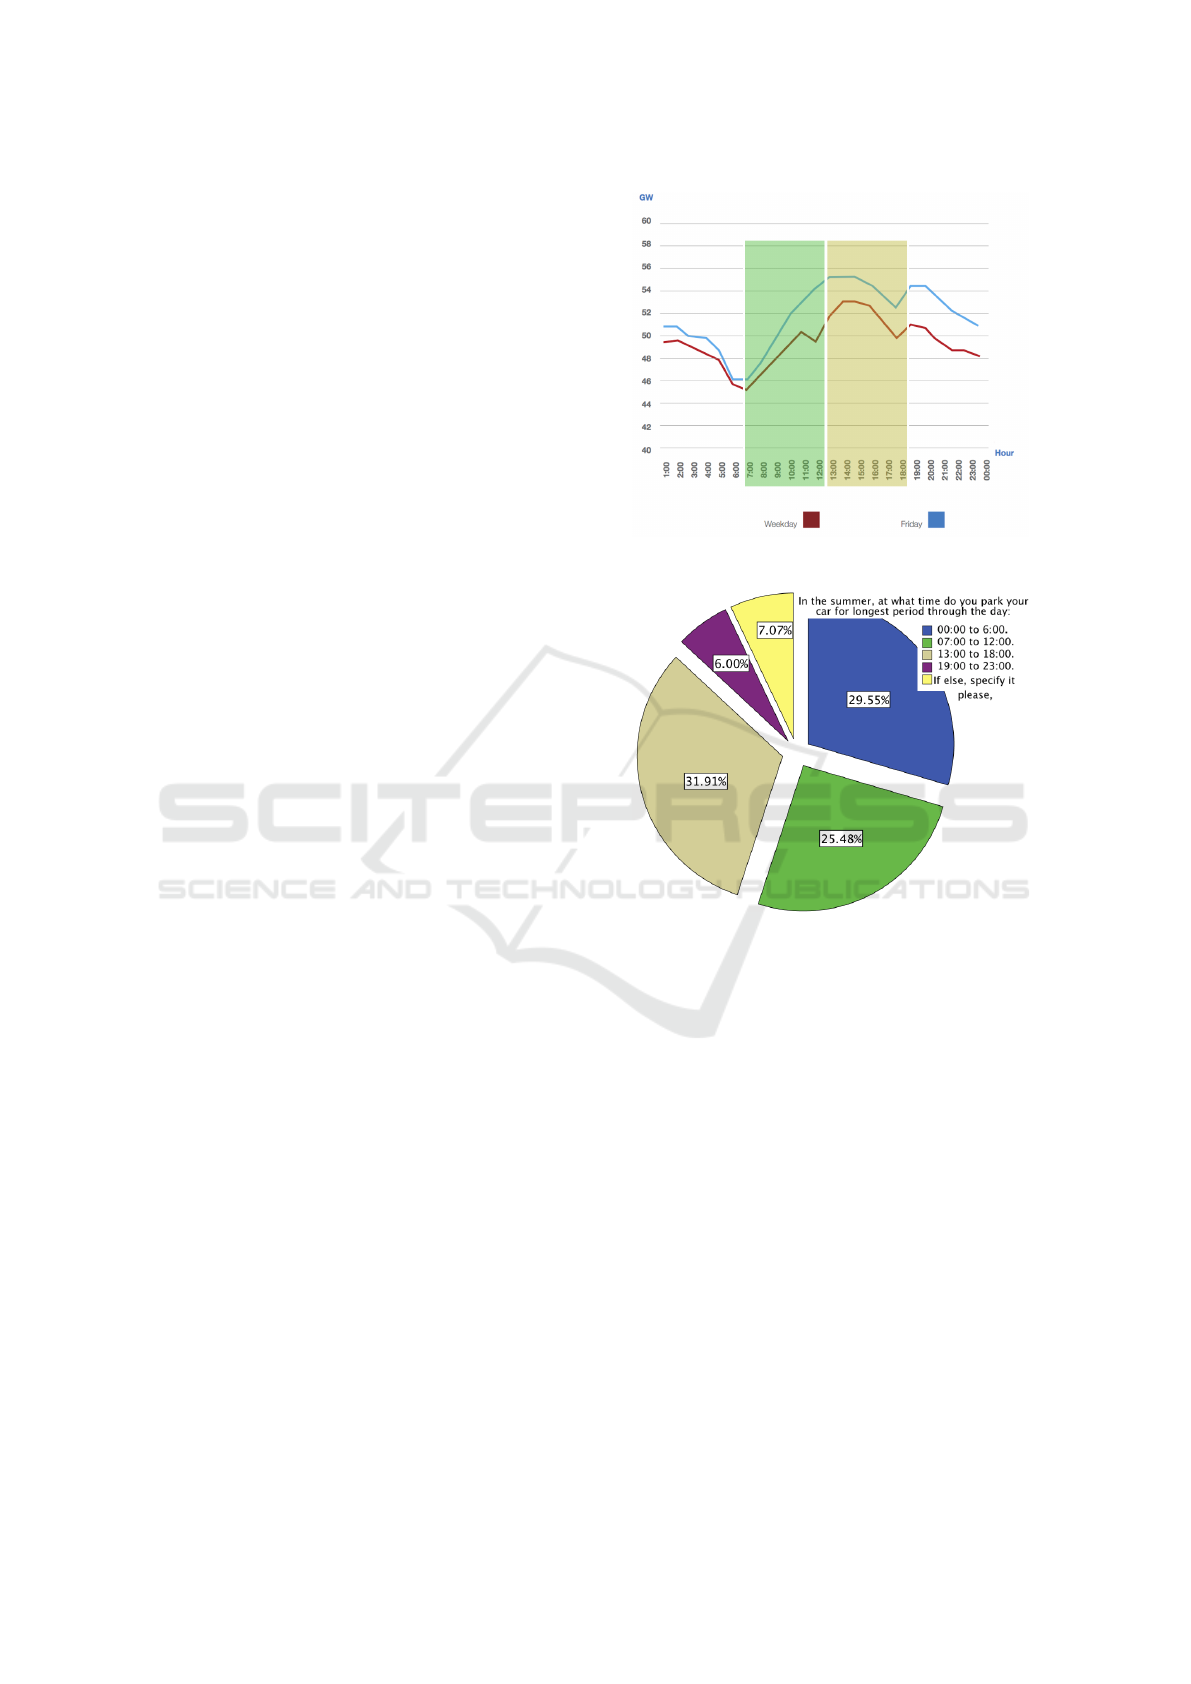
the conclusion, we will briefly analyze the power data
that confirms there is a peak demand problem at the
summer in Saudi Arabia. As Figure 7 illustrates,
which is typical daily load curve during summer, the
peak demand at friday is more than the other days be-
cause it is the social day in the Saudi Arabia and other
Muslim countries where the people gathering more
than other days. In a weekday, at 1:00 the curve is
decreasing steadily until 7:00, where the curve is in-
creasing gradually with some fluctuations until 18:00.
Then, the peak curve is decreasing until the end of
the day. From this figure, we can conclude that the
peak demand period at the summer in Saudi Arabia
is between 7:00 and 18:00. Further, we got figure 9
from the Saudi Electricity company which is an up-
dated version for the current peak demand, it is for 4
days in August 2017, as the figure shows, it is almost
same as the figure 7 which is for 2015. In the follo-
wing section we will discuss the study findings and
conclusions.
5 STUDY FINDINGS AND
CONCLUSIONS
In this section, firstly we will discuss the study fin-
dings as points, then we will provide our conclusions
and future work.
• About 40% of the sample has more than one vehi-
cle, this gives a chance to them to use the spare
vehicle to trade in the power market with more
relaxed conditions. Accordingly, we expect the
V2G technology might play a crucial role in the
Saudi power market.
• Most of the participants (about 90%) are used
their vehicles less than 4 hours (1 - 2) or (3 - 4)
which means the vehicle are not being used about
83% of the time. Thus, we can use this time to
trade with the power market without disturbing
the drivers, if we apply the V2G concept in a cle-
ver way.
• About 85% of the participants are interested on
using EV generally and V2G technology specifi-
cally which is a promising results if we consider
that happens in a society has not has any aware-
ness about these technologies. Consequently, ba-
sed on these results we belief if we encourage the
Figure 7: Typical daily load curve during the summer.
Figure 8: The longest period through the day the partici-
pants park their cars during the summer.
people and educate them about these technologies
these numbers might be increased.
• In the figure 7 we use the information that has
been provided by ECRA (ECRA, 2015) for the
typical daily load curve during summer and we re-
flect the information that we collect from the par-
ticipants for the longest period they parked their
vehicles in the summer. As the figure 7 shows,
the most interesting finding is that the longest pe-
riod time the drivers park their vehicles during
the summer ( between 13:00 - 18:00 and between
7:00 -12:00 which represent about the 60% of the
sample as figure 8 illustrates) is the same period of
the peak demand. Thus, we can claim that, using
V2G in the Saudi Arabia could support the grid
to face the predicting peak demand at the summer
period in the next decade.
In conclusion, this study considered the feasibility
of using the V2G to face the electricity peak demand
The Feasibility of using V2G to Face the Peak Demand in Warm Countries
241
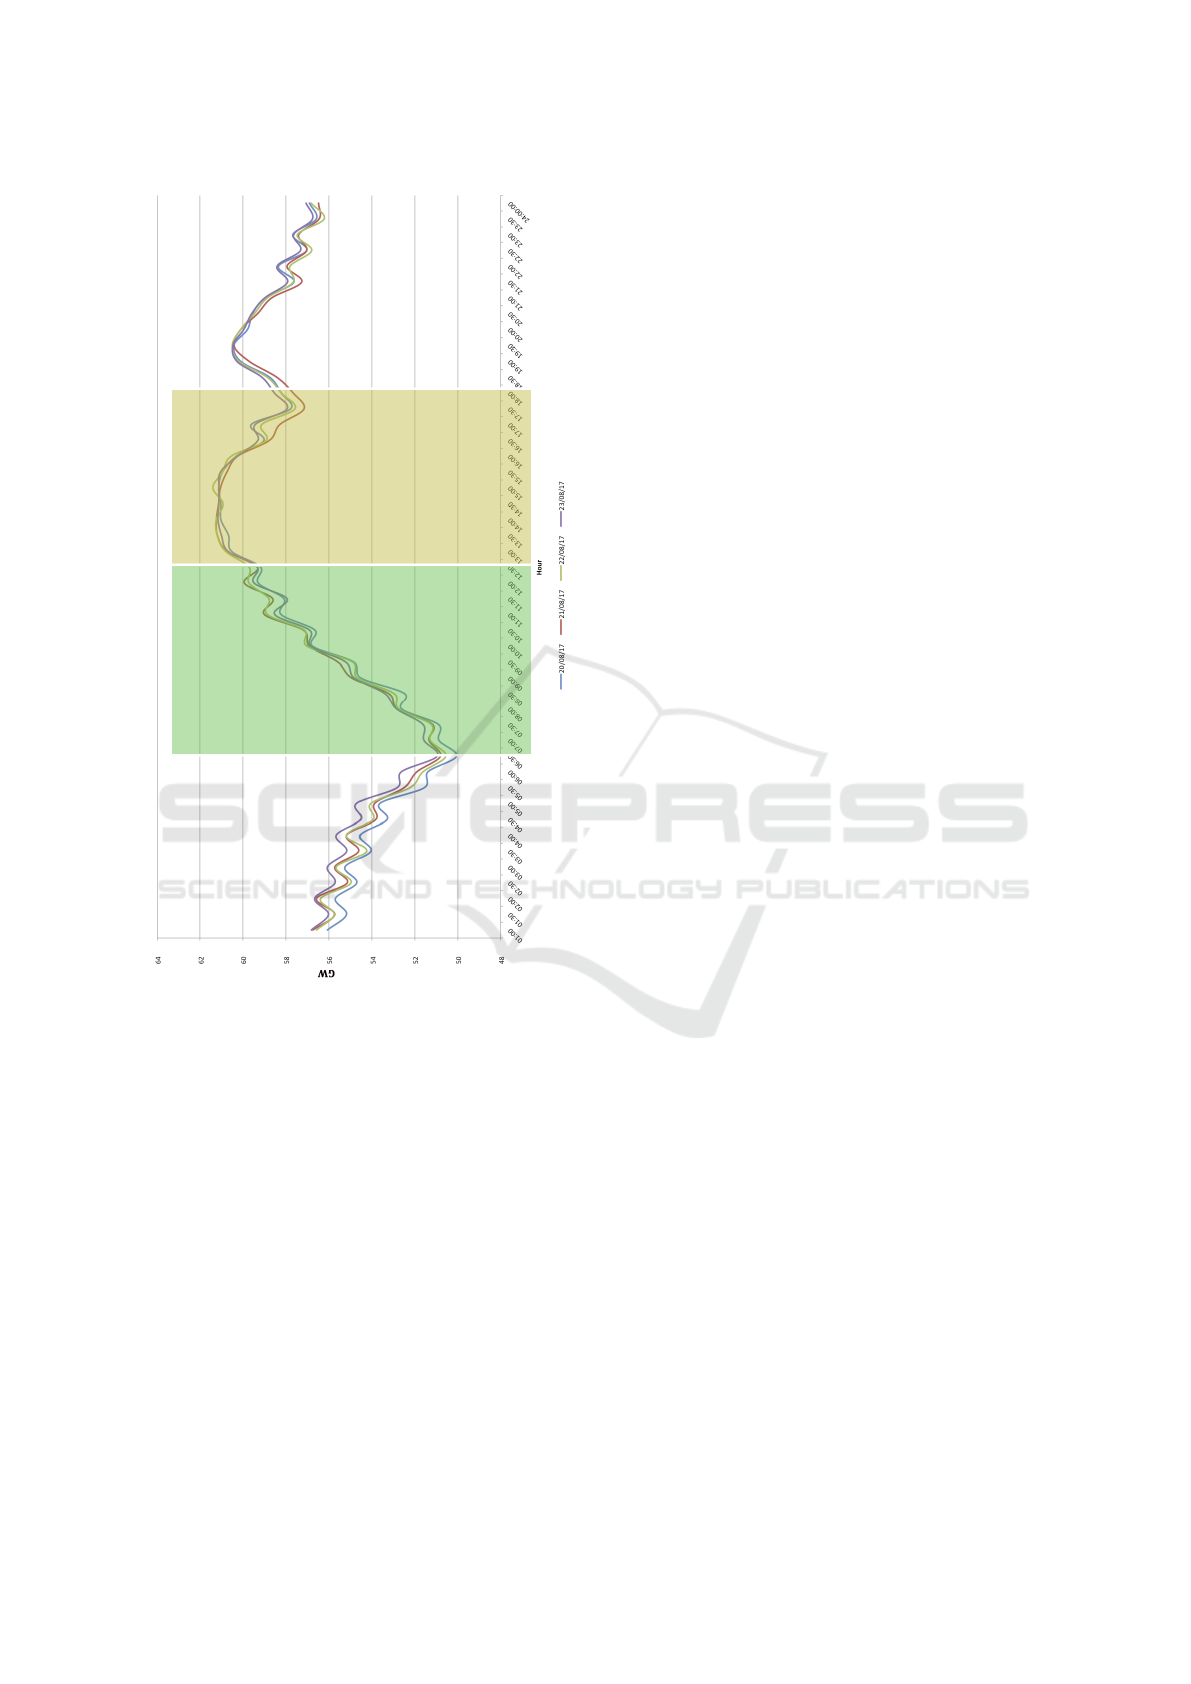
Figure 9: Peak demands for 4 days in August 2017.
in the summer season in the warmest countries. As
we discussed earlier, ECRA states that, nowadays, in
the summer the power peak demand is very high in
Saudi Arabia, and they predict that to rise greatly in
the following ten years. Based on the survey results,
we belief there is a promising opportunity to the V2G
technology to support the smart grid in the high peak
demand in the summer.
For future work, we will develop an algorithm to
trade with the power market on behalf of the V2G dri-
vers in aim of maximizing their profits by understan-
ding their vehicle usage behavior. To do so, we are
going to deal with two types of uncertainties, which
are the vehicle usage uncertainty and the power mar-
ket price uncertainty. Moreover, we are planning to
quantify the benefits of using V2G to support the grid
at the peak demand in the summer in Saudi Arabia as
a second phase of this study.
REFERENCES
Christiansen, H. and Skougaard, B. Z. (2015). Documen-
tation of the danish national travel survey (2015 ver-
sion).
Council, P. S. R. (2011). Traffic choices study.
Danny Blair, Caleigh Christie, M. M. B. M. (2011). Auto21
research data. Technical report, University of Winni-
peg.
ECRA (2011). Bringing demand-side management to the
kingdom of saudi arabia. Technical report, Electricity
& Cogeneration Regulatory Authority (ECRA).
ECRA (2015). Annual statistical booklet for electricity
and seawater desalination industries. Technical re-
port, Electricity & Cogeneration Regulatory Authority
(ECRA).
Kempton, W. and Tomi
´
c, J. (2005). Vehicle-to-grid power
fundamentals: calculating capacity and net revenue.
Journal of power sources, 144(1):268–279.
Matar, W., Murphy, F., Pierru, A., and Rioux, B. (2015).
Lowering saudi arabia’s fuel consumption and energy
system costs without increasing end consumer prices.
Energy Economics, 49:558–569.
NHTS (2016). National household travel survey.
Tomas, M. (2013). European union energy policy integra-
tion: A case of european commission policy entrepre-
neurship and increasing supranationalism. Energy po-
licy, 55:435–444.
Wu, Q., Nielsen, A. H., Ostergaard, J., Cha, S. T., Marra,
F., Chen, Y., and Træholt, C. (2010). Driving pat-
tern analysis for electric vehicle (ev) grid integration
study. In Innovative Smart Grid Technologies Confe-
rence Europe (ISGT Europe), 2010 IEEE PES, pages
1–6. IEEE.
VEHITS 2018 - 4th International Conference on Vehicle Technology and Intelligent Transport Systems
242
