
Design Study for Creating Pathfinder: A Visualization Tool for
Generating Software Test Plans using Model based Testing
Kuruvilla Lukose
1
, Shivam Agarwal
2
, Vidyashankar Nagesha Rao
1
and Jaya Sreevalsan-Nair
2
1
Altair Engineering India Pvt. Ltd., Bangalore, India
2
Graphics-Visualization-Computing Lab, International Instittue of Information Technology, Bangalore, India
Keywords:
Graph Visualization, Test Plan Generation, HCI, Model based Testing, CAD/CAE Applications.
Abstract:
Model Based Testing (MBT) is a popularly used software testing technique in the software industry. However,
there still exists a gap between the awareness of benefits of MBT and its adoption in the industry, specifically
in the Computer Aided Design (CAD) or Computer Aided Engineering (CAE) domains. This can be predo-
minantly attributed to the learning curve of using many of the existing MBT tools. To address this gap in the
CAD/CAE industry, we propose Pathfinder - an MBT tool, with a Graphical User Interface (GUI), for guiding
a software tester in generating test plans for a system-under-test (SUT). The goal of using Pathfinder is for
obtaining consistency and reproducibility in the generated test plans across a team of software testers. Our tool
introduces a novel representation of the SUT as a High-level Model (HLM), and the use of graph visualization
for test plan generation from the HLM. We have designed the GUI to be intuitive for the tester to generate test
plans and select relevant tests, which precedes the test execution done outside of our tool. Here, we discuss the
design decisions we adopted towards creating Pathfinder, and demonstrates its usage with two case studies.
1 INTRODUCTION
The current generation of software applications,
which are used in mechanical design and en-
gineering simulation, are feature-rich and gene-
rally have a graphical user interface (GUI). Owing
to the complexity of the applications, the re-
spective GUIs require very complex user inte-
ractions. Examples of such applications in-
clude HyperMesh
R
, HyperGraph
R
, SolidThinking
Inspire
R
, HyperView
R
. The performance of such ap-
plications is measured by the consistency, efficiency,
and conciseness in both functionality and usability.
Owing to the complexity of the software of these
applications, quality assurance (QA) testing of such
GUI-based tools pose several challenges to the soft-
ware testers. One such challenge which we frequently
face is the lack of support for collaborative QA tes-
ting. Thus, the larger question we attempt to answer
is: “How will a team of software testers be able to ge-
nerate or devise a consistent test plan or a set of tests
that represent a feature in the software system with
desirable test coverage, with an additional condition
of repeatability of such a generation?”. While there
are several theoretical results, many of them are not
usable in real-world scenarios, predominantly owing
to steep learning curves, low adaptability, and shor-
ter cycles for development, testing and product rele-
ases. Additionally, in reality, the software testers do
not have the expertise or the skills to fine-tune many
of the state-of-the-art, but complex, QA testing tools.
Thus, in practice, the team relies on ad-hoc practi-
ces and individual initiatives in lieu of the QA testing
tools. The downside of such initiatives is that such
tests are neither unique nor reproducible. This leads
to the scenario where two software testers from the
same team assigned with testing the same application
tend to arrive at different sets of tests. Since the test
generation process lacks a formal basis for determi-
ning sufficiency and code coverage of the tests, the
generated test plans tend to be inconsistent with an
uneven test coverage, vacillating between over- and
under-testing.
Given these gaps in formalizing the test genera-
tion process in a QA team, we propose an approach of
building a High-Level Model (HLM)
1
of the system-
under-test (SUT) and exploring the HLM using graph
visualization for test plan generation. Our approach
is motivated towards adoption of model based testing
(MBT) for overcoming some of the defects of manu-
1
An HLM is a generic term used for models constructed
for various purposes, which in our case is restricted to a test
model.
Lukose, K., Agarwal, S., Rao, V. and Sreevalsan-Nair, J.
Design Study for Creating Pathfinder: A Visualization Tool for Generating Software Test Plans using Model based Testing.
DOI: 10.5220/0006622302890300
In Proceedings of the 13th International Joint Conference on Computer Vision, Imaging and Computer Graphics Theory and Applications (VISIGRAPP 2018) - Volume 3: IVAPP, pages
289-300
ISBN: 978-989-758-289-9
Copyright © 2018 by SCITEPRESS – Science and Technology Publications, Lda. All rights reserved
289

ally generated test plans. Our proposed visualization
tool, Pathfinder enables QA testers to build HLMs
which are testing models, and generate appropriate
test plans. In this paper, we additionally critique our
design decisions for creating Pathfinder
2
. The novel-
ties of Pathfinder are two-fold – (a) a GUI for gene-
rating and reusing relevant HLMs for MBT of GUI
applications in the Computer Aided Design (CAD)
and Computer Aided Engineering (CAE) domains,
and (b) use of visualization as a technique to engage
the QA tester in exploring the HLMs and generating
test plans, using a scientific and deterministic appro-
ach. The scientific process entails complying with the
requirements of QA testing, with the goal of consis-
tency and sufficiency in test coverage. The determi-
nistic process enables reproducibility in the test plan
generation. Thus, the advantages of Pathfinder with
respect to software testing include: (a) reduction in
the number of overlapping test cases, (b) consistency,
reproducibility and reusability of test cases across a
team of software testers, thus improving testing ef-
ficiency, and (c) the visual exploration of the HLM
and the generated test plans, paths, and cases. Visu-
alization enables the user to prioritize tests rationally.
Thus, overall, Pathfinder makes the HLMs usable in
every aspect of software test generation, which impli-
citly improves the practicality and usability of MBT
in industrial settings. In this paper, we discuss the de-
sign of Pathfinder and demonstrate its usage in two
different case studies.
2 RELATED WORK
3
The usage of MBT has matured over time in the
software testing community. The approach is ba-
sed on building an abstract, but high-level, model
of the software and using the model for generating
test cases through various principles or techniques.
The central idea of MBT has been to bring finite
state modeling and software testing together, simi-
lar to the testing of hardware components using fi-
nite state models (Chow, 1978). Several case studies
of MBT given by (Apfelbaum and Doyle, 1997) have
demonstrated its advantages. Even though increase
in efficiency of software testing teams had not been
an intended outcome of MBT, (El-Far and Whitta-
ker, 2001) have found strong correlation between the
adoption of MBT and team efficiency.
2
Pathfinder website http://pathfinder.au-syd.
mybluemix.net/ has demonstration video and high-
resolution images of the case studies.
3
To our knowledge, no dedicated visualization approa-
ches exist for MBT.
On MBT Tools: There exist several MBT tools
with varying sets of features. Several studies have
provided categorization of these tools (Dias Neto
et al., 2007; Utting et al., 2012), based on the approa-
ches used for implementing MBT. (Utting and Lege-
ard, 2010) have elaborated on various practices in all
stages of the MBT workflow, such as, model creation,
test generation, execution, advantages/disadvantages
of the approach etc. AGEDIS (Hartman and Nagin,
2004) is one of the open-source tools available, which
integrates various processes of MBT, and has been de-
ployed in industrial environment. Other state-of-the
art MBT tools are described in (Artho et al., 2015;
Belinfante, 2010; Dranidis et al., 2012; Huima, 2007;
Micskei, ). (Chinnapongse et al., 2009) have proposed
the use of graph visualization for navigating through
the finite-state machine representation of the model.
We have extended their work on static graph visu-
alization by using a GUI for exploring the network
with relevant user interactions for test plan genera-
tion. (Sarma et al., 2010) have compared two MBT
tools, namely Confirmq’s QTronic and Microsoft’s
SpecExplorer 2010, in an industry setting, and repor-
ted that both tools have a steep learning curve for soft-
ware testers. GraphWalker (Karl, 2010) is similar to
our Pathfinder, as it is an MBT tool which uses graph
visualization. However, GraphWalker considers a test
model with the level of granularity of function names
as nodes, as opposed to the more abstract HLM (at a
coarser level of granularity) that we use. GraphWal-
ker is a tool for both test generation as well as exe-
cution, whereas our tool is for test generation exclu-
sively. Our design decision is driven towards preser-
ving the testing environment as it was prior to the in-
troduction of Pathfinder, where in the QA testers write
scripts corresponding to test plans and run the tests on
a black box GUI test automation tool, e.g., eggplant
4
.
On MBT for Test Generation: JUMBL (Pro-
well, 2003) generates test cases based on the usage
model and its statistical properties. The model is
a finite-state machine, which is represented using a
graph, where the nodes are states. A specific action
is depicted by an edge, whose weight is the probabi-
lity of using or performing the action. The probabi-
lities of usage of such actions are then used in Mar-
kov chain to generate test paths. Our work is different
from JUMBL as we do not use statistical testing ap-
proach. (Bernard et al., 2006) have discussed the ge-
neration of test scripts using UML and have also ex-
plored various test coverage criteria, while we use vi-
sual exploration of the HLM for arriving at test plans.
4
https://www.testplant.com/eggplant/testing-tools/
IVAPP 2018 - International Conference on Information Visualization Theory and Applications
290

3 DESIGN OF PATHFINDER
We propose Pathfinder as a tool to explore the HLM
for determining a consistent set of software tests for
GUI-based application, complying with requirements
of sufficient coverage of software testing and rapid cy-
cles of agile development. While Pathfinder is usable
for software pertaining to other industries, our design
is based on GUI application used in the CAD/CAE
industry for modeling mechanical parts.
Generally, the SUT is feature-rich, which expo-
nentially increases the number of software test ca-
ses with addition of features. It is neither practical
nor economical to execute such large sets of test ca-
ses. However, one can perform test selection by ran-
king the tests using specific criteria and choosing the
highly ranked ones to give a realizable and pertinent
subset of tests. In practice, test selection is the out-
come of a pre-determined software model, which in
our case, is the HLM. Our proposed HLM selects
∼ 10 of ∼ 10000 tests giving us: (a) a usable subset
consisting of unique and consistent set of tests, and
(b) reduction in test case variability due to perception
and expertise variations across testers.
In an ideal software testing practice, the (formal)
specifications used for software development drive
both development and testing. However, in reality, the
software testing team dedicated for a single product
in a suite of products is small, and the documenta-
tion is not updated as rapidly as that of the specificati-
ons. Additionally quicker cycles of agile development
and product releases require efficient ways of adding
new features to existing software. Manually genera-
ting test plan for the entire software after addition of
new features leads to repetitive work, which is highly
error-prone and results in uneven testing. Our propo-
sed HLM alleviates reconstruction of the test model
during agile development.
Our Definition of an HLM: The HLM of a GUI-
based software application is a high-level abstraction
representing user interactions with the application.
For instance, such applications in the CAD/CAE
domains have high-level actions, such as, opening
a complex geometric model, enabling certain visu-
alization controls in the GUI, choosing an appropri-
ate predetermined viewing orientation, and selecting
a rendering style. These actions are at a high-level
definition in comparison to its corresponding micro
interactions, such as, radio button selections, mouse
clicks, drop downs, etc. The high-level actions trans-
form the SUT, i.e. the GUI application, from one
“state” to another. For instance, action of “loading
new geometry” changes the state of new session on
the GUI to a state containing information of loaded
geometry. The HLM captures state transitions, and
we can visually represent the HLM as a state transi-
tion diagram, which is essentially a network. Thus,
we represent the high-level actions and states in the
HLM as a “model-based network” (MBN)
5
. In such
an abstraction, the node of a MBN is a state of the ap-
plication, and its edge corresponds to the correspon-
ding high-level action for state transition. Highly des-
criptive networks of application behavior can be as-
sembled using this basic technique. Thus, the HLM
is an “image” of the complex application fed into the
testing pipeline. The most significant contribution of
HLM is in quick updates of the “image” during agile
development where addition and deletion of features
are involved, thus enabling quicker testing cycles.
We propose visualization of the MBN for cre-
ating, editing, and exploring the HLM, as the vi-
sual representation provides the spatial context of the
MBN that demonstrates coverage of selected tests.
In practice, building a HLM for user interactions of
certain parts of the GUI-application is a collabora-
tive activity among developers, testers, program ma-
nagers, and even customers. Deliberate creation of
the HLM help in limiting the scope of possible high-
level interactions, which are essential to be captured
in test cases. Just as the tester uses the HLM to gene-
rate test case definitions, other stake holders may re-
use such an HLM for other specific purposes, owing
to the coarse-grain abstraction of the HLM. e.g. a pro-
gram manager can effectively use the HLM to convey
to developers what an application can and cannot do.
The developer may use the HLM to decide how best to
implement the underlying code. The MBN can be al-
gorithmically traversed under a variety of constraints.
Each traversal is a sequence of visits along a path of
nodes and edges, which represents a possible use case
in the SUT. Thus, using such network traversals, test
case definitions can be automatically discovered from
a HLM. We emphasize that a na
¨
ıve implementation of
this idea will typically result in a combinatorial explo-
sion of possible test case definitions. Thus, it becomes
necessary to control the graph traversal intelligently
with a variety of constraints.
Proposed Features of Pathfinder: We propose
features of “Pathfinder,” which will allow its users to
create an HLM and explore it for identifying test plans
and suite. The HLMs are to be built intuitively using
simple user interactions, considering the skill-set of
target users, namely software testers. The HLMs must
be saved from a session in its graph format, so that it
can be loaded in a new session. Various constraints
5
Networks contain nodes and links, equivalent to verti-
ces and edges of a graph data structure. In Pathfinder, they
are referred to as ’nodes’ and ’edges’ respectively.
Design Study for Creating Pathfinder: A Visualization Tool for Generating Software Test Plans using Model based Testing
291

are to be applied to the MBN, e.g. where to start
and end the traversal, what nodes to include and ex-
clude, what nodal dependencies to specify, etc. The
user must be able to assign node and edge weights,
based on the importance of the node or edge in the
SUT. The user must be able to then generate poten-
tial test case definitions by algorithmically traversing
the graph under the user-specified constraints. The
user must be further able to perform test selection
to cull (∼ 10000) of potential test case definitions to
∼ 10 per feature of the SUT. Thus, we provide opti-
ons for ranking to be used for test selection, where the
highly ranked tests are meaningful subsets to be retai-
ned. The user must be able to iterate through each
test in the culled set to ascertain the areas of graph
coverage. One must also be able to see the full co-
verage represented by the total subset. Finally, the
chosen test definitions must be outputted in an ASCII
text file, which can be co-edited by the testing team
and be further post-processed to produce a variety of
test plan documents. Thus, we design Pathfinder as
a GUI-based application for building and preparing
HLMs for feature-rich
6
end-user applications, e.g.
GUI-based CAD/CAE tools. We visualize the HLM
as a graph, instead of the conventionally used alterna-
tive option of matrices, as the testers need to visua-
lize the connectivity when identifying constraints for
graph traversal in the MBN.
Test Plan Generation: is the first step of the soft-
ware QA process. A test plan, which is a text do-
cument containing test cases, is a plan of the end-
to-end testing process. The test plan contains list of
tests and the details of logistics, e.g. testers assigned
for text execution, expected test outcomes, require-
ment of automation, category of test cases and testing
phase, etc. Test plans are typically written by a QA
Engineer (QAE)
7
by considering the specifications of
a software development project and using his/her ex-
perience in the relevant domain, e.g. CAD/CAE. The
MBT approach begins with the model preparation,
subsequent to the test plan generation.
3.1 Testing using High-level Model
When using MBT, the steps in the testing workflow,
that sequentially follow the test plan generation are:
model preparation, test generation, test selection, and
test saving. We follow design principles specific to
6
Henceforth, to disambiguate the “feature” of the SUT
from the “feature” of Pathfinder, we refer to the former as
“functionality” of the SUT.
7
One of the authors, who also participated in the case
study, is a QAE with 15+ years of QA testing experience in
the CAD/CAE industry.
each step, in Pathfinder.
Model Preparation: is the step when the HLM
is constructed for a specific functionality of the SUT,
e.g. the Contacts or the Fasteners (in Section 4). A
test suite is a set of all tests to be performed on a cer-
tain section of the software of the SUT. This software
section can be logically defined as a finite, but inclu-
sive, set of states, S . Thus, a test suite can be identi-
fied as a set of states and their corresponding transiti-
ons. Narrowing down, a “test case” of the SUT refers
to a set of tests performed on a part of the section of
the software of the SUT, where the tests are based on
certain constraints, e.g. specific start and end states of
the SUT during the test. Thus, the HLM is created of
S and a test suite corresponds to the entire network in
its MBN. A test case corresponds to one of the paths
between chosen source and destination nodes in the
MBN. The weights
8
of the nodes and edges of the
MBN are specified in this stage, based on the QAE’s
estimation of their respective significance. The edge
weights could be optionally computed from the node
weights in the current stage using user-defined values,
or preferably, automatically during the test generation
step.
Test Generation: is the step of generating indi-
vidual test cases in a test plan. In our case, a test
case of the HLM is represented by a path, called as
test path, in the MBN, and is executed as a test. The
path traversal is equivalent to the code coverage in
the test case. The length of the test path is the num-
ber of edges in the path; and its weight is the sum
of the edge weights. The constraints we use in this
step as well as in the test selection step pertain to
restricting the number of tests and the length of test
paths. In this, we use specific constraints on the num-
ber of nodes per test (NPT) and model search type,
namely, exhaustive or sampled. Using minimum and
maximum values for NPT ensure sufficiently long test
paths, thus avoiding trivially short and inefficient long
tests. The exhaustive model search on the HLM re-
turns all possible test cases, from the walks through
the entire network. The sampled model search on
the HLM returns a set of random samples of paths,
making it more efficient than the exhaustive search.
Sampled model search is preferable in the case of
large complex HLMs, whereas, exhaustive search is
desirable for smaller HLMs. The automatic compu-
tation of edge weights from node weights, if chosen
over manual assignment, occurs in this stage.
8
In MBN, node- and edge-weights are values used for
steering the path traversal in desired direction. Their co-
verage refer to inclusion of nodes and edges, respectively,
for a specific test path.
IVAPP 2018 - International Conference on Information Visualization Theory and Applications
292

Test Selection: is the step to select highly rele-
vant steps, which efficiently and sufficiently test a sin-
gle functionality, such as the Fasteners (Section 4).
The culling is performed either automatically or ma-
nually. Automatic test selection is done using either
sampling, namely uniform and random, or coverage
criteria, namely, node-coverage and edge-coverage
options. Sampling does not ensure test coverage of
critical or other important sections of the software.
Hence, specific code coverage criteria, which corre-
sponds to node- or edge-coverage in the MBN, give
more control for desired testing. Node-coverage im-
plies an optimally minimal test path where every node
in the path is visited at least once, and edge-coverage
is the same for every edge in the path. Edge-coverage
gives more number of tests than node-coverage, by
design. Pathfinder offers flexible options for coverage
criteria, namely “fewest tests”, “weighted tests”, and
“stated tests”. “Fewest tests,” which is the default set-
ting, tightens the set of tests returned by the chosen
coverage type (node- or edge-) with the least num-
ber of tests that visit all the nodes or edges at least
once, respectively. “Weighted tests” expand the set
from “fewest tests” to include the test paths which are
of higher weights. “Stated tests” allows users to inte-
ractively set the number of tests, which the engineer
considers is sufficient for testing a specific functiona-
lity, based on the design specification of the functio-
nality of the SUT as well as his/her experience. This
number should be between the number of tests given
by the “fewest tests,” and the total number of tests
that the coverage type can return. e.g. in our case
study of the Contacts (Section 4), we get 16 and 5 test
paths using weighted and fewest tests, respectively,
for node-coverage based test selection.
Test Saving: For sharing and reusability, the se-
lected tests can be saved and reused across the team.
The test cases, chosen using Pathfinder, are written
into an ASCII text file, in the format of a detailed test
plan. The file is then processed offline generate a Mi-
crosoft Excel file, for readability and identifying the
sequence of actions for executing a test case.
3.2 Visual Exploration of the HLM
One of the ways of engaging software testers in acti-
vely generating test plans from the HLM is by visual
exploration with the help of a GUI. The MBN of the
HLM is best visualized as a node-link diagram than
its alternative matrix visualization, as the node-link
diagram provides the spatial context of connectivity.
Connectivity visualization is important for the QAE
to choose appropriate criteria for test selection.
Graph Visualization: The visualization enables
the user, who is the QA tester, to perform both a sum-
marization of the HLM as well as model exploration.
Node-link diagram of the MBN gives better overview
of the spatial context of the path in the HLM, com-
pared to the traditional way of viewing the test paths
provided in a list in text. Pathfinder allows the user
to exploring the model by selecting test paths in the
tests pruned in the test selection set. This visualiza-
tion, however, requires that the tests are sorted so that
the user prioritizes these paths. We use two-levels of
sorting, similar to a dictionary, which takes into consi-
deration both the length and weight of the path. Sor-
ting of the length of the paths is done in increasing
order, and sorting of weight of the paths in decreasing
order. Hence, in Pathfinder, the “length-then-weight”
sorting gives the heaviest of the shortest paths; whe-
reas the “weight-then-length” one gives the shortest
of the heaviest paths.
Proposed GUI for Visualization: The interface
of Pathfinder has been carefully designed for ease of
use. The GUI consists of four parts, as shown in Fi-
gure 1: “Control-panel,” “Display-area,” “Console-
output,” and “Status-bar.” The Control-panel con-
sists of “Dropdown-menus” for file access, view set-
tings and help; “Functional-control-widgets” which
are required for interacting with the model-based net-
work; and “Shortcut-widgets”, which are a group
of widgets with custom-built icons. The Shortcut-
widgets are for easy access to few of the frequently
used widgets, such as choices in the Dropdown-
menus as well as some of the Functional-control-
widgets. The Functional-control-widgets are further
logically and physically grouped as visibility settings,
and as a stack of tabbed widgets for stages in MBT,
namely, model preparation, test generation, test se-
lection, and cluster selection. “Visibility-group” is a
group of widgets to enable and disable rendering of
different parts of the graph, e.g. nodes, edges, etc.
“Model-preparation-tab” includes widgets for buil-
ding the MBN interactively and editing it, e.g. adding
and deleting nodes, and edges. “Test-generation-tab”
includes widgets for applying constraints and genera-
ting tests. “Test-selection-tab” is for culling relevant
subsets of tests, for instance, based on the coverage
type. “Cluster-selection-tab” is a group of widgets
to enable clustering of tests to enable better mana-
gement of tests. However, test clustering is complex
and needs a separate study of its own, and hence, is
beyond the scope of this paper. The Display-area is
the area dedicated for the node-link diagram of the
MBN. The Console-output displays output messages
of state of Pathfinder, relevant for each interaction of
user with application. The Status-bar shows mes-
sages which guides next actions of the users, e.g.
screen coordinates of last left-mouse-button click on
Design Study for Creating Pathfinder: A Visualization Tool for Generating Software Test Plans using Model based Testing
293

Display-area, etc. The Console-output and the Status-
bar make the Pathfinder GUI responsive. We have
built the software for Pathfinder has been implemen-
ted in C++ with OpenGL and QT libraries.
GUI Design Patterns: For improving adopta-
bility of MBT, we incorporate four different design
patterns in our Pathfinder. Firstly, depending on the
usage style of each user, the configuration settings of
Pathfinder GUI for selections in the widgets in each
of these groups can be saved and reloaded in the sub-
sequent session of Pathfinder. The configuration re-
members the states of checkboxes, radio buttons, or
values, e.g. minimum or maximum values of NPT.
For model creation and editing, the last entered labels
of nodes and edges are saved and automatically re-
loaded in subsequent sessions. Multiple nodes with
specific settings, used previously, can be quickly cre-
ated on the screen one after another without having
to activate “Create node” checkbox each time. Se-
condly, the widget groups, including the tabs, in the
Control-panel are expanded (or maximized), by de-
fault, and can be contracted (or minimized) in order to
maximize screen space to the Display-area. Pathfin-
der is designed to run on screens with large resoluti-
ons (which is usually the case in industrial projects).
This feature has improved the visual experience, par-
ticularly for HLMs with more than 20 nodes. Thirdly,
the model creation and editing functions are made re-
sponsive through the use of prompt messages on the
Status-bar for guiding user actions. We additionally
keep the UI design minimal, light-weight, and crisp,
e.g. requiring an “OK” button for confirmation has
been eliminated, as the “Enter” key for entering va-
lues can double up for confirmations.
Fourthly, the overriding principle governing the
design of Pathfinder is the realization of abilities and
limitations of target users. Constructs and concepts
commonly used in the research community of soft-
ware testing, e.g. MBT, are often not familiar to
and inaccessible to the software testing professionals.
Hence, the design of Pathfinder reflects the limitation
of working knowledge of MBT, not only in what fea-
tures it provides as well as what features it avoids. In-
tuitive color coding and visual feedback are provided
in Pathfinder, for better understanding, in the form of
intuitive colors and two-dimensional rendering. Si-
milarly, we avoid features that require extensive pro-
gramming knowledge-base in Pathfinder. e.g., con-
ditionals, and Boolean logic have been consciously
avoided throughout the GUI. One of the significant fe-
ature of Pathfinder is the graph traversal. We intenti-
onally de-couple graph traversal and application data
dependency in the GUI using appropriate abstracti-
ons in the back-end. An example of the intuitive co-
lor coding is that the start and end nodes for a node
traversal for test paths are colored green and red, re-
spectively
9
. For visually representing dependencies
of the model, specific color combinations have been
used. e.g., two-color combinations are used for indi-
cating two constraints on states for selection nodes in
a test path; and nodes in the path are given the speci-
fic color that corresponds to the constraint they fulfil,
such as constraints could be specific to the geometric
model that has been loaded, e.g. “use bolts invoked
with single hole” and “auto fastener”, as used in our
case study (Section 4).
Visualization Design Study: Following the de-
sign study methodology prescribed in (Sedlmair et al.,
2012), we have conducted design studies, validation,
reflection, and design iterations. We first enumerated
the requirements of the visualization as a guiding tool
for QA testers for exploring and using HLMs for test
plan generation. The Pathfinder GUI went through
two development cycles after feedback from targeted
users. The changes made in the GUI were on logi-
cal grouping of widgets and workflows for logical se-
quences of user interactions. While the node-link dia-
gram is the mainstay of the visualization, we iterated
through the design of the nodes, edges, and glyphs
for weights (Figure 2(Left)). Since most graphs are
skewed (i.e. lean and long) and screen displays are
wider than longer, horizontal layout has been prefer-
red over vertical layouts. Our initial visualization in-
cluded three-dimensional rotation and rendering for
encoding coverage and weights for both nodes and
edges. Coverage was visually represented as “stack
ribbons” in the y-z plane, and weights as “bars” in the
x-z plane. Since the human visual system has higher
accuracy in judgements pertaining to comparisons of
numerical values, in length perception than in planar
position perception, and even lesser in depth percep-
tion (Ware, 2010; Munzner, 2014), we have changed
from using stack ribbons and bars to triangular icons
and then, finally to rectangular icons with linear fill.
The final choice of rectangular over triangular shape
was done based on user feedback.
9
To accommodate issues of the color palette for color
vision deficiency or color blindness, we have used different
values of the color hue, e.g. (0,255,0) and (215,48,39) as
RGB values for green and red, respectively, as per the tip
on using red-green hues together:
http://tinyurl.com/red-green-workaround
IVAPP 2018 - International Conference on Information Visualization Theory and Applications
294
A. Control Panel
B. Display Area
1. Drop-down menus
2. Shortcut-widgets
3. Visibility-group
4
5 6
C. Console Output
D. Status Bar
4. Model-Preparation-Tab
5. Test-Generation-Tab
6. Test-Selection-Tab
I.
II.
III.
3. Visibility-group
3-a
3-b
3-c
3-d
C. Console Output
IV.
C-1
7
Pathfinder User Interface
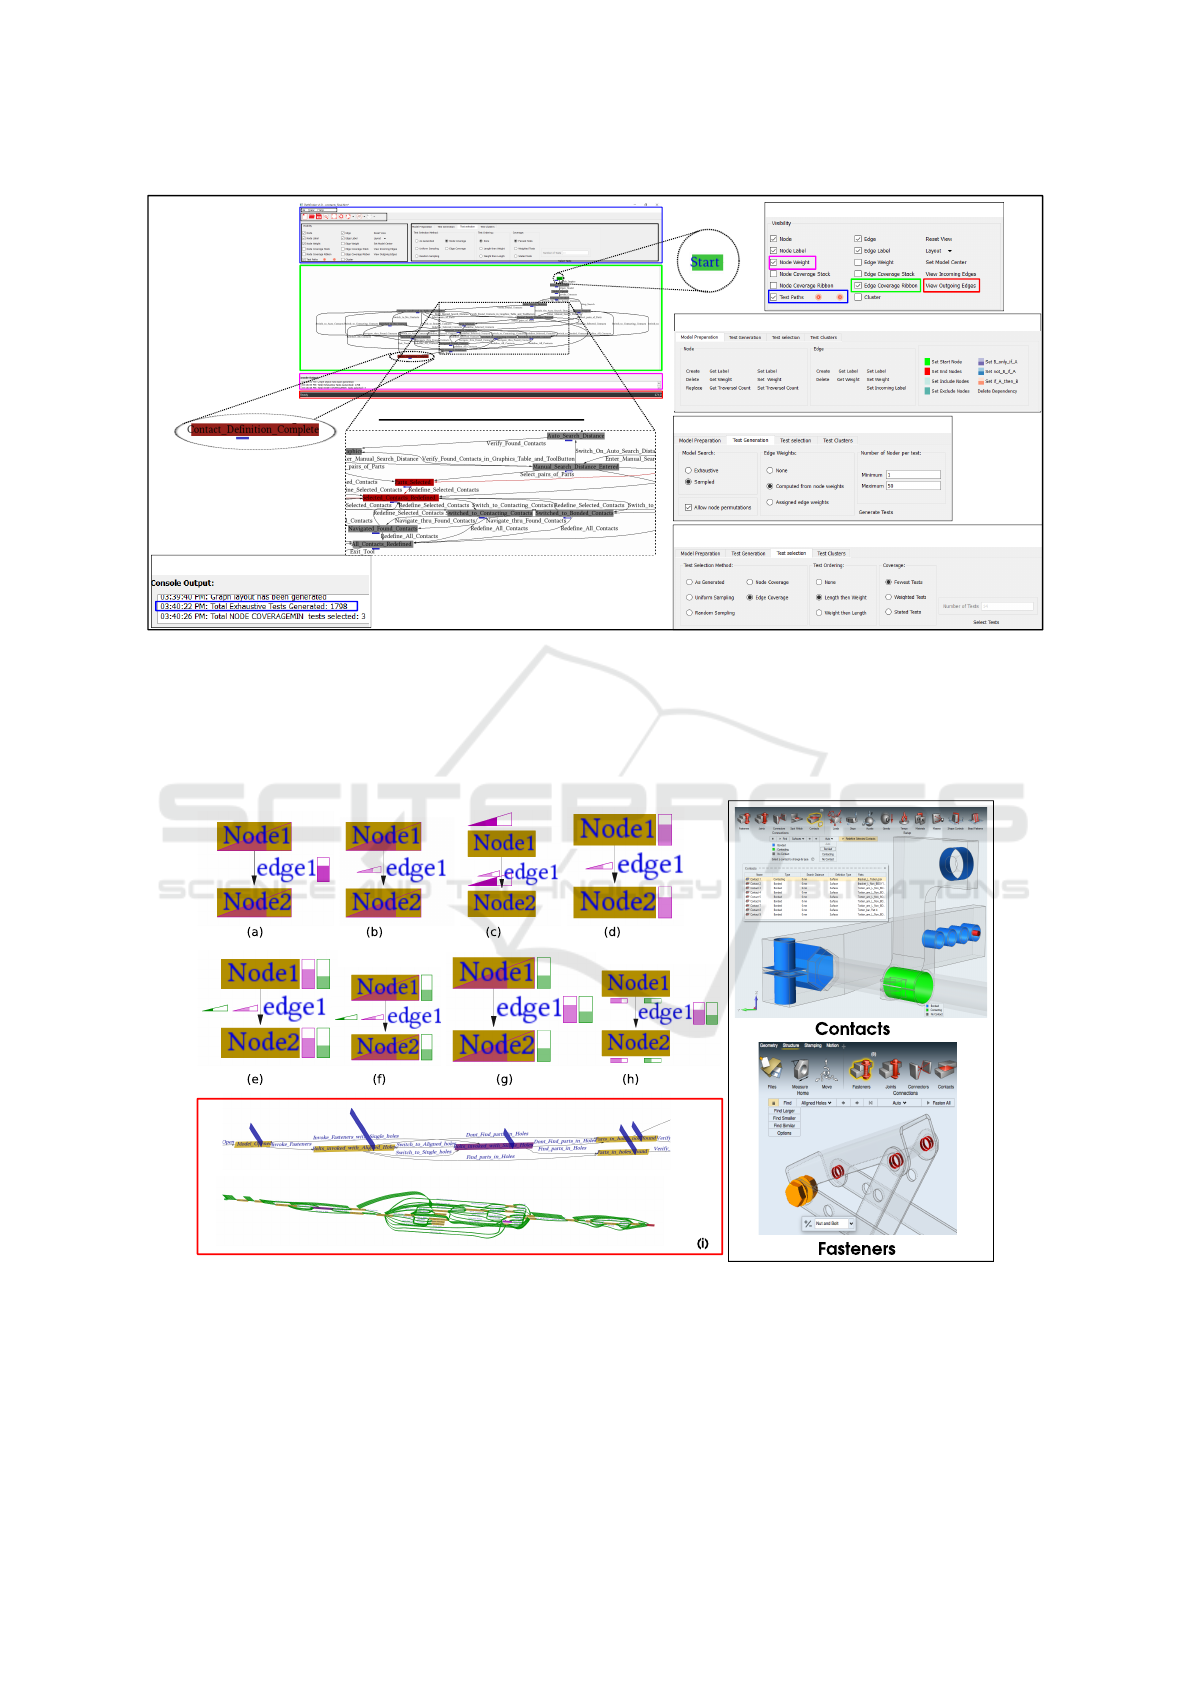
Figure 1: Overview of the GUI of Pathfinder displaying its four components (A-D): Control-panel, Display-area, Console-
output, and Status-bar. The Display-area shows the visualization of the MBN (19 nodes, 19 edges) of the HLM of the Contacts
(Section 4). (1-2) show dropdown menus, and (3-7) show groups of widgets, namely, Visibility-group, Model-preparation-tab,
Test-generation-tab, Test-selection-tab, and Cluster-selection tab, where (4-7) are stackable tabs. The settings in the widget
groups and the highlighted widgets 3-a, 3-b, 3-c, and 3-d are used in our case-study of Contacts. The start and end nodes for
test paths are selected (insets in I. and II.) and rendered as green and red nodes, respectively. III. shows inset of a subnetwork
in the MBN. IV. shows the console output for choice of exhaustive search during test generation step (highlighted in C-1).
Figure 2: (Left) Different design iterations we performed for representation of edge and node weights, including a 3-
dimensional rendering of the same (shown in (i)). For (a)-(h), the magenta glyphs represent the weights of nodes and edges,
respectively; and the green glyphs show the coverage of the nodes and edges. Similarly, in (i), the blue “bars” show weights
and the green “stack ribbons” show coverage. (Right) Screenshots of GUI of Solid Thinking Inspire
R
, showing Contacts and
Fasteners functionalities, which are our case studies.
Design Study for Creating Pathfinder: A Visualization Tool for Generating Software Test Plans using Model based Testing
295

4 CASE STUDIES
Here, we demonstrate how Pathfinder is used in the
software testing workflow or a software quality assu-
rance (QA) process in the case of a GUI-based soft-
ware product, solidThinking Inspire
R
(STI)
10
. This
case study highlights the improvement in the work-
flow due to the use of Pathfinder, based on the inputs
for this case study has been provided by a QA Engi-
neer (QAE), who is one of the authors of the paper.
We study two functionalities here, namely the Con-
tacts and the Fasteners. Figure 2 shows the mecha-
nical parts loaded in STI, where these functionalities
are used, as well as the parts/modules of the GUI of
STI for using these functionalities. We use Pathfin-
der to generate test plan for these GUI modules. In
our case study, we extract an HLM of the states STI
will reach due to the user interactions related to either
functionality on the given geometrical model, i.e., the
mechanical part. The goal here for the test plan ge-
neration is to test the various workflows, which are
specifically for (a) detection of possible contacts in
the mechanical part, and (b) creation or modification
of fasteners in the mechanical part.
We have not compared our work with existing
techniques primarily because of the differences of the
models used in those methods and ours. e.g. if our
SUT is modeled using GraphWalker (Karl, 2010), the
graph grows exponentially when using function na-
mes as nodes of the graph, and it is not compatible
with the rest of the software testing workflow in our
case studies (e.g. test execution). In a different vein,
comparison with JUMBL (Prowell, 2003) is not accu-
rate for our work since the MBT is based on usage
in the former, whereas ours focuses on both usage as
well as behavior, owing to the dependencies involved
in the CAD/CAE domain.
Contacts
11
: is a functionality that determines if
two neighboring surfaces in a mechanical part(s) are
bonding, in contact, or not in contact. STI automa-
tically detects possible contacts in the model. The
Contacts functionality allows the user to manipulate
the current state of presence or absence of contacts
and to create different types of contacts.
Fasteners
12
:is a relatively new functionality in
STI to connect different mechanical parts using
screws and bolts. After loading a three-dimensional
model of the mechanical parts in the application, the
“Fasteners” functionality is used to automatically find
10
http://www.solidthinking.com/Inspire2017.html
11
http://www.solidthinking.com/help//Inspire/2017.3/
win/en us/index.html?contacts.htm
12
http://www.solidthinking.com/help//Inspire/2017.3/
win/en us/index.html?fasteners.htm
the “geometry,” which refers to holes, slots, etc., and
its corresponding (solid) fasteners that physically fit
in the geometries subsequently. The functionality en-
tails user interactions for selecting or deselecting the
geometry, and finding other geometry which satisfy
specific criteria. These criteria include specific range
of dimensions of the selected geometry; comparisons
with the selected geometry, such as similar to or smal-
ler/larger than; or other relevant properties, e.g. single
or aligned holes. In addition to specifications based
on properties of the geometry, STI provides choices
of different types of Fasteners, such as “bolt and nut”
or “screw.” The tool can also automatically choose the
best Fastener type that fits the hole, which is referred
to as “auto.”
4.1 MBT Workflow for Case Studies
We have created the HLM from the MBN, e.g. for
creating the MBN for the Fasteners functionality, we
start by adding nodes that represent states in the crea-
tion or modification of Fasteners in the chosen mecha-
nical part. We then add relevant edges connecting the
nodes. This model is created using the specification
of the functionality (e.g. Fastener or Contact) of the
SUT (e.g. STI), which is of interest for development
and testing. The nodes and edges are created in Pat-
hfinder using the Model-preparation-tab. The MBN
for Contacts has 19 nodes and 19 edges (Figure 1-(B)
and (III.)), and Fasteners has 29 nodes and 67 edges
(Figure 3-(a) and (c)).
Model Preparation for Fasteners: Here, we start
with a single state to build a HLM, for which we
use the state of “Holes Auto-found Selected” (H-A-
S). H-A-S corresponds to the state of STI when all
the holes automatically found are selected. The HLM
nodes include all the states that STI can reach from
H-A-S by user interactions. The QAE identifies these
states based on the specifications as well as his/her
experience of using STI. As per the design of STI,
the actions we can perform on the selected holes are,
namely, “Reset Selection,” “Switch to Nut and Bolt,”
“Switch to Auto Fastener,” “Switch to Screw,” “Na-
vigate the Found Holes.” Hence, in the HLM, these
edges are outgoing from the node H-A-S, highlighted
as red edges. These outgoing edges are rendered by
clicking on the corresponding button in the Visibility-
group (Figure 1-(3)). Once the outgoing edges are in
place, we add the nodes at the other end of these ed-
ges, as well as other relevant edges to complete the
model-based network.
Once the MBN is constructed completely, we ge-
nerate test cases by specifying constraints and depen-
dencies on the network. These constraints and depen-
IVAPP 2018 - International Conference on Information Visualization Theory and Applications
296

dencies are characteristic of the functionality being
tested. For Fasteners, we select the constraints on
the start and the end nodes, for test paths, where
“Start” and “Bolts Created” (B-C) are selected, re-
spectively. The start and end nodes are colored green
and red, respectively, (Figure 1-(I) and (II), respecti-
vely). During the model preparation step, we furt-
her specify a dependency based on the type of ho-
les, for which the following conditions exist, namely,
“single” and “aligned” holes, and the selection of
Fastener type, namely, “auto,” “nut and bolt,” and
“screw.” In our example, we use the specific depen-
dency that if the hole is “single,” then Fastener se-
lection cannot be automatic, i.e. “auto.” We select
the dependency type “Set not B if A” in the Model-
preparation-tab (Figure 1-(4)), and further select no-
des, “Bolts Invoked With Single Holes” (B-I-W-S-
H) and “Auto Fastener” as A and B, respectively. The
rendering of the dependency uses two-color combina-
tion to show A and B.
The QAE then assigns node weights, interacti-
vely on Pathfinder GUI, by clicking on the widget for
“Set node weights” in the Model-preparation-tab (Fi-
gure 1-(4)). Here, we set weights for nodes, B-I-W-
S-H and “Bolts Invoked With Aligned Holes” (B-I-
W-A-H), using a higher weight for the latter than the
former, as, in practice in industry, B-I-W-A-H is con-
sidered more important than B-I-W-S-H. Similarly,
the node Parts In Holes Found (P-I-H-F) has higher
importance than the node Parts In Holes Not Found,
and hence, is assigned a higher weight. We use the de-
fault automatic computation of the edge weights du-
ring the test generation step.
Test Generation, Selection and Saving for Fas-
teners: Once the HLM is prepared using the user-
defined MBN, we start generating test cases. In the
Test-generation-tab in the Control-panel, we select
appropriate options for the sampled search of the mo-
del, automatic computation of edge weights, as well
as input values for the user-defined minimum and
maximum NPT, for which we choose 1 and 50, re-
spectively. This action is finalized by clicking on the
“Generate Tests” button (Figure 1- (5)). Selecting
exhaustive search would have led to an explosion in
the number of test cases, which is indicated in the
Console-output (Figure 1 (C-1)). Hence, we keep the
number of test cases more tractable by choosing the
sampled search, which is 5000 in our case, as shown
in message in Console-output.
We decide to apply coverage criteria to further
reduce the number of test cases. Within the co-
verage criteria, we decide to use the option for “fe-
west tests” to ensure the optimal minimum number
of tests, for which we get 8 in edge-coverage and 5
in node-coverage. We set these criteria in widgets
of the Test-selection-tab for Fasteners (Figure 1- (6)).
The amount of node-coverage and edge-coverage can
be visualized using glyphs where filling indicates the
weights, as shown in Figure 2 (see (Left) and (h)).
Here, we opt for edge coverage to get a tractable set
of 8 cases. We sort the paths using length-then-weight
option, and visualize each path using the “test-path”
widgets, which are arrow buttons given both in the
Visibility-group as well as Shortcut-widgets. The ar-
row buttons, which allow the user to go backward and
forward in the sorted list of selected test cases (Fi-
gure 1- (3-b)). The graph of the final outcome of
our selections in the Pathfinder GUI is rendered in the
Display-area (Figure 3- (a)).
Once we complete test selection, we save the tests
by clicking on the “Save tests” option in the “File”
drop-down menu, that outputs a text file in ASCII for-
mat. The highlighted cells, in the Microsoft Excel
file generated from the text file, show the sequence
of actions for executing a test case, as shown in Fi-
gure 3 (see (b)). Thus, we have shown how a QAE
uses Pathfinder to obtain tests using MBT of the Fas-
teners functionality in STI, which has taken (∼ 3 −4)
hours for a QAE. While there is a slight benefit in
terms of total time taken, the true benefit is in using a
deterministic reproducible process by the use of Pat-
hfinder.
Comparing Pathfinder and Manual Test Gene-
ration for Contacts: An experienced QAE generates
47 test cases, which is a mix of high- and low-level
test cases. The time taken to write down all the cases
by considering various documents like specifications
and tickets was 8 hours, of which the time taken for
writing down the test cases under the “Workflow Tes-
ting” header was 4 hours.
On the other hand, the cases generated by Pathfin-
der are based on the paths through which the QAE
should traverse to execute a test case. Each path con-
tains several start states, actions and end states. The
QAE must perform the actions in the sequence and
verify the subsequent end states (after each action).
With the use of Pathfinder, one can get 1798 high-
level test cases for the Contacts functionality, which
is further reduced to 13, based on “the fewest num-
ber of tests” with “edge coverage” criterion. The time
taken for preparing the model in Pathfinder was less
than 6 hrs. The QAE has more control and certainty in
generating the cases and selecting them using Pathfin-
der The total time taken for generating the document
is ∼ 6 hours.
Design Study for Creating Pathfinder: A Visualization Tool for Generating Software Test Plans using Model based Testing
297
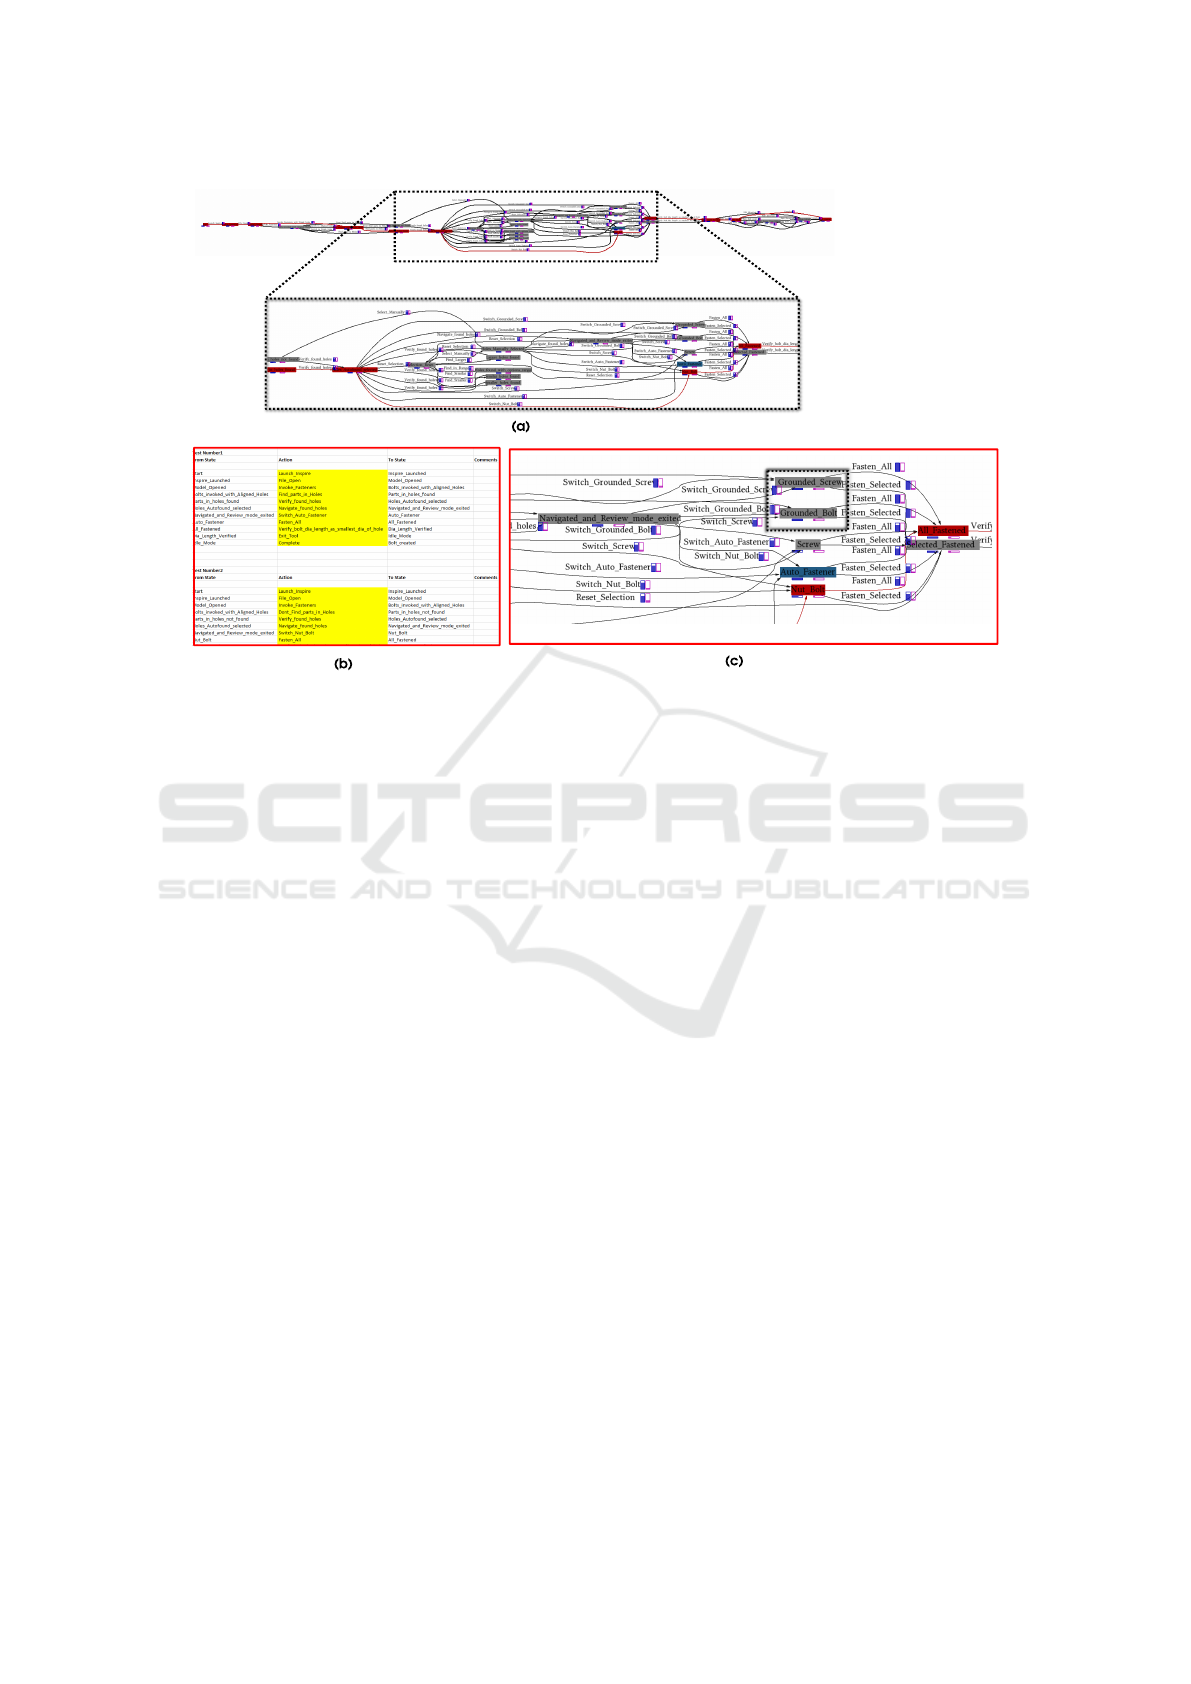
Figure 3: Use of Pathfinder for our case study of Fasteners in solidThinking Inspire
R
: (a) Display of MBN (29 nodes, 67
edges) (b) Microsoft Excel file, which is processed from the ASCII text output file from Pathfinder; and (c) Showing the
flexibility of Pathfinder in adding two nodes on-the-fly to the model-based network of Fasteners, where the two nodes are
new Fastener types, “Grounded Bolts” and “Grounded Screws.” In (a) and (c), gray nodes are generic nodes, the blue glyphs
represent node weights, and magenta glyphs represent node coverages.
5 DISCUSSIONS
We discuss about how Pathfinder has improved the
usability of MBT in a QA team, based on the case-
study discussed in Section 4. This can be considered
as a first step towards an increase in adoption or use of
Pathfinder and MBT by QAEs and other stakeholders.
Here, we also discuss about the limitations of Pathfin-
der. In comparison with the current (traditional) met-
hod of test plan creation and test generation, we have
observed that in our case-study, the method using Pat-
hfinder offers more efficiency in terms of both time
and effort, thus improving the flexibility of usage of
the generated tests and overall productivity of the QA
team.
Efficiency in MBT: The traditional method invol-
ves creating test plan creation for a specific functiona-
lity using Microsoft Excel application, and data entry
of test cases by a QAE, which is not automated. Thus,
there is room for relatively more human error in the
traditional method, compared to our method.
The set of tests, which is obtained through Pat-
hfinder, has been obtained through a rigorous process
of thorough examination of each stage of the MBT
workflow and subsequent decision making. Hence,
the tests are not generated ad-hoc, as is often the case
with the traditional method. Saving the tests from Pat-
hfinder makes these tests usable across a team, and
repeatable, as the workflow for generating these tests
in Pathfinder is definite. Redundancy and duplication
of tests are reduced when using our method; e.g. for
our case study on Fasteners, traditional method gene-
rates 50 tests, whereas using Pathfinder, we are able
to use 8 tests, with the same coverage for end-to-end
scenarios. The preprocessing for the test plan gene-
ration and model preparation in Pathfinder is a one-
time investment, as it opens up several flexible opti-
ons, downstream. e.g. there is flexibility to change
constraints in start and end states in the MBT by re-
assigning the start- and end-nodes in the network in-
teractively on Pathfinder. At the same time, in the tra-
ditional method, the QAE has to re-generate the test
cases from the Excel file, which is not automated, and
hence is inefficient.
Flexibility in MBT: Pathfinder makes test gene-
ration flexible with respect to modifications in five
different aspects. Firstly, in practice, the test plan is
generated in the beginning of the software develop-
ment cycle. As the development matures, changes in
the specifications and implementations are bound to
happen. Pathfinder is flexible in adopting these chan-
ges in the test plan, as the MBN of the HLM can be
modified with minimal user interactions. On the ot-
IVAPP 2018 - International Conference on Information Visualization Theory and Applications
298

her hand, in the traditional method, the test plan has
to be thoroughly scrutinized and modified, and sub-
sequent changes must be done in each test case. The
entire process in the traditional method is not auto-
mated, which makes it inefficient and inflexible to
changes. e.g. in our case-study, two more different
Fasteners, namely “Grounded Bolts” and “Grounded
Screws,” have been added in a later release. When
using Pathfinder, this addition modifies the MBN by
addition of two nodes and relevant incoming and out-
going edges of the nodes. The edited MBN can be
visualized in (Figure 3- (c)). Secondly, Pathfinder re-
quires the QAE to have thorough understanding of
the application or the functionality being tested, du-
ring model preparation unto test generation, howe-
ver, that is not the case for a QAE who has to exe-
cute these tests. This is because the testing methodo-
logy and workflow is re-usable and repeatable using
Pathfinder. This in turn allows different testers to
contribute to the workflow, leading to an overall ef-
ficiency of the QA team. Thirdly, MBT using Pat-
hfinder can also be performed by a program manager
who would be writing the specification of a functi-
onality/product. In this case, the motivation for ge-
nerating test cases is different, as, here the test cases
are used for conveying the use cases and all possible
scenarios of specific functionality/product to the con-
cerned teams like development, QA, documentation
and the application engineers in the field. Fourthly,
since the HLM is constructed at a coarse level, the
HLM is unaffected by changes in the low-level work-
flows, such as change in type of button or user inte-
raction for an action. Fifthly, MBT using Pathfinder
fits well with the flexibility of adding new modules
corresponding to different components and their cor-
responding processes to the functionality. Just like
Fasteners, we can create HLMs for models for diffe-
rent functionalities and flexibly assemble them toget-
her, sometimes, leading to the complete application.
This gives the combinations of cases and interaction
between features at a higher level. The modularity of
the HLM itself makes Pathfinder suitable for testing
components, sub-systems, as well as larger systems.
However, this assembly is currently outside the scope
of this paper. Overall, the flexibility due to Pathfinder
improves productivity of the QA team.
Completeness in MBT: The visualization of the
MBN in Pathfinder allows the QAE to see the various
paths that the software can take starting from a state
of interest. This is not guaranteed in the traditional
method, as there is the danger of the engineer over-
looking a state or action when manually constructing
the test plan. Each Pathfinder test case is a combina-
tion of several test cases of the manual test case do-
cument. With the use of Pathfinder, the sequence of
actions to be performed and their combinations can be
published in the document, unlike in the manual case.
An experienced QAE usually goes through these se-
quences while executing the test cases using his/her
own experience. This implies that the documentation
of the sequences is necessary for a less experienced
QAE to execute the tests. When using Pathfinder, the
document is easier to be followed by other QA team
members since each action, state and the sequence of
actions are documented.
Limitations of Pathfinder: Since Pathfinder is
a novel addition to existing software testing process,
there is no specific standard for the HLM. This leads
to variability in relevance of abstraction of different
parts of the functionality or application. It is assu-
med that there is a consensus in the team on the HLM
definition, before using Pathfinder. However, this as-
sumption is not guaranteed. Even though case-studies
have shown improvement in efficiency and flexibility
of usability of MBT with the use of Pathfinder, this
concept is ridden with resistance of adoption in the
QA team, owing to its novelty. However, this hesi-
tation has been often observed to be misplaced, as
it stems from the fear of automation. Several expe-
rienced QAEs feel that they would be spending lesser
time in manual creation of the test plans than a semi-
automated one, such as Pathfinder, and they would
be equally accurate. However, these statements are
fraught with insufficient data to prove the point. Over-
all, Pathfinder has a steep slope to climb towards lar-
ger adoption in workflow, which is a reality that we
are aware of. Additionally, in the current implemen-
tation of Pathfinder, the QAE cannot make notes in
the test plan while it is being created, which is conve-
nient in the traditional method. The workaround is to
put in the test plan after its creation.
6 CONCLUSIONS
In this paper, we have demonstrated how visualization
can bring about a difference in the adoption of good
practices in software testing of complex applications.
We have motivated the need for adoption of MBT to
automate test generation and selection in a software
QA team, in order to improve the productivity of the
team. We have proposed the use of a HLM of the spe-
cific functionality of a GUI application, which is to
be tested, and a model-based network to represent the
HLM. The model-based network is visually represen-
ted as a node-link diagram which allows the user to
summarize as well as explore the network. Our pro-
posed GUI-based tool, Pathfinder, is built on the net-
Design Study for Creating Pathfinder: A Visualization Tool for Generating Software Test Plans using Model based Testing
299

work visualization along with several intuitive featu-
res. These features are designed to improve the usabi-
lity of the tool, and eventually lead to larger adoption
of MBT in the CAD/CAE industry.
With gradual increase in adoption, it is hoped that
the use of Pathfinder will provide a higher level of
rationale and consistency in the selection of test ca-
ses for GUI-based applications, and thus, reduce the
variability inherent in the perception of multiple tes-
ters. Thinking beyond this, Pathfinder can evolve
to a consistent and clear means of describing soft-
ware application behavior. This usage takes Pathfin-
der significantly upstream in the software design life-
cycle to the stage of application design where actors
such as program managers and developers can incre-
asingly utilize these behavior description models to
improve communication and understanding. Much
care has gone into the design and functionality of
Pathfinder for ensuring that it is comprehensible and
easy-to-use for our community of software testers.
In this respect, more powerful capabilities were re-
jected if they could not be presented with sufficient
ease of use. Notwithstanding that we have demon-
strated its effectiveness for GUI-based applications,
Pathfinder can be extended for test-generation in ot-
her interactive object-oriented software systems. An
immediate improvement to the tool will be the use of
graph-theoretic algorithms to provide default settings
for several options available on Pathfinder. A natural
extension to our tool would be to seamlessly integrate
other processes in a software testing workflow, which
are downstream of test generation, e.g. verification of
software requirements and test execution.
ACKNOWLEDGEMENTS
The work was carried out under a collaboration bet-
ween Altair Engineering and IIIT Bangalore. Authors
are thankful for the help and support of Sucharitha
Deenadayal.
REFERENCES
Apfelbaum, L. and Doyle, J. (1997). Model based testing.
In Software Quality Week Conference, pages 296–300.
Artho, C., Seidl, M., Gros, Q., Choi, E.-H., Kitamura,
T., Mori, A., Ramler, R., and Yamagata, Y. (2015).
Model-based testing of stateful apis with modbat. In
Automated Software Engineering (ASE), 2015 30th
IEEE/ACM International Conference on, pages 858–
863. IEEE.
Belinfante, A. (2010). Jtorx: A tool for on-line model-
driven test derivation and execution. In Internatio-
nal Conference on Tools and Algorithms for the Con-
struction and Analysis of Systems, pages 266–270.
Springer.
Bernard, E., Bouquet, F., Charbonnier, A., Legeard, B.,
Peureux, F., Utting, M., and Torreborre, E. (2006).
Model-based testing from uml models. In GI Jahre-
stagung (2), pages 223–230.
Chinnapongse, V., Lee, I., Sokolsky, O., Wang, S., and Jo-
nes, P. L. (2009). Model-based testing of gui-driven
applications. In IFIP International Workshop on Soft-
ware Technolgies for Embedded and Ubiquitous Sys-
tems, pages 203–214. Springer.
Chow, T. S. (1978). Testing software design modeled by
finite-state machines. IEEE transactions on software
engineering, 4(3):178.
Dias Neto, A. C., Subramanyan, R., Vieira, M., and Tra-
vassos, G. H. (2007). A survey on model-based tes-
ting approaches: a systematic review. In Procee-
dings of the 1st ACM international workshop on Em-
pirical assessment of software engineering langua-
ges and technologies: held in conjunction with the
22nd IEEE/ACM International Conference on Auto-
mated Software Engineering (ASE) 2007, pages 31–
36. ACM.
Dranidis, D., Bratanis, K., and Ipate, F. (2012). Jsxm: A
tool for automated test generation. In International
Conference on Software Engineering and Formal Met-
hods, pages 352–366. Springer.
El-Far, I. K. and Whittaker, J. A. (2001). Model-based soft-
ware testing. Encyclopedia of Software Engineering.
Hartman, A. and Nagin, K. (2004). The agedis tools for
model based testing. ACM SIGSOFT Software Engi-
neering Notes, 29(4):129–132.
Huima, A. (2007). Implementing conformiq qtronic. In
Testing of Software and Communicating Systems, pa-
ges 1–12. Springer.
Karl, K. (2010). Graphwalker. http://graphwalker.github.
io/. Last accessed on July 28, 2017.
Micskei, Z. Model-based testing (mbt).
Munzner, T. (2014). Visualization analysis and design.
CRC press.
Prowell, S. J. (2003). Jumbl: A tool for model-based statis-
tical testing. In System Sciences, 2003. Proceedings of
the 36th Annual Hawaii International Conference on,
pages 9–pp. IEEE.
Sarma, M., Murthy, P., Jell, S., and Ulrich, A. (2010).
Model-based testing in industry: a case study with two
mbt tools. In Proceedings of the 5th Workshop on Au-
tomation of Software Test, pages 87–90. ACM.
Sedlmair, M., Meyer, M., and Munzner, T. (2012). Design
study methodology: Reflections from the trenches and
the stacks. IEEE transactions on visualization and
computer graphics, 18(12):2431–2440.
Utting, M. and Legeard, B. (2010). Practical model-based
testing: a tools approach. Morgan Kaufmann.
Utting, M., Pretschner, A., and Legeard, B. (2012). A taxo-
nomy of model-based testing approaches. Software
Testing, Verification and Reliability, 22(5):297–312.
Ware, C. (2010). Visual thinking: For design. Morgan Kauf-
mann.
IVAPP 2018 - International Conference on Information Visualization Theory and Applications
300
