
Lung Cancer Prognosis System using Data Mining Techniques
Yomna Omar, Abdullah Tasleem, Michel Pasquier and Assim Sagahyroon
American University of Sharjah, Department of Computer Science & Engineering
PO Box 26666, Sharjah, U.A.E.
Keywords: Intelligent Healthcare Tool, Lung Cancer Prognosis, Real-World Data Mining, WEKA.
Abstract: This paper describes a Lung Cancer Prognosis System (LCPS) that aims at providing oncologists with an
accurate estimate of the health status of their patients. The proposed system is born from two observations:
First, lots of efforts are still required in healthcare to improve productivity, accuracy, etc. by providing ad hoc
computer-based solutions; second, while increasing popular, AI and data mining tools cannot be used without
significant training and expertise. LCPS thus aims at providing the former by integrating the latter into a user-
friendly tool, supplementing the knowledge of the expert oncologist with information about their patients, and
leading to improved patient care and treatments. LCPS can accept a variety of lung cancer datasets and
employs several data mining algorithms to uncover relationships between observed health signs and probable
outcomes, and provides oncologists with various statistical results including predictions about their patients’
medical future. Furthermore, LCPS makes it easy to manage patients’ records, allows them view their profiles
and any information as deemed suitable by their doctor, including prognosis and other comments. Lastly,
while the current application is currently limited to lung cancer treatment, it can be considered a prototype
that can be adapted to other diseases.
1 INTRODUCTION
According to scientific experts, cancer remains one of
the leading causes of death in adults and the “number
one disease killer of children”, and half of them are
preventable (American Cancer Society, 2017). Lung
cancer has the highest rate of deaths, despite the fact
that its prevention and treatment in its early stages is
simple and hassle-free. The problem is that early
symptoms are often mistaken for cough or flu, thus
making early-stage lung cancer difficult to diagnose.
Since the initial symptoms of lung cancers can take
years to develop, most patients discover their illness
at an advanced stage where cancer cells are
widespread, making it much harder to cure (American
Cancer Society, 2016). Lung cancer is also one of the
top five fatal diseases in the UAE (Khaleej Times,
2016) and, according to Dr. Ali Al Dameh, Oncology
Consultant from Tawam John Hopkins Hospital, “the
disease is in dire need of being addressed with a solid
plan of action” (WAM, 2015). That goal includes the
two main types of lung cancer i.e., non-small cell lung
cancer and small cell lung cancer.
In order to decrease preventable cases of cancer-
related deaths and improve the overall health system,
a more versatile and powerful technology is needed.
Precisely AI and data mining techniques can process
health data to better forecast people’s future health
conditions and potential risks. But advanced AI tools
cannot be used without significant training and
expertise, which medical practitioners do not possess.
Therefore, we developed a prototype of a Lung
Cancer Prognosis System (LCPS) that aims at making
those techniques accessible in a user-friendly manner
in order to augment the knowledge of the expert
oncologist and improve patient care and treatments.
The proposed system is trained beforehand on a
hospital dataset characteristic of the target population
and can subsequently provide better information and
prognosis specific to each lung cancer patient based
on their vital health signs and test results. LCPS
employs several statistical and data mining tools and
presents their results in a visual, intuitive manner, for
the benefit of both the physicians and their patients.
2 EXISTING SOLUTIONS
GenieMD combines IBM’s Watson with research
from Harvard Medical School to provide users with
accurate self-triage. It records medical history and
can connect to sensors for real-time vitals tracking
Omar, Y., Tasleem, A., Pasquier, M. and Sagahyroon, A.
Lung Cancer Prognosis System using Data Mining Techniques.
DOI: 10.5220/0006553703610368
In Proceedings of the 11th International Joint Conference on Biomedical Engineering Systems and Technologies (BIOSTEC 2018) - Volume 5: HEALTHINF, pages 361-368
ISBN: 978-989-758-281-3
Copyright © 2018 by SCITEPRESS – Science and Technology Publications, Lda. All rights reserved
361

(HMW, 2013), but cannot upload other datasets.
WebMD allows users to search through a medical
database to read articles, learn about diagnosis, and
contact medical doctors (WebMD, 2017). However,
this service does not process actual patient data.
Sehhaty is an app that allows Dubai residents to view
their records at the Dubai Health Authority, including
prescriptions, appointments, test results, medical
advice, and so on (Khaleej Times, 2014). Similarly,
My Medical allows users to create a record of their
medical history, enter vital sign readings from health
trackers, and send the data to a doctor. While tailored
for the UAE, these apps do not provide any kind of
diagnosis or prognosis tools.
Lungscreen uses a short lifestyle questionnaire to
assess whether the person has lung cancer symptoms
or not (Mesko, 2015), and gives a prediction for the
next 10-20 years. There is no clear way to assess
prediction accuracy, and it does not use actual patient
data. The Lung Cancer Foundation App is a mobile
application that helps with the self-diagnosis of lung
cancer and provides educational videos and
information (OFWW, 2011). Finally, Cancer Spotter
aims to encourage earlier diagnosis by getting people
to learn and understand the symptoms of cancer, and
to seek help from a doctor as soon as possible (Park,
2001). While it is simple and promotes cancer
awareness, it relies on self-assessment and has no
diagnosis or prognosis.
In sum, most available tools provide lung-cancer
related information and some allow self-assessment,
but very few offer any form of medically validated,
automated diagnosis or prognosis, based on actual
lung cancer data and the patient’s vital signs, let alone
tailored to a specific country or population.
3 PROPOSED SOLUTION: LCPS
Based on the above assessment, we have developed a
software system to provide users with a consistent
and accurate health diagnosis at low cost, therefore
facilitating the prognosis of fatal lung cancer. We
plan to make use of large databases of lung cancer
patients from hospitals all around the world and apply
AI and data mining tools to derive from these datasets
diagnosis and prognosis models that can be
subsequently applied to new patients. Another goal is
to integrate all computational techniques and
automate the process as much as possible to offer a
tool that is user-friendly for both doctors and their
patients. Initially, our system was designed to use a
patient database from the Tawam Hospital in UAE,
then it was extended to handle other datasets. In this
paper, the use cases and results presented employ
lung cancer datasets publicly available on the Web.
LCPS is a web-based app that uses JSF for
functionality and HTML/CSS for webpages and UI.
This first version integrates three machine learning
algorithms from WEKA. It provides oncologists and
patients with different access rights. Patients can view
their data, health predictions, and comments from the
oncologist. Doctors manage patients, can run various
tests on the dataset and new patients data. The LCPS
prototype described in this paper provides doctors
with a number of public datasets for demonstration
and training purposes: one is used to predict patient
life expectancy, another to predict whether or not the
patient has a cancer gene. LCPS allows doctors to
load and edit datasets and patient records, to view
statistical indicators, and to apply various algorithms
on patient data. It automatically analyses a dataset to
determine the the most suitable machine learning
algorithm and presents the results to the physician
through many tables and plots.
4 TECHNICAL APPROACH
LCPS is a 3-tiered web application, with a back-end
SQL database, an application layer, and a front-end
user interface. LCPS will make use of several data
mining and machine learning algorithms that have
been trained with patient data to reach conclusions
about the patient’s health within a certain level of
accuracy. LCPS can also use other datasets to allow
flexibility in predicting several lung cancer markers.
By creating several XHTML pages that are styled
by Cascading Style Sheets (CSS), the web app’s main
functions lie in JSF code with baking beans to
implement UI elements, display options, and access
the database. Pages that contain graphs use the
Google Charts API via embedded JavaScript code,
more specifically jQuery. The app’s database access
mainly occurs in baking beans using SQL statements
to insert, update, and delete data. WEKA offers
multiple ways to integrate their machine learning
algorithms using Java. For our purposes, we initially
focused on three algorithms: J48 decision tree, Naïve
Bayes (NB), and K-Nearest Neighbor (KNN). Further
algorithms will be added later on.
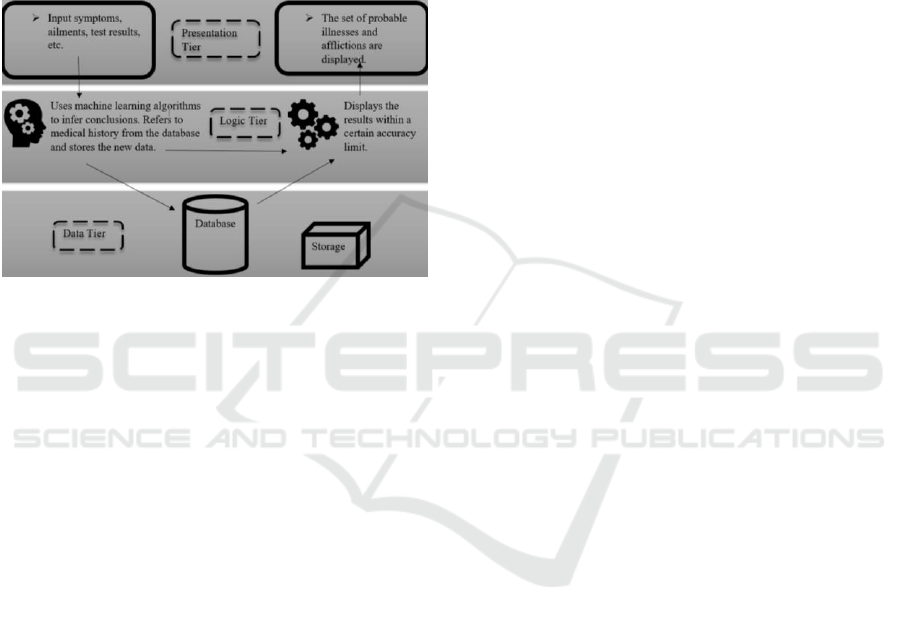
5 SYSTEM ARCHITECTURE
LCPS architecture consists of three layers for
presentation, application, and data. This helps
HEALTHINF 2018 - 11th International Conference on Health Informatics
362
developers accommodate future expansions such as
different subcomponents in the data layer (Oracle
database, MySQL, Firebase) or even in the
presentation layer (Java GUI, C# GUI, Python GUI).
Importantly, it minimizes dependencies between
components, enhances security (as the user has no
direct access to the database) and promotes scalability
which is a key aspect in a cloud deployed app. Lastly,
it allows the three tiers to be coded and tested in
parallel, and therefore reduces development and
maintenance costs over the long term.
Figure 1: LCPS system multi-layered architecture.
The presentation layer consists of either command
line or GUI, which are used to get user inputs and
provide information and feedback. The presentation
layer consists of a web based interface programmed
using HTML and CSS. The application layer consists
of the decision logic i.e., the preprocessing and
machine learning algorithms from WEKA that will
mine the dataset selected by the oncologist and
evaluate new patient data accordingly. The
application uses the SQL database on Apache Derby
to store its data. The tables and schema can be
managed via the interface, or programmatically. The
node architecture can be displayed through the use of
a deployment diagram, which captures the system
hardware’s topology. Each layer is deployed within a
different hardware component and the presentation
layer is mainly deployed via the web interface.
Since one distinguishing feature of LCPS is to
provide automated data analysis and prognosis, the
choice of data mining component has been subject to
extensive study (Witten, 2016). Moreover, the need
to offer a user-friendly tool that hides technical
complexity and presents results in an intuitive, visual
manner, means favoring models based on rules or
decision trees for instance, and providing adequate
visualizations via tables and plots. As such many
algorithms are available, as well as several data
mining platforms, that we experimented with.
6 DATA MINING TOOLS
We started with KEEL (Knowledge Extraction based
on Evolutionary Learning), an open source data
mining framework that is increasingly being used in
healthcare. KEEL includes many algorithms for
regression, classification, clustering, and more. It
allows creating experiments using multiple datasets
and algorithms, independently scripted from the user
interface. However, we didn’t find the UI user-
friendly enough, and KEEL lacks good visualization
techniques (Rangra, 2014).
KNIME (Konstanz Information Miner) is
another open source tool based on data analytics,
reporting and integrating platform, and has been used
extensively in pharmaceutical research. It has a
modular design and offers interactive execution and
data pipelines. It covers all major areas of data
analysis but has limited error measurement methods
and does not support techniques such as wrapper
methods for descriptor selection (Rangra, 2014).
Eventually we selected the open source WEKA
framework, which has all the desired data processing
and machine learning algorithms and is widely used
for research and development. It has a great user
interface and provides excellent visualization tools to
help understand the models (Witten, 2016).
7 SYSTEM FUNCTIONALITY
The user interface was initially modeled using Adobe
Dreamweaver through the use of HTML and CSS.
Once tested and approved by users, the design was
transferred to the development environment, where
core functions were added in. LCPS employs several
web interface mechanisms, as depicted in the figures
hereafter, to enhance usability.
Upon login and redirection to their home page, an
oncologist can view all his/her respective patients,
further analyze their medical profile, add comments,
deciding for each whether it should be visible to the
patient or not. The oncologist can also compare the
patient’s health data against a preloaded dataset or
one of his/her choosing. The doctor can also edit
existing datasets and view previous versions. When
the physician compares his/her patient’s data against
a chosen dataset using selected algorithms, he/she
will be provided with a prediction of the patient’s
health status. The physician can also compare results
from different algorithms in order to gain a better
understanding of the data and the various models.
When a cancer patient logs into LCPS, he/she is
redirected to his/her main page where he/she can view
Lung Cancer Prognosis System using Data Mining Techniques
363
Figure 2: Sample LCPS information page.
all the tests conducted on him/her by his/her
respective oncologist. The patient can also view any
comments left by the physician on his/her health
status, as well as data plots and results as included.
8 DATA MINING ALGORITHMS
WEKA features hundreds of algorithms for data
processing, feature selection, clustering, finding
association rules, classification, etc. (Witten, 2016).
LCPS integrates selected methods for removing
outliers and irrelevant features, and predicting the
patients’ health status using classification rules,
decision trees, instance based learning, probabilistic
approach, and later regression trees. Since choosing
the “best” predictive algorithm for a given dataset
requires a lot of computations, automation is needed.
This in turns requires making assumptions, which is
another reason why the current system supports
databases for lung cancer only.
Including decision trees in LCPS was an obvious
choice, and currently the J48 algorithm is used
(Witten, 2016). The decision tree generated shows the
most relevant input variables for prediction, that are
determined using information gain. As an illustrative
example, we chose a dataset obtained by Harvard
University (Zhu, 2007), that contains 189 instances
with all numeric values except for the class attribute
(ADEN, SQUA, COID, SCLS, NORMAL). It
includes different specimens of lung cancer using
various gene selection tests and classified as tumors.
Accuracy results and Confusion Matrix are shown
and explained to the doctor. The latter table further
describes the performance of the classification model.
In this example, the user is told that 131 out of the 189
instances were correctly classified as
adenocarcinoma (ADEN), 18 as squamous cell lung
Figure 3: Classifier output of WEKA’s J4.8 algorithm.
carcinomas (SQUA), 20 as pulmonary carcinoids
(COID), 4 as small-cell lung carcinomas (SCLC) and
that 16 instances were normal lung patients. Other
values outside the diagonal show exactly how some
instances were incorrectly classified. The data can be
examined by the oncologist, if desired, to try and
analyze the cause of the error, which could be due to
some data entry mistake, some noise in
measurements, or simply some borderline case that
was too difficult for the classifier to figure out.
Furthermore, the Detailed Accuracy by Class shows
that the TP rate of true positives (correctly classified
instances) has a high average of 0.931 while the FP
rate of false positives (falsely classified instances)
had a very low average of 0.058. Such results are
pointed out to the doctor so he/she can appreciate
diagnosis or prognosis accuracy, possibly examine
the data to further his/her understanding. In this
example, J48 achieved a 93% accuracy and new
patients can be evaluated with high confidence. The
decision tree in Fig. 4 is shown to the doctor.
Another popular classifier is Naïve Bayes (NB),
which realizes probabilistic inference based on
assumptions of conditional independence between
predictors (Witten, 2016). One of the reasons we
chose to include it is that, despite its simplicity, it
often outperforms more sophisticated classifiers.
Another is that it can be easily explained to the doctor.
Naïve Bayes is essentially a quick method for
composition of statistical predictive models, that
analyses the subjection between attribute values and
classes to derive a conditional probability. Ranking
HEALTHINF 2018 - 11th International Conference on Health Informatics
364
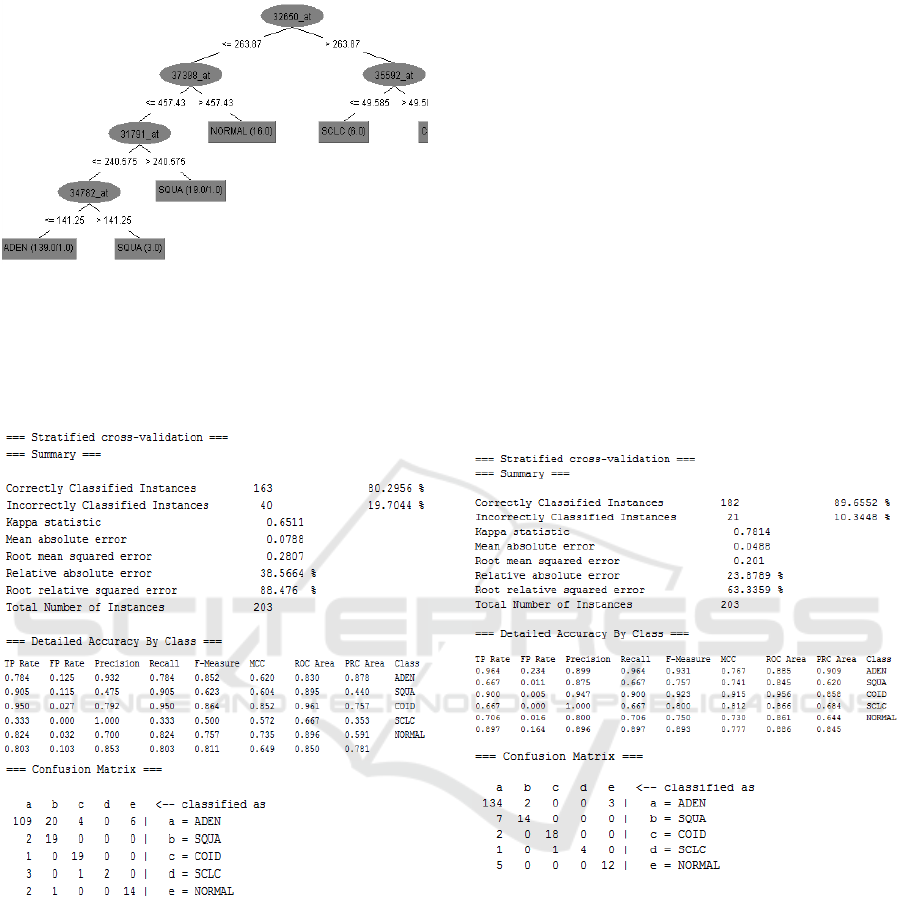
Figure 4: Generated decision tree for the J4.8 algorithm.
class probabilities then gives an indication of which
result is most likely. Using the same lung cancer
dataset, we can observe a loss in the TP rate and a
gain in the FP rate as shown in Fig. 5.
Figure 5: Classifier output of Naïve Bayes algorithm.
Instance-based learning is a form of lazy learning
where the model memorizes data instances and
classification relies on measuring proximity (Witten,
2016). To address the issue of noisy data, it is
recommended to examine multiple nearest neighbors,
hence LCPS integrates the classic K-Nearest
Neighbor algorithm. Results using the same lung
cancer dataset are shown in Fig. 6 for the case of a
single neighbor (K=1). However, LCPS will
automatically try different values of K and retain the
optimal one. Explanations are given to the oncologist
who wishes to understand the significance of the
results. For instance, if the number of correctly
classified instances increases with K, it means that the
dataset is noisy, which in turn may require
examination. In this case results show that the dataset
is noise-free.
LCPS can display only the best results (achieved by
the best algorithm), or show all results, as well as a
detailed comparison, in tabular format. In this case, it
happens that J48 performs best on the sample lung
cancer dataset. There might be various reasons for
this, such as for instance, the fact that irrelevant gene
predictors have been pruned out, or because it can
process both nominal and numerical attributes better
than Naïve Bayes and KNN, or because decision trees
handle missing values well. It is important to note that
there is no classification algorithm that can perform
best for all available datasets. Hence LCPS will apply
all selected methods and build models anew for each
dataset.
Figure 6: Classifier output of the KNN algorithm (K=1).
9 DATASETS AND RESULTS
Since LCPS can handle generic lung cancer datasets,
we chose two databases available online for testing
and illustration purposes. The Genes database used to
predict lung cancer tumors based on the patient’s
genes was cleaned and used at Harvard University,
hence we knew it was mostly error free and would
give reliable results, making for a good tutorial. The
database consists of 12600 attributes and 203
instances, all numerical values except for the class. In
2001, lung carcinoma was the leading cause of cancer
Lung Cancer Prognosis System using Data Mining Techniques
365
death hence this dataset was created and exploited to
define distinct subclasses of lung adenocarcinoma
(Bhattacharjee, 2001). The dataset can be used by
doctors so long as they have a gene expression
profile, and LCPS will determine if the patient has the
genes to develop either cancer type.
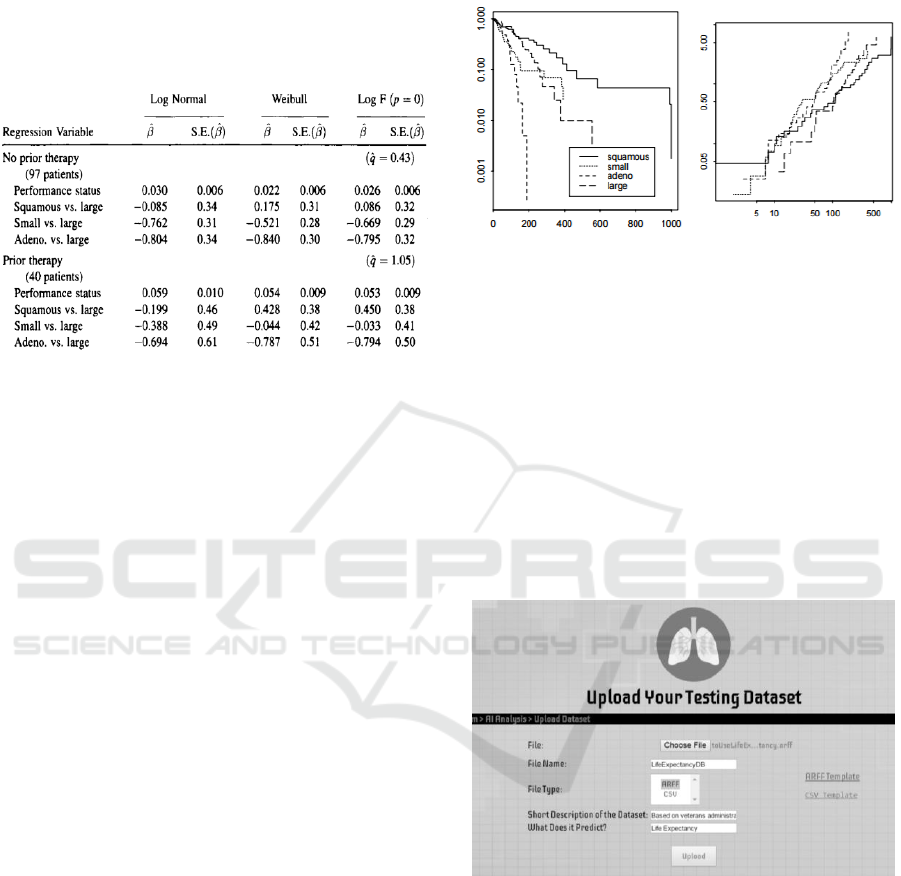
Figure 7: Analysis of Veterans Admin. Lung Cancer Data
using a generalized F-regression Model (Venables, 2002).
The second dataset included for testing is the
Veteran’s Administration Lung Cancer Trial dataset
used by Venables and Ripley in 2002 to predict the
life expectancy of a patient with specific lung cancer
tumors (Venables, 2002). It was created using
questionnaires from doctors and patients. Initially, a
Generalized F-regression model was used to analyze
it, as per Fig. 7. Data collection and comparison of
statistical models was first done manually, then the
Cox model was applied to establish the baseline
hazards, as the dataset had several covariates.
The dataset obtained needed cleaning prior use:
outliers were removed and nonsensical or missing
values were replaced with mean values, irrelevant
attributes were discarded. In the end the dataset had
seven attributes: Treatment (standard or test), Age (in
years), Karnofsky Score (0-100), Time since
diagnosis (in months); Cell type (one of four types);
Prior therapy; Survival time (in days, later discretized
into 3 bins). The Karnofsky score is one of the
methods used to quantify a patient’s general health
and physical activities, ranging from 0 (dead) to 100
(perfect health). Results are illustrated in the
screenshots of the LCPS user interface hereafter.
Figure 8: Cumulative hazard functions for the cell types;
left graph is labelled by survival probability on log scale
and right graph is on log-log scale (Venables, 2002).
As mentioned the decision logic layer of our
system heavily relies on WEKA and its excellent Java
API, which offers many classes and methods,
specifically: to store all data instances, to preprocess
the data (discretize, sparse to non-sparse, and attribute
selection), to predict the class outcome (J48, Naïve
Bayes, KNN), to evaluate accuracy (statistical results,
TP/FP, ROC). To integrate WEKA in our system we
had to use beans to get information from our XHTML
pages and process the data using the provided
libraries.
Figure 9: LCPS dataset upload page.
Once logged in, a doctor can select a patient and
go to the Analysis page where he/she can upload any
lung cancer related dataset to the system, as depicted
in Fig. 9. Since a consistent, generic dataset format is
required, the doctor is able to view and download the
data template. Converters are available as well that
help with the formatting. Next, the doctor can view
all uploaded datasets, run data mining tools as
desired, examine results via tables, plots, and related
explanations. If technically inclined, the doctor can
customize a number of filters. While discretization
HEALTHINF 2018 - 11th International Conference on Health Informatics
366
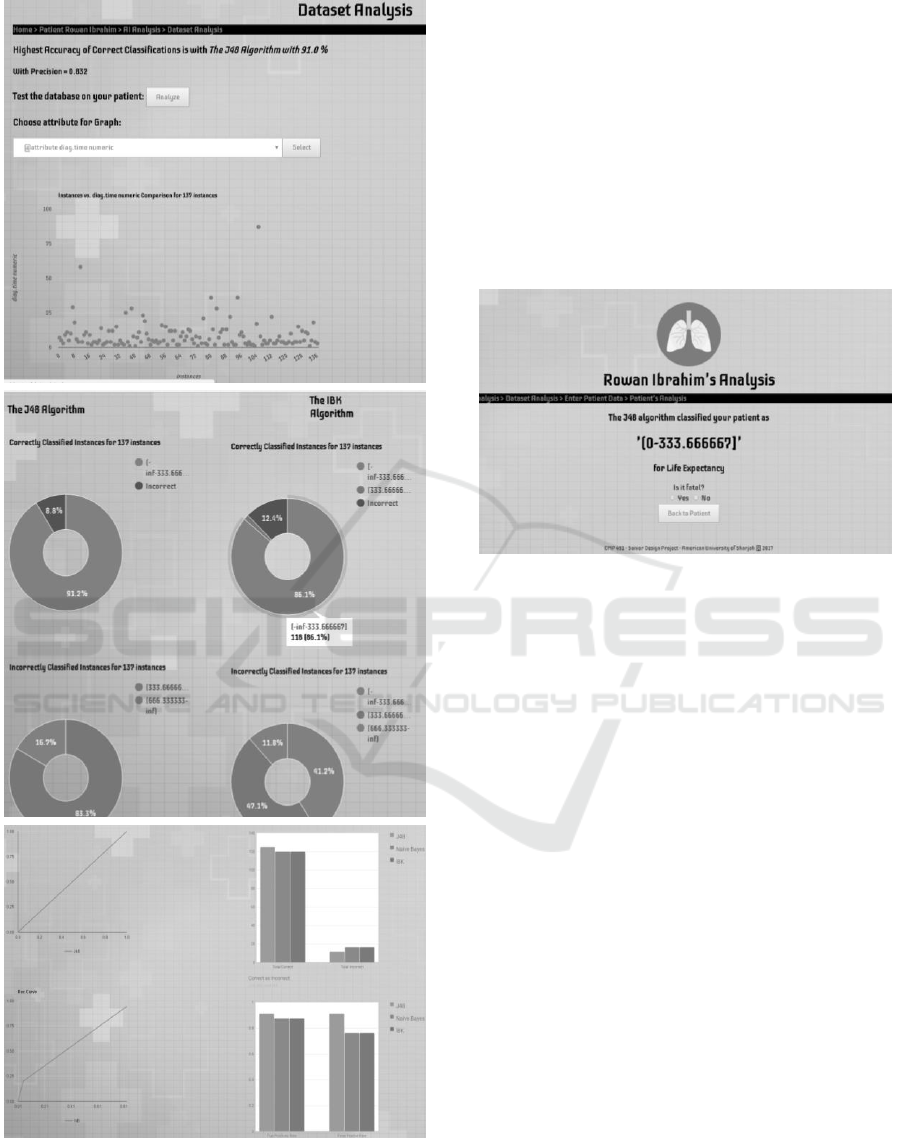
Figure 10: Sample LCPS analysis screens.
happens automatically if needed, one can specify
which method and how many bins to use. As for
attribute selection, PCA is automatically be applied
but one can select other methods or even manually
specify which attributes to use for classification and
which to discard e.g., based on expert knowledge.
From this page, the doctor can modify the
database or view statistical information about the
dataset, as depicted in the sample screens of Fig. 10.
First, the analysis page shows the accuracy of correct
classifications using the highest scoring algorithm.
LCPS can also display statistics about how the
algorithms perform and how they differ in their
analysis and predictive model.
Figure 11: Sample Patient’s Prediction Page.
Next is shown a table listing the various correctly
and incorrectly classified instances in separate
classes. Next, the ROC curves and bar charts show
the true positives (TP) and false positives (FP) and
total of correct and incorrect values. Moreover, after
examining these graphs and results, the doctor can
still select any available algorithm, examine results in
further details, play “what if” scenarios by changing
some data and applying the algorithm anew. We aim
to implement automated explanatory mechanism later
on. Lastly, Fig. 11 shows the prediction page for a
fictitious patient using the life expectancy dataset. In
this case, the result reported is a bracket of 0–333
days to live. This can be regarded by the doctor as
fatal, and will be added to the patient’s record for later
use. The oncologist can always inspect the result and
calculation details.
LCPS heavily uses three types of visual tools to
help oncologists understand and appreciate the
generated results. Scatter plots as especially useful to
help identify anomalies in the dataset, which the
doctor can then decide to edit manually, or to show
how attribute values are distributed so the doctor can
determine if a patient profile is typical or not. Pie
charts show how many instances are correctly
classified in each class along with the total incorrectly
classified overall. Others show incorrect
classifications in each class. Pie charts are separate
Lung Cancer Prognosis System using Data Mining Techniques
367

for each predictive algorithm and can be used for
direct comparison as well. If the doctor wishes to see
if a patient falls into a specific class, he can examine
the details of each algorithm and the result values.
Line charts are also used often. For example, the
TP vs. FP rate line graph shows the ROC area which
can be used to identify visually how accurate each
prediction is. Explanations are given as well: in this
case, the more convex the ROC curve the better,
whereas a straight line would denote a random (hence
useless) classifier. The ROC curves are shown
separately for each algorithm, so that the doctor can
easily see how each algorithm performs. Lastly,
Column charts are best used to depict and compare
visually results such all the different TP and FP rate
for each algorithm and the overall correct and
incorrect classifications.
10 CONCLUSIONS
As mentioned earlier, cancer is one of the leading
causes of death in the UAE. In the emirate of Abu
Dhabi alone, 1,729 new cases were detected in 2012,
with 28 per cent among Emiratis and 72 per cent
among expatriate residents. This made cancer the
third leading cause of death in Abu Dhabi, accounting
for 13%of all fatalities (HAAD, 2016). This death toll
will keep on increasing if we do not devise a method
to find cancer at an early, curable stage. The UAE has
recently launched an initiative to cut down the
number cancer cases by 18% by 2021 (HAAD, 2016),
hence we hope that a system such as LCPS will be a
highly contributing factor.
The early detection of any type of cancer is of
paramount importance to pave the way for successful
cancer treatment. Unfortunately, most cancers are
only detected once they reach an advanced and
incurable stage. Individuals who are victims of many
types of cancer do not know about it until it’s too late.
Many people do not even go to the doctor to get
themselves checked for several reasons which can
include, affordability, fear, travelling cost or even
time. Everyone is so absorbed in their work that they
disregard the possibility of having cancer, even after
the symptoms start to manifest. Hence, this was one
of the driving factors for us to make such an
application. To be able to measure how much of a
societal impact it can have we need to evaluate its
impact on both general users and doctors. Therefore,
by focusing on just UAE-based users, our proposed
application is predicted to have a significant impact
on the country as a whole. By focusing on the patient-
specific aspect of LCPS, it becomes more apparent
why having a tailored prediction, that is specific to the
patient’s health, is important. It gives the oncologist
and patient room to forecast and define a targeted
treatment process, helping in better patient care and
improving the patient’s chances of survival and
remission. Thus, having such a system will decrease
lung cancer death cases significantly, especially since
there are no similar systems in the market.
REFERENCES
American Cancer Society, 2017. "Cancer Facts and Figures
2017". Atlanta, Ga: American Cancer Society.
American Cancer Society, 2016. "Lung Cancer Prevention
and Early Detection", Atlanta, Ga: American Cancer
Society.
Khaleej Times, 2016. "Lung Cancer Among Top 5 Fatal
Diseases in UAE", Khaleej Times, UAE.
WAM, 2015. "Tawam Hospital Now Offers Lung Cancer
Screening, a First for the UAE", WAM Emirates News.
HAAD, 2016. "What is Lung Cancer?", Health Authority
Abu Dhabi, UAE. [online: https://www.haad.ae/]
HMW, 2013. "GenieMD Announces First Place Finish in
ONC Blue Button Co-Design Challenge," Health &
Medicine Week, p. 476.
WebMD, 2017. "Datamonitor", WebMD Corporation.
Khaleej Times, 2014. "DHA to launch patient-centric app
Sehhaty at Gitex," Khaleej Times, UAE.
Mesko, B., 2015. "The Lungscreen App: Find out your
risk," ScienceRoll.
OFWW, 2011. "Lung Cancer; New Lung Cancer Findings
from University of Toronto Described," Obesity,
Fitness & Wellness Week, p. 846.
Park, A., 2001. "Cancer spotter," Time, vol. 158, no. 7.
Witten, I., Frank, E., 2016. Data Mining: Practical
Machine Learning Tool and Techniques, Amsterdam:
Morgan Kaufman.
Rangra, K., Bansal, D., 2014. "Comparative Study of Data
Mining Tools", International Journal of Advanced
Research in Computer Science and Software
Engineering, vol. 4, no. 6.
Zhu, Z., Ong, Y., 2007. "Markov Blanket-Embedded
Genetic Algorithm for Gene Selection", Pattern
Recognition, vol. 49, no. 11, pp. 3236-3248.
Bhattacharjee, A., 2001. "Classification of Human Lung
Carcinomas by Mrna Expression Profiling Reveals
Distinct Adenocarcinoma Subclasses", Proceedings of
the National Academy of Sciences, 98(24), 13790-
13795.
Venables, W., Ripley, B., 2012. Modern Applied Statistics
with S, 4th ed. New York: Springer.
HEALTHINF 2018 - 11th International Conference on Health Informatics
368
