
Ship Detection in Harbour Surveillance
based on Large-Scale Data and CNNs
Matthijs H. Zwemer
1,2
, Rob G. J. Wijnhoven
2
and Peter H. N. de With
1
1
Department of Electrical Engineering, Eindhoven University of Technology, Eindhoven, The Netherlands
2
ViNotion B.V., Eindhoven, The Netherlands
Keywords:
Object Detection, Harbour Surveillance, CNN, SSD Detector, Ships, Vessel Tracking System.
Abstract:
This paper aims at developing a real-time vessel detection and tracking system using surveillance cameras in
harbours with the purpose to improve the current Vessel Tracking Systems (VTS) performance. To this end, we
introduce a novel maritime dataset, containing 70,513 ships in 48,966 images, covering 10 camera viewpoints
indicating real-life ship traffic situations. For detection, a Convolutional Neural Network (CNN) detector is
trained, based on the Single Shot Detector (SSD) from literature. This detector is modified and enhanced to
support the detection of extreme variations of ship sizes and aspect ratios. The modified SSD detector offers
a high detection performance, which is based on explicitly exploiting the aspect-ratio characteristics of the
dataset. The performance of the original SSD detector trained on generic object detection datasets (including
ships) is significantly lower, showing the added value of a novel surveillance dataset for ships. Due to the
robust performance of over 90% detection, the system is able to accurately detect all types of vessels. Hence,
the system is considered a suitable complement to conventional radar detection, leading to a better operational
picture for the harbour authorities.
1 INTRODUCTION
Maritime traffic management systems in harbours
commonly use radar technology and Automatic Iden-
tification System (AIS) information to detect and fol-
low moving vessels in a Vessel Tracking System
(VTS). Video cameras are mainly used for visual ve-
rification by the traffic management operators and not
for automatic detection and tracking of vessels.
Radar systems measure the reflections of actively
transmitted radio waves while continuously scanning
the area by rotating 360 degrees. Although radar
technology provides accurate detection results, inter-
ference in the radar signal from clutter causes false
detections. Especially in harbours, the environment
contains other objects such as buildings, bridges, cra-
nes, etc. In these areas, the operators often use the vi-
sual information of cameras to support the monitoring
process and to verify radar detections. Each (large)
ship actively broadcasts its location and identity using
Automatic Identification System (AIS) messages. A
simple radio receiver is required to observe all ships
in a few kilometers range. However, data validity
depends on the cooperation of the captain. Non-
transmitting ships remain unseen by the AIS system.
This work is part of the European Advancing Plug
& Play Smart Surveillance (APPS) project
1
, which
aims to enable smart surveillance made by multi-
sensor systems (radar, visual, thermal, acoustic and
physicochemical). All information of these sensor-
systems are fused to reduce or alleviate shortcomings
of each individual sensor. We propose to use surveil-
lance cameras for visual localization of ships to ad-
dress those shortcomings of the AIS and radar sys-
tems.
Ship detection using surveillance cameras is at-
tractive due to its low cost and the ease of installa-
tion and maintenance. Cameras are nowadays abun-
dantly available in harbour areas to visually support
traffic management operators. Detection of vessels
in video images is a challenging task due to the high
intra-class variance. Examples of intra-class variance
are the type of the ship (e.g. cruise ships, sailing
ships, cargo ships and speedboats) and the different
viewpoints. Additionally, the highly dynamic water
regions prevent the use of conventional background
subtraction techniques. To develop a reliable image-
based ship detection and recognition system, a large
1
APPS Project page: https://itea3.org/project/apps.html
Zwemer, M., Wijnhoven, R. and With, P.
Ship Detection in Harbour Surveillance based on Large-Scale Data and CNNs.
DOI: 10.5220/0006541501530160
In Proceedings of the 13th International Joint Conference on Computer Vision, Imaging and Computer Graphics Theory and Applications (VISIGRAPP 2018) - Volume 5: VISAPP, pages
153-160
ISBN: 978-989-758-290-5
Copyright © 2018 by SCITEPRESS – Science and Technology Publications, Lda. All rights reserved
153

and realistic database of ship images is required to
support learning of various ship types and obtaining
a high robustness that completes the supplementary
role to the existing radar systems.
In this paper we propose a visual-based detection
algorithm to be used in a VTS. We specifically focus
on two aspects: the video-based vessel detection al-
gorithm using Convolutional Neural Networks (CNN)
and the creation of a large image dataset used to train
this algorithm. We evaluate the performance of the
detection system and provide insight in our dataset
containing vessels in surveillance scenarios.
This paper is divided as follows. Section 2 pre-
sents related work, Section 3 outlines the visual lo-
calization system with detection, tracking and global
position conversion. Section 4 discusses the constitu-
tion of the dataset while Section 5 presents the expe-
riments. Section 6 and 7 conclude the paper.
2 RELATED WORK
Vessel detection techniques can be categorized into
background modelling and appearance-based met-
hods. In background modelling, a background of the
scene is learned over time and used to detect fore-
ground objects (Arshad et al., 2010; Hu et al., 2011).
Morphological operations on the foreground objects
are applied to remove waves around the vessel detecti-
ons. Background modelling techniques only work for
fixed camera viewpoints or need time to reinitialize
the background model. Related to background mo-
delling, context modelling (Bao et al., 2013) can be
used to get a segmentation map consisting of water,
vegetation and ‘other objects’. Ships are detected by
motion analysis of the ’other object’ class which lie in
the water region. Static ships are not detected because
of the lack of motion.
Appearance-based methods try to model the ves-
sels appearance. Wijnhoven et al. propose to use His-
togram of Oriented Gradient (HOG) features to detect
vessels with a sliding-window approach (Wijnhoven
et al., 2010). Because the aspect ratio of the detector
is fixed, they detect the cabin region of the ship and
fail to detect the full extend of the ship.
In the generic field of visual object detection,
state-of-the-art performance is obtained by Convoluti-
onal Neural Networks (CNNs). These networks origi-
nate from image classification and have recently been
extended to the localization task. Initially, a separate
region proposal algorithm (Uijlings et al., 2013) finds
regions of interest in the image and a subsequent CNN
classifies these regions into object/background (Girs-
hick et al., 2014). This has evolved to a single
CNN integrating region proposals, classification and
bounding-box regression (Girshick, 2015). Other ob-
ject detection systems skip the region proposal step
altogether and estimate bounding boxes directly from
the input image. YOLO (Redmon et al., 2015) uses
the topmost feature map to predict bounding boxes di-
rectly for for each cell in a fixed grid. The Single Shot
MultiBox Detector (SSD) (Liu et al., 2016) extends
this concept by using multiple default bounding boxes
with various aspect ratios at different scaled versions
of the topmost feature map. The SSD detector is more
robust to large variations in object size.
Although the state-of-the-art object detection met-
hods achieve high detection performance, a large and
realistic training dataset is required to cover all ship
variations and viewpoints. Note that various public
datasets exist such as PASCAL VOC (Everingham
et al., 2007; Everingham et al., 2012), Microsoft
COCO (Lin et al., 2014) and ImageNet (Russakovsky
et al., 2015), but they are not suitable for our task be-
cause of their limited dataset size and are unrealistic
for surveillance.
We propose to use the state-of-the-art SSD (Liu
et al., 2016) network because of the relatively low
computational requirements and high accuracy. A
suitable ship dataset for training is not available. The-
refore, we introduce a novel dataset containing a
broad variation of ship types, viewpoints and weather
conditions, to support robust detection.
3 PROPOSED VISUAL
LOCALIZATION SYSTEM
We propose to improve the localization accuracy of
a Vessel Tracking System (VTS), using a vessel de-
tection and tracking system based on surveillance ca-
meras. Our system uses camera images as input and
provides GPS coordinates of vessels to the VTS sy-
stem. Localization is performed by subsequently per-
forming object detection and tracking in image coor-
dinates. The obtained vessel locations are then con-
verted to GPS coordinates using camera calibration.
The object detector and GPS conversion are discus-
sed in more detail below.
3.1 Object Detection and Tracking
Vessel detection is carried out using the Single Shot
Multibox Detector (SSD) (Liu et al., 2016). This de-
tector consists of a (pre-trained) CNN to extract image
features and adds convolution layers which estimate
bounding-box locations. More specifically, the added
CNN layers predict a confidence and bounding box
VISAPP 2018 - International Conference on Computer Vision Theory and Applications
154
VGG-16
through Conv5_3
32
32
Conv7
(FC7)
1024
16
16
Conv8_2
512
8
8
Conv9_2
256
64
64
Conv4_3
4
Conv10_2
256
4
256
1
512
512
3
Image
512
Non-Maximum Suppression
Conv11_2
32
32
Conv6
(FC6)
1024
Conv12_2
2
256
2
Conv 3x3x1024 Conv 1x1x1024
Conv 1x1x256
Conv 3x3x512-s2
Conv 1x1x128
Conv 3x3x256-s2
Conv 1x1x128
Conv 3x3x256-s2
Conv 1x1x128
Conv 3x3x256-s2
Conv 1x1x128
Conv 3x3x256-s2
Classifier: Conv: 3x3(3x(c
ship
+ {c
x
, c
y
, w, h})), a
r
={1, 2}
Classifier: Conv: 3x3(6x(c
ship
+ {c
x
, c
y
, w, h})), a
r
={1, 2, 3, 5, 8}
Classifier: Conv: 3x3(6x(c
ship
+ {c
x
, c
y
, w, h})), a
r
={1, 2, 3, 5, 8}
Classifier: Conv: 3x3(5x(c
ship
+ {c
x
, c
y
, w, h})), a
r
={1, 2, 3, 5}
Classifier: Conv: 3x3(4x(c
ship
+ {c
x
, c
y
, w, h}))
Conv: 3x3(2x(c
ship
+ {c
x
, c
y
, w, h}))
Detections: 20362
ar={1}
ar={1}
Extra Feature Layers
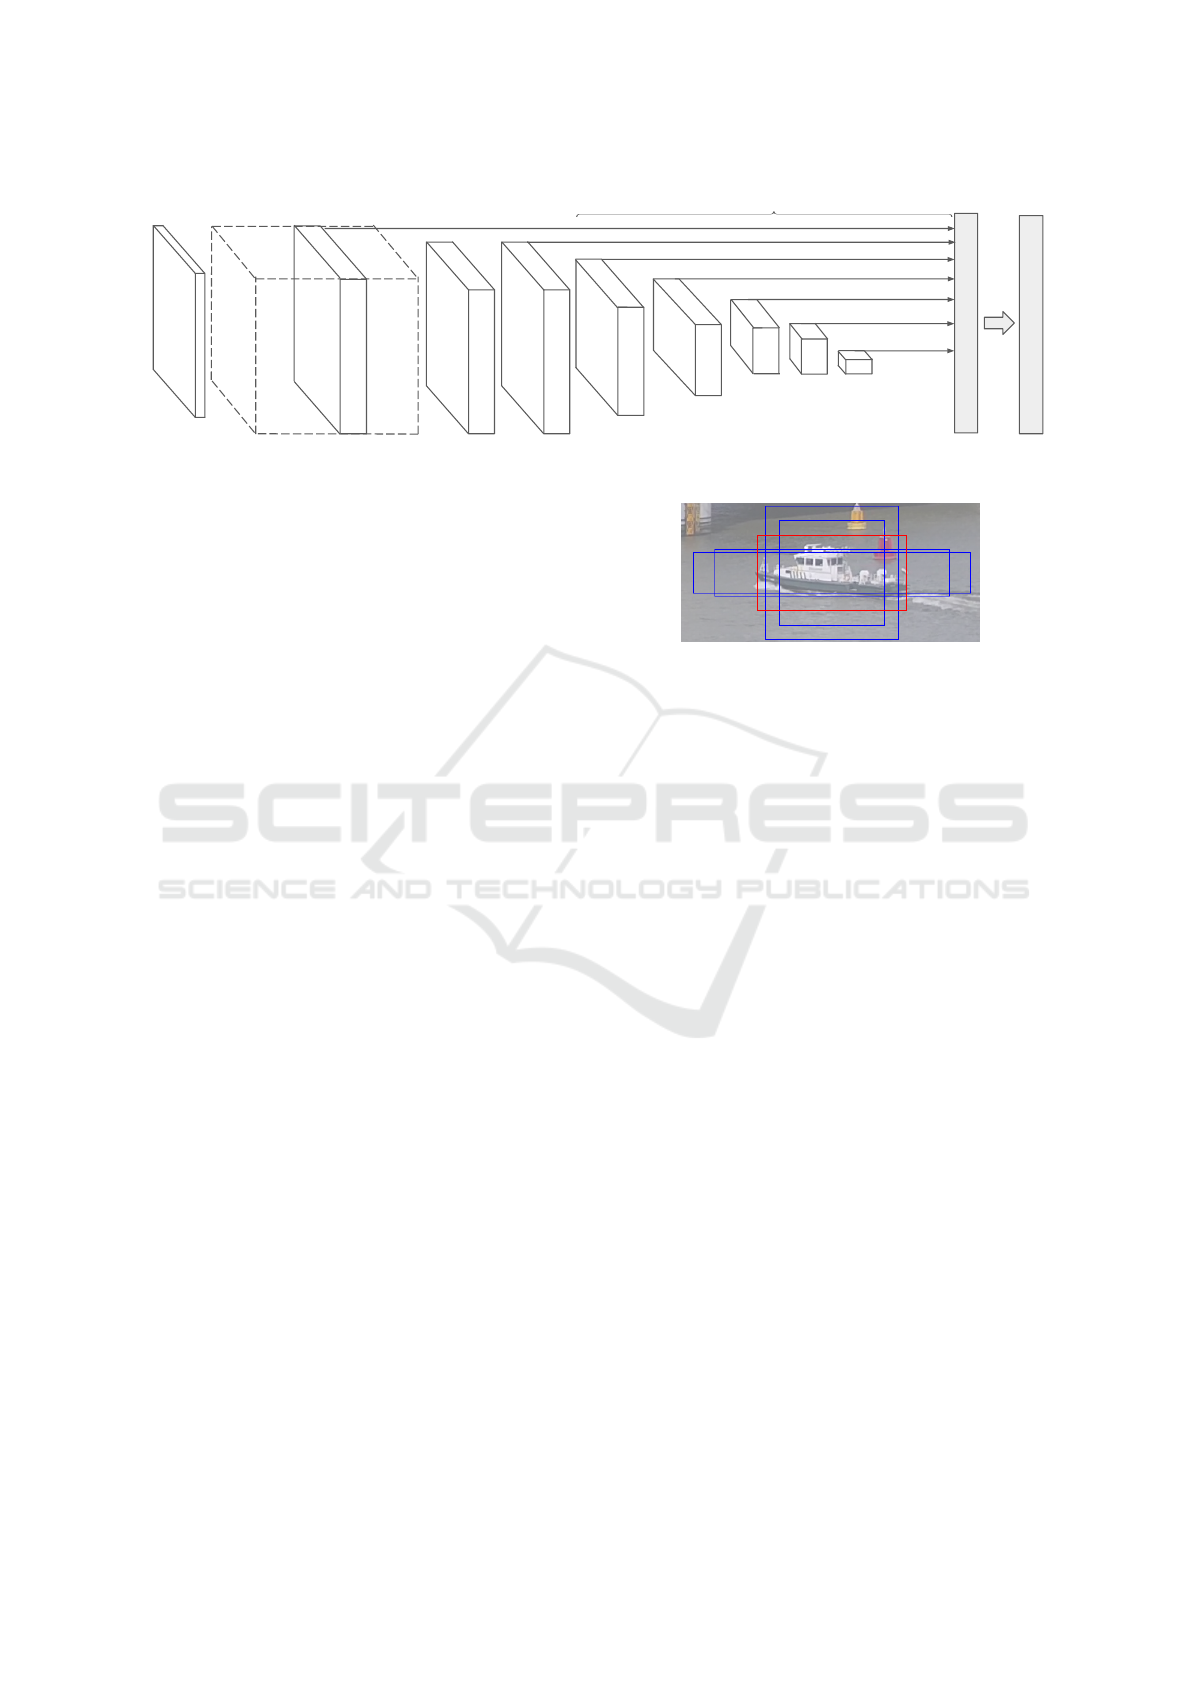
Figure 1: SSD model with additional feature layers at the end of the base network to predict the offsets and confidences.
offsets to a set of default bounding boxes over various
scales. These default boxes are called prior-boxes.
We specifically adapt the configuration of the added
layers for the application of vessel detection.
The input of the detector is the video stream pro-
vided by the surveillance camera. The original video
stream has a resolution of 2048 × 1536 pixels and is
downscaled to 512 × 512 pixels to match the detec-
tor input. Figure 1 shows complete network. The
first part of the network consists of the VGG16 (Si-
monyan and Zisserman, 2014) network as proposed
by Liu et al. and computes the image features. There
are several CNN layers attached to this base network
which estimate a confidence c
ship
and location offsets
∇(cx,cy,w,h). These offsets are measured with re-
spect to the locations of the prior-boxes to form de-
tections. Between each output layer, there are one or
two convolutions that perform downscaling of the fea-
tures such that objects can be localized at several sca-
les. In total, there are 8 layers on which detections
are predicted. The detections are merged using non-
maximum suppression to obtain the final detections.
The output layers that estimate the confidences
and location offsets use a set of default bounding-
boxes called prior-boxes. For each position in an out-
put layer, multiple prior-boxes with different aspect
ratios a
r
= width/height are defined. We propose to
use aspect ratios which best match the application of
the involved ship detection. So we modified the set of
aspect ratios compared to the original implementation
to a
r
= {1,2,3,5,8}. Note that we do not use a
r
< 1,
as vessels are not likely to appear vertically in the ca-
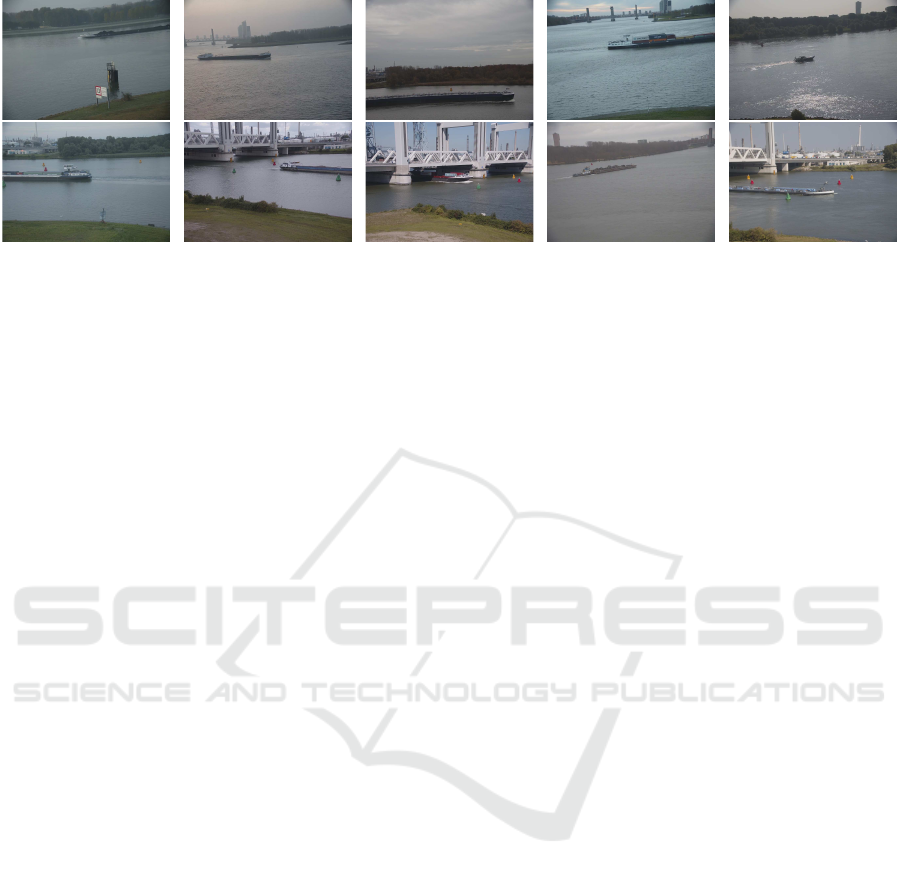
mera image. Figure 2 shows the employed set of prior
boxes. In the network design (Figure 1) the prior-box
aspect ratios for each output layer are given.
Vessel detection by the SSD network is perfor-
med at 5 frames per second. To create trajectories
over time, visual tracking is performed by feature
point (Shi and Tomasi, 1994) tracking with optical
flow. The detections provided by the detector also in-
voke (re-)initialization of the tracking algorithm.
Figure 2: Overview of the prior-boxes, red box shows best
overlap with ground truth. Note that prior-boxes are located
at fixed coordinates and do not necessarily align with object.
3.2 GPS Location by Calibration
The trajectory information provided by object de-
tection and tracking is given in pixel locations. To
aid for integration in a VTS, the locations are con-
verted to GPS coordinates, requiring the camera to
be calibrated. This camera calibration is performed
based on the horizon line and the vertical vanishing
point (Brouwers et al., 2016). In our application, we
have defined the horizon line and vertical vanishing
point by manually annotating several parallel lines in
the camera image. Then, the algorithm as proposed
by Brouwers et al. computes the camera calibration.
The obtained camera calibration can convert the pixel
locations to a local real-world grid (defined with re-
spect to the camera position). Finally, an annotated
point correspondence between GPS coordinates and
pixel locations is exploited to rotate and translate the
local real-world grid to GPS coordinates.
4 PROPOSED DATASET
GENERATION
The CNN network requires extensive training data to
cover all the intra-class variations, e.g. various ves-
sel types and viewpoints. To obtain sufficient training
data, we recorded 73 days of video during a time-
span of 6 months. Manual selection of vessel sam-
ples would be an enormous task. Therefore, we pre-
Ship Detection in Harbour Surveillance based on Large-Scale Data and CNNs
155
#1
#2 #3
#4 #5
17,422 6,192 351 18,253 6,310
#6
#7
#8 #9 #1010,186 331 2,156 1,746 7,566
Figure 3: Overview of the different camera viewpoints in the dataset with the number of vessels in each viewpoint.
sent an algorithm to automatically select frames con-
taining ships from many hours of video to construct
our dataset. Note that the choice of algorithm is not
relevant for the final detection performance. We want
to emphasize that the detection algorithm for dataset
generation has insufficient accuracy for ship localiza-
tion and can only be used to detect the presence of a
ship. Therefore, ship localization is performed manu-
ally for dataset generation.
4.1 Video Frame Selection
The aim of our proposed algorithm is to efficiently
find interesting samples of vessels in many hours of
video. For simplicity, the recordings are split into se-
parate viewpoints and the goal is to only detect if a
vessel occurs in the current frame of the video.
The algorithm downscales the original video input
to 512 × 512 pixels and divides each frame in cells of
8 × 8 pixels. For each cell, we subtract the pixel va-
lues of the cell in the previous frame and compute the
mean µ and variance σ
2
of the pixel values in the cell.
We decide per cell if it contains an object, based on
a threshold for the mean and variance. A low diffe-
rence in mean implies that the cells are close in co-
lor intensity, and a high difference in mean indicates
that the colors have significantly changed. Similarly, a
low difference in variance indicates that the structure
within the cell is similar, whereas a high difference
in variance highlights that the cell contains a signi-
ficant difference in texture activity compared to the
previous cell. We have empirically determined that
the thresholds are µ = 0.12 and σ
2
= 0.003 and that a
vessel is in the video frame when there are more than
12 neighboring cells exceeding this threshold. In this
case we store the frame for further annotation, with a
minimum time-span of 5 seconds between the stored
frames. Although our algorithm for selecting frames
containing vessels is not perfect and also responds
to (large) bow waves and reflections in the water, it
provides us a small subset of frames containing ob-
jects in a fast and efficient way, in order to prepare a
large dataset in limited time. The video frames obtai-
ned by the algorithm are manually post-processed to
remove frames without vessels. In the resulting fra-
mes, we manually annotate ships by drawing a boun-
ding box around the complete vessel. Ships pushing
a barge, i.e. towboats, are annotated separately from
the barge. When multiple barges are connected, we
annotate each barge individually.
4.2 Dataset Statistics
Video was recorded from various camera viewpoints
(angles). Therefore, all ships appear only once in each
viewpoint dataset. Per viewpoint, multiple images of
a ship are selected and annotated, such that there are
examples of various orientations and backgrounds.
Ships making the same route repetitively will occur
more often. The final vessel dataset contains a total
of 70,513 vessels in 48,966 images, collected from 10
different camera viewpoints. The viewpoint and num-
ber of samples per viewpoint are shown in Figure 3.
Example annotations from our dataset are depicted by
the white bounding boxes in Figure 7. The figure also
shows difficult situations such as low light, very small
ships and clutter from in-harbour structures. Figure 4
visualizes the width and height of all annotations in
the dataset. It can be clearly seen that ships typically
have a large aspect ratio (long objects). Many trun-
cated annotations (green) occur, due to ships that are
not fully visible in the camera view. The datasets con-
tain some ships that are truncated at both sides of the
image. For the selection of the prior-boxes in the SSD
detector (see Section 3.1), we commence with se-
lected values of aspect ratios and update the occurren-
ces accordingly during training. The resulting prior-
boxes are depicted by yellow circles in Figure 4 and
match well with the distribution of the ship annotati-
ons.
VISAPP 2018 - International Conference on Computer Vision Theory and Applications
156
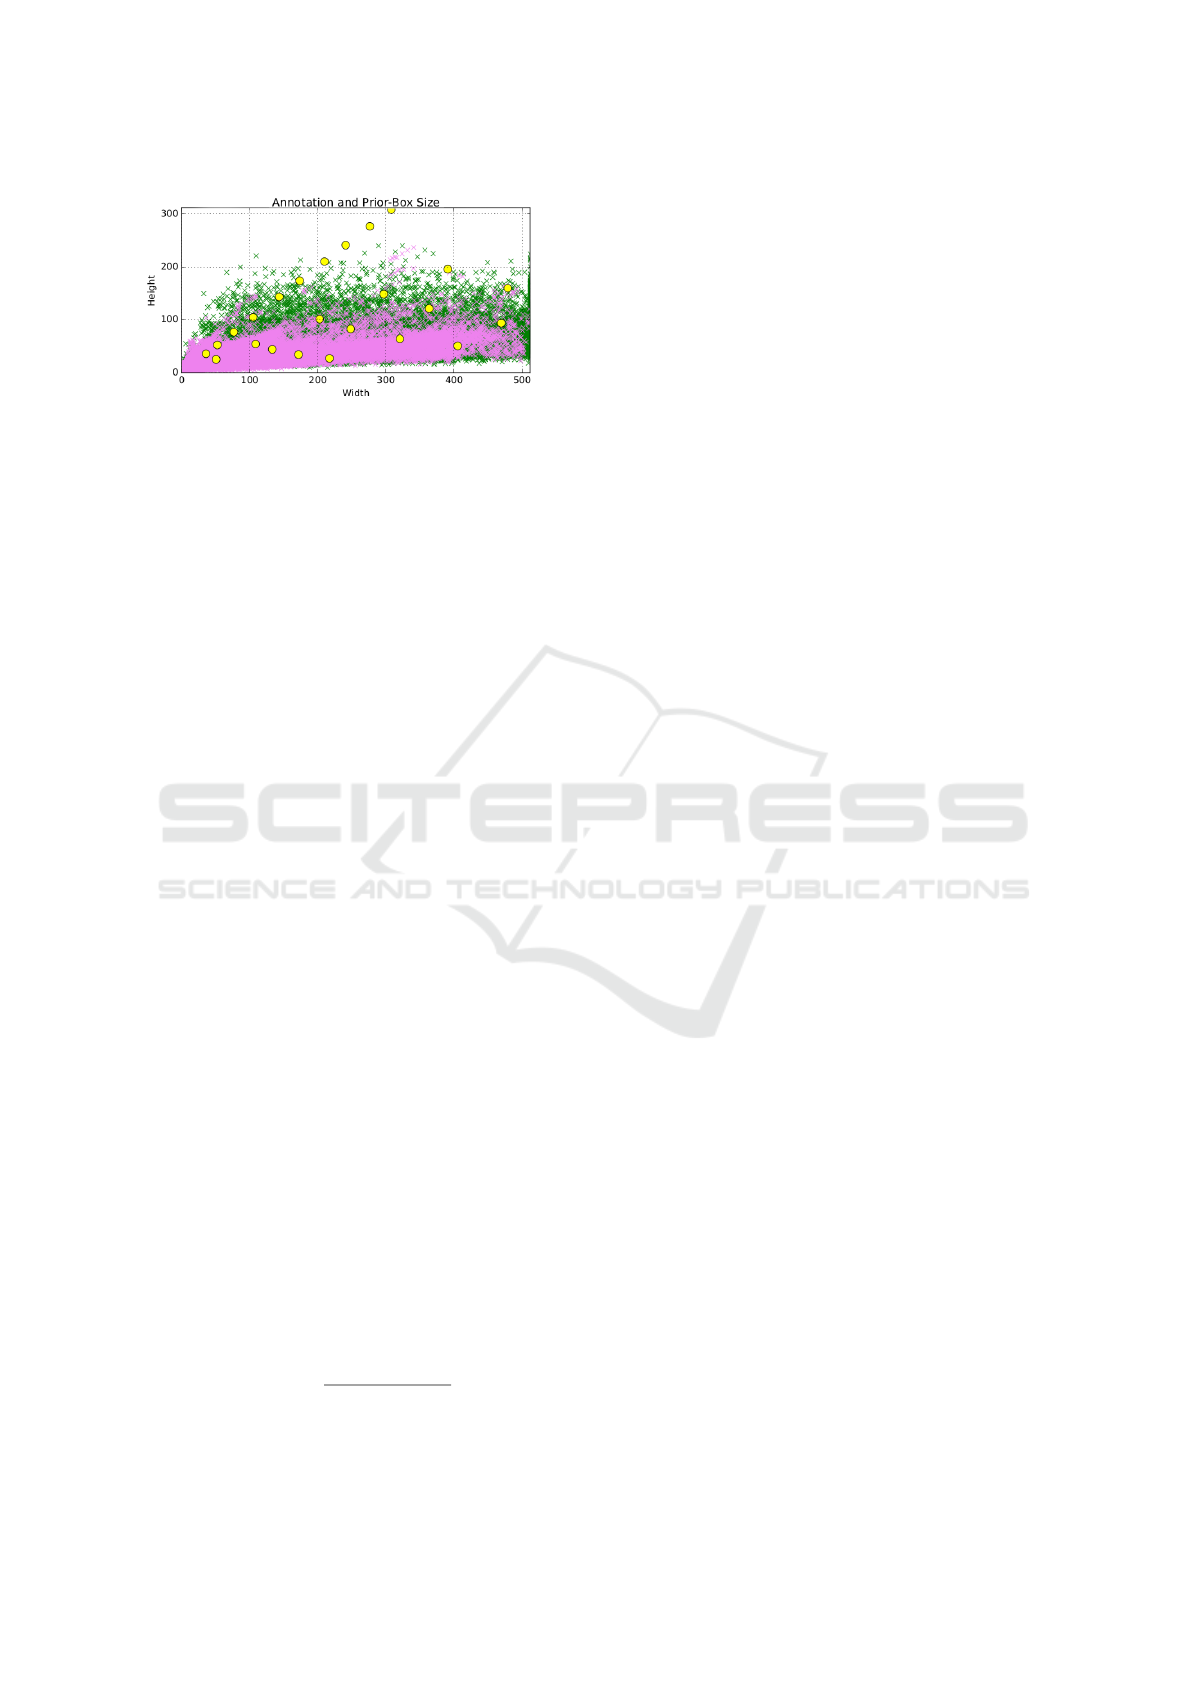
Figure 4: Visualization of size (width vs. height) of all an-
notations. Green data points denote truncated objects, while
violet data points are vessels which are completely visible
in camera image. The yellow dots show prior-box aspect
ratios and sizes used in our SSD implementation.
5 EXPERIMENTAL RESULTS
The ship detection performance of the SSD detector
has been experimentally validated. Cross-validation
is performed over the camera viewpoints. The evalua-
tion criteria are presented first, after which the details
of the SSD detector are presented. Cross-validation
is then used to obtain an objective evaluation of de-
tection performance, followed by an in-depth discus-
sion in terms of aspect ratio and size.
A. Training: In all experiments, the pre-trained
model VGG16 (Simonyan and Zisserman, 2014) has
been used, similar to the original SSD network (Liu
et al., 2016). The output layers are configured as des-
cribed in Section 3.1 and are trained from scratch.
The model is fine-tuned with an initial learning rate
of 10
−5
, momentum 0.9, weight decay 0.0005, mul-
tistep learning policy [2k, 5k, 40k, 80k] and batch size
12 for 120k iterations. The other parameters are equal
to the original SSD implementation. We train the de-
tector using the proposed vessel dataset and add the
VOC PASCAL 2007 set to gather hard-negatives.
B. Evaluation: This is carried out using the
Average Precision (AP) metric as used in the PAS-
CAL VOC challenge (Everingham et al., 2012). This
metric summarizes a recall-precision curve by the
average interpolated precision value of the positive
samples. Recall R(c) denotes the fraction of objects
that are detected with a confidence value of at least
c. An object is detected if the detected bounding box
has a minimum Jaccard index of 0.5 with the ground-
truth bounding box, otherwise a detection is conside-
red incorrect. Precision is defined as the fraction of
detections that are correct:
P(c) =
R(c) · N
j
R(c) · N
j
+ F(c)
, (1)
where N j is the number of ships in the ground-truth
set and F(c) denotes the number of incorrect detecti-
ons with a confidence value of at least c.
Besides the AP metric, the average normalized
precision (AP
N
), as proposed by Hoiem et al. is
used (Hoiem et al., 2012). This normalized metric
is required to ensure that subclasses with specific pro-
perties (aspect ratio and size) can be evaluated in a
reproducible way, which handles cases that proper-
ties overlap or have arbitrary variations. For this,
Hoiem et al. introduce a constant N
j
= N to com-
pute the normalized precision P
N
(c). We choose N =
#images for each dataset. The normalized precision
P
N
(c) values of the positive samples are averaged to
obtain the average normalized precision AP
N
.
5.1 Cross-validation on Viewpoints
In the first experiment, we perform a cross-validation
on the 10 viewpoints to find more insight of the influ-
ence of scene context on the detection performance.
Each detector excludes one viewpoint from the trai-
ning set and uses that viewpoint for evaluation. De-
tector 1 is trained on all viewpoints except View-
point 1. Additionally, the performance of the original
SSD network is also evaluated, but without the modi-
fications on the aspect ratios. Hence, the original SSD
networks are trained on two different datasets. First,
the “SSD512 Trained” network is based on our propo-
sed dataset. Second, the “SSD512 Original” network
has been trained on the PASCAL VOC07+12 and the
Microsoft COCO datasets from the original SSD pa-
per. The trained detectors are evaluated on all view-
points by measuring the average precision. Results of
this evaluation are shown in Table 1.
We can observe that the average precision is
around 0.90 for most viewpoints in the cross-
validation (bold diagonal values in the table). The
performance does not or only marginally decrease
when the viewpoint is not used for training. We can
conclude that the combination of images from all vie-
wpoints is sufficient to train a good performing detec-
tor. However, there are some exceptions to this and
we will discuss these in more detail. Viewpoints 2
and 4 show a lower detection performance, even for
detectors that include these viewpoints in their trai-
ning data (Columns 2 and 4). We will evaluate this
further in Section 5.3. Viewpoint 8 shows a lower per-
formance for Detector 8, meaning that Viewpoint 8
contains specific information not occurring in other
viewpoints. A large bridge structure in the camera
view causes missed and incorrect detections.
The original SSD network (“SSD512 Original”)
results in a low detection performance on the data-
set. We conclude that the PASCAL VOC07+12 and
Ship Detection in Harbour Surveillance based on Large-Scale Data and CNNs
157
Table 1: Cross-validation of the ship detectors (vertical) per viewpoint (horizontal) using the average precision. Each row
shows the results of a detector, each column shows the results on that camera viewpoint. The “SSD512 Original” denotes
the SSD512 detector trained on VOC07+12+COCO and “SSD512 Trained” is the original SSD configuration trained on our
dataset. “SSD512 Proposed” is our configuration trained on our dataset.
1 2 3 4 5 6 7 8 9 10 Avg
Detector 1 0.89 0.82 0.90 0.78 0.90 0.91 0.91 0.91 0.91 0.90 0.88
Detector 2 0.90 0.69 0.90 0.76 0.90 0.91 0.91 0.91 0.91 0.90 0.87
Detector 3 0.90 0.79 0.90 0.76 0.90 0.91 0.91 0.91 0.91 0.90 0.88
Detector 4 0.90 0.78 0.90 0.59 0.90 0.91 0.91 0.91 0.90 0.90 0.86
Detector 5 0.90 0.80 0.90 0.77 0.90 0.91 0.91 0.91 0.91 0.90 0.88
Detector 6 0.90 0.81 0.90 0.77 0.90 0.90 0.91 0.91 0.90 0.90 0.88
Detector 7 0.90 0.80 0.90 0.77 0.90 0.91 0.91 0.91 0.90 0.90 0.88
Detector 8 0.90 0.81 0.90 0.77 0.90 0.91 0.91 0.80 0.90 0.90 0.87
Detector 9 0.90 0.80 0.90 0.77 0.90 0.91 0.91 0.91 0.90 0.90 0.88
Detector 10 0.90 0.80 0.90 0.77 0.90 0.91 0.91 0.91 0.90 0.88 0.88
SSD512 Original 0.48 0.28 0.50 0.30 0.66 0.46 0.16 0.18 0.19 0.62 0.41
SSD512 Trained 0.90 0.78 0.90 0.76 0.90 0.90 0.91 0.90 0.90 0.90 0.88
SSD512 Proposed 0.90 0.78 0.90 0.76 0.90 0.91 0.91 0.91 0.91 0.90 0.88
the COCO dataset statistics are not sufficient to train
a good detector for typical surveillance applications.
Furthermore, the original SSD512 network trained on
our dataset (“SSD512 Trained”) obtains only slightly
lower performance than our modified configuration of
the SSD network (VP 6,8,9). It is therefore concluded
that the proposed fine-tuning only yields a marginal
improvement on the detection performance. Appa-
rently both systems (with different prior-box configu-
rations) are able to accurately localize ships.
5.2 Aspect Ratio and Size
In this section, the influence of aspect ratios and sizes
is measured by evaluating the AP
N
. For both features,
individual categories are defined. Bounding boxes are
assigned to a size category, based on their percentile
size (Hoiem et al., 2012). The adopted size categories
are: Extra Small (XS, bottom 10%), Small (S, next
20%), Medium (M, next 40%), Large (L, next 20%)
and Extra Large (XL, last 10%). For the aspect ratio
categories, we summarize all tall objects (T, a
r
< 1.0)
in a single category, since very few tall objects occur
in our dataset. For all other aspect ratios, we define
the following categories based on the objects percen-
tile aspect ratio: Medium (M, bottom 10%), Medium
Wide (MW, next 20%), wide (W, next 40%), Extra
Wide (XW, next 20%), Ultra Wide (XXW, last 10%).
The categories and corresponding bounding-box
sizes and aspect ratios are shown in Table 2. Note that
the size difference between the XS and XL category
is very high, so the detector performance is evaluated
over a large scale range. Also note that the largest
aspect ratio equals a ship of only 18.4 pixels in height,
covering the entire input image width (512 pixels).
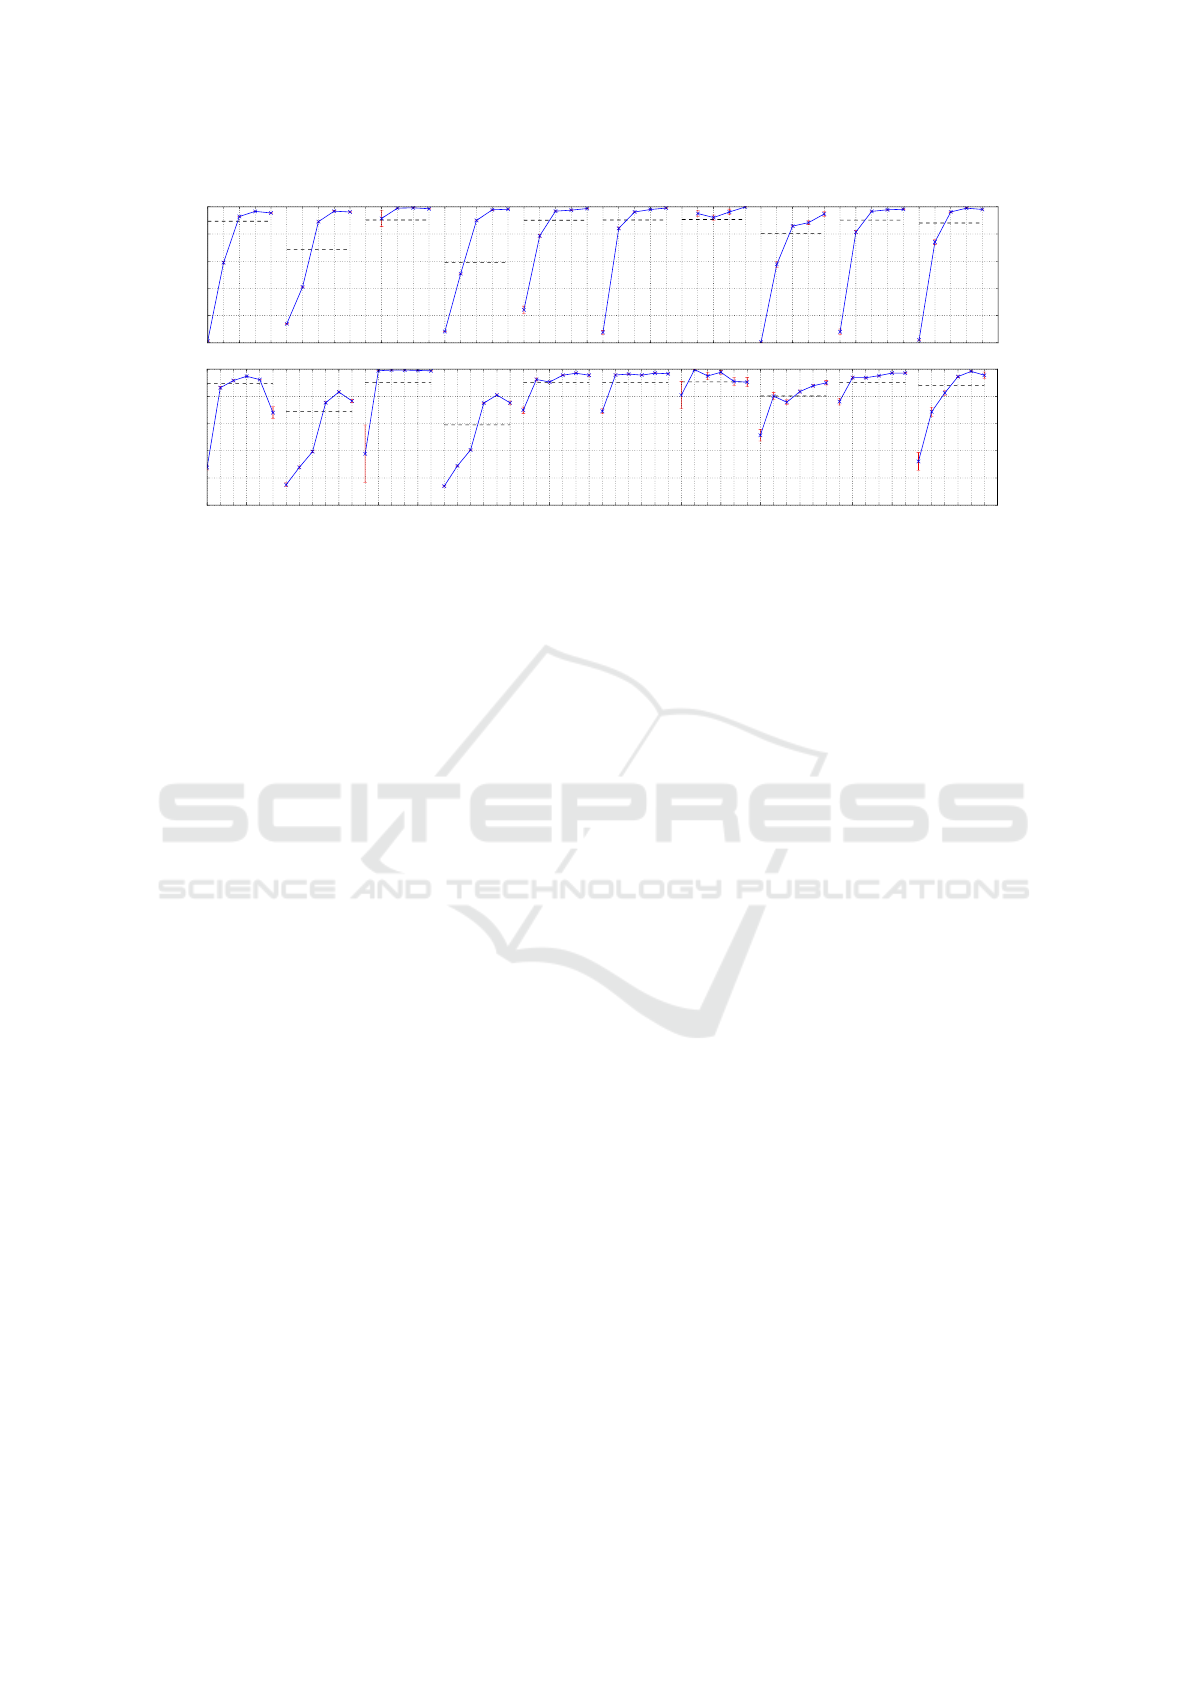
The AP
N
values for the size categories for each
viewpoint are shown in Figure 5. In all viewpoints,
Table 2: Size and aspect-ratio categories with the corre-
sponding maximum actual size and aspect ratio.
Size Aspect Ratio
Cat. Max. Area Cat. Max. a
r
XS 131 T 1.0
S 1,901 M 1.7
M 12,038 MW 2.8
L 24,749 W 5.6
XL 114,688 XW 8.2
XXW 27.8
the detectors have a high performance on Medium to
Extra Large ships. Extra Small ships are poorly de-
tected. In Viewpoints 2 and 4, many small ships ap-
pear, which causes a low average precision (denoted
by the dotted line in the figure). The detection perfor-
mance improves for Small ships.
Evaluation on aspect ratios (Figure 5) shows the
detection performance on tall objects is poor, while
the detection performances for Wide (W), Extra Wide
(XW) and Ultra Wide (XXW) are good. Objects in
the Tall and Medium aspect-ratio categories are typi-
cally clearly truncated and represent only the front or
back sides of ships. Frontal and rear views of ships
dominantly occur far away from the camera (in Vie-
wpoints 2 and 4), leading to a low performance due
to the small size of the ships. In several viewpoints,
the XXW performance is lower, which is mainly cau-
sed by ships that are only partly visible in the camera
view or even beyond the camera view on both sides.
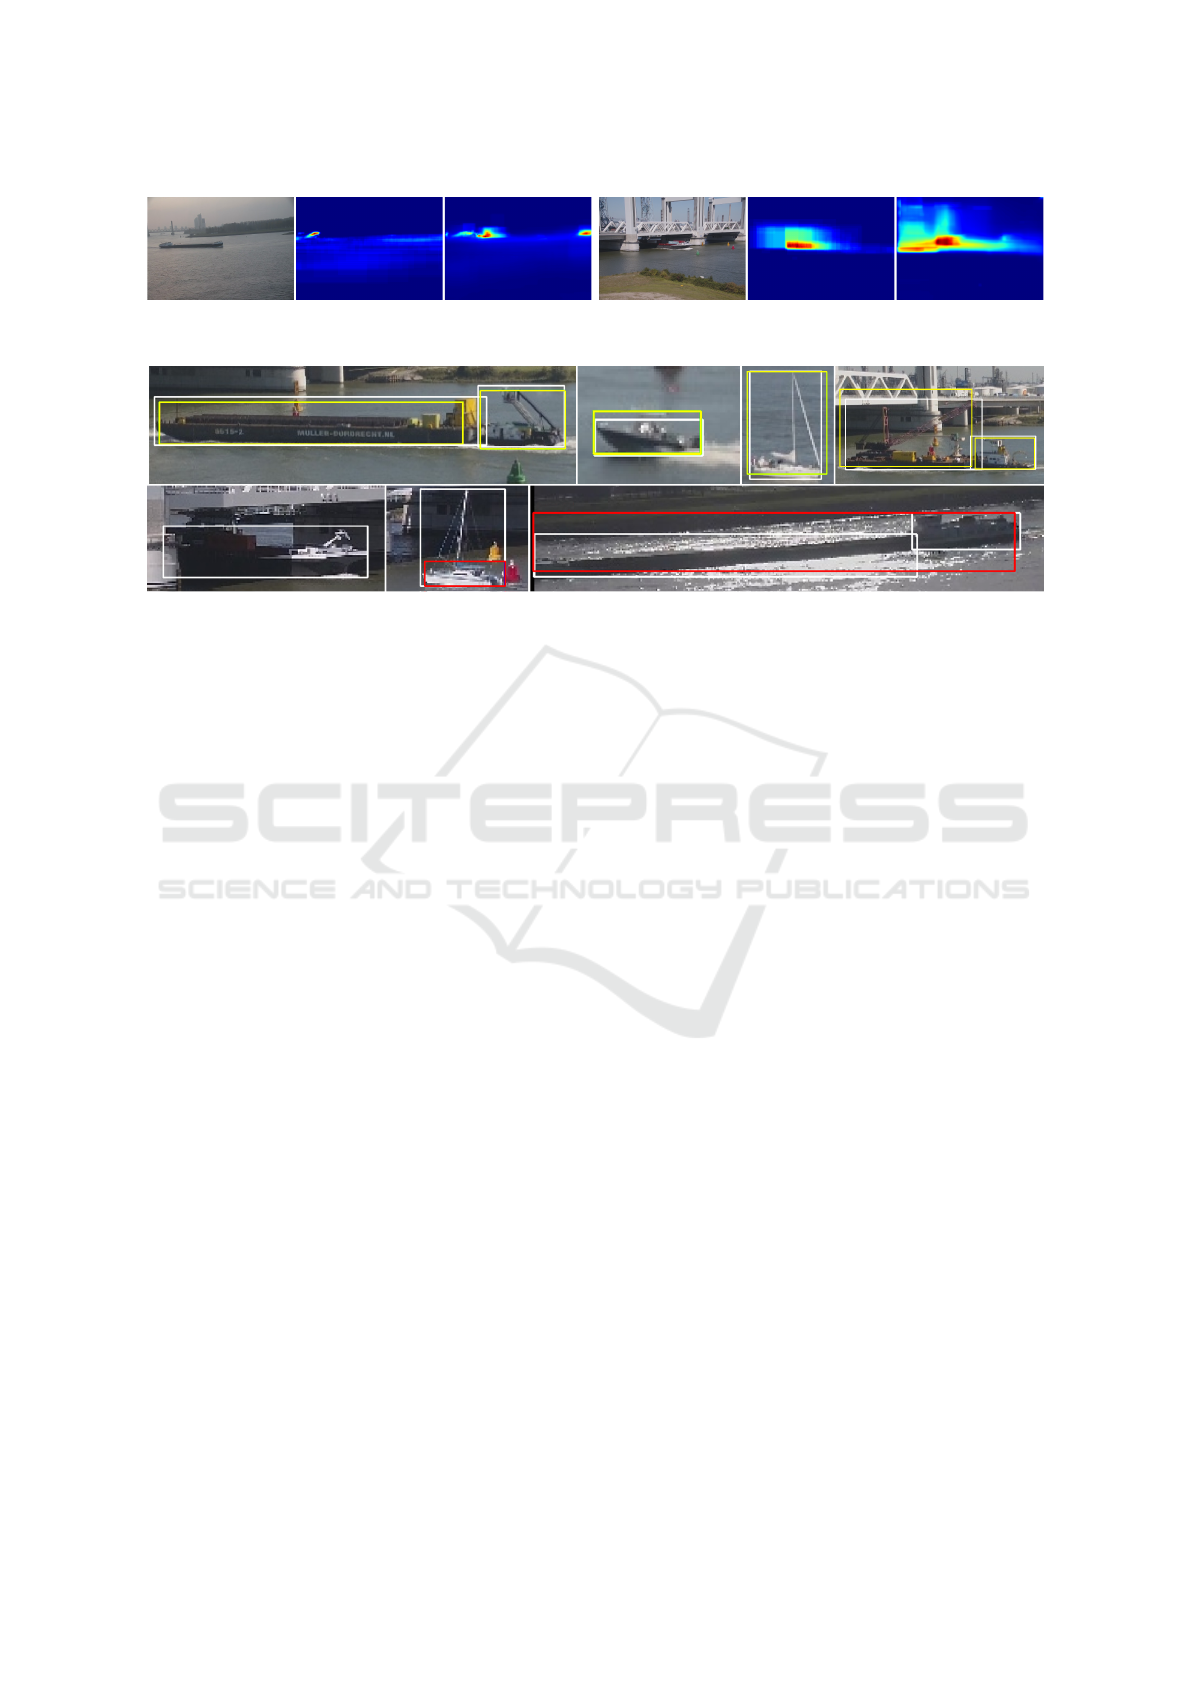
5.3 Visual Inspection
The performance of Detectors 2 and 8 is further in-
vestigated by creating heat maps of the locations of
missed ground-truth objects and incorrect detections.
For each heat map, the number of bounding boxes per
VISAPP 2018 - International Conference on Computer Vision Theory and Applications
158
XS
S
M
L
XL
XS
S
M
L
XL
XS
S
M
L
XL
XS
S
M
L
XL
XS
S
M
L
XL
XS
S
M
L
XL
XS
S
M
L
XL
XS
S
M
L
XL
XS
S
M
L
XL
XS
S
M
L
XL
0.0
0.2
0.4
0.6
0.8
1.0
Viewpoint #1 #2 #3 #4 #5 #6 #7 #8 #9 #10
T
M
MW
W
XW
XXW
T
M
MW
W
XW
XXW
T
M
MW
W
XW
XXW
T
M
MW
W
XW
XXW
T
M
MW
W
XW
XXW
T
M
MW
W
XW
XXW
T
M
MW
W
XW
XXW
T
M
MW
W
XW
XXW
T
M
MW
W
XW
XXW
T
M
MW
W
XW
XXW
0.0
0.2
0.4
0.6
0.8
1.0
Aspect Ratio
Size
Figure 5: Average normalized precision for ship sizes (top) and aspect ratio (bottom) shown for all viewpoints.
pixel location are counted and normalized. Note that
the heat maps are scaled independently from each ot-
her, so there is no relation to the amount of objects.
Figure 6 shows the heat maps created for View-
points 2 and 8. It can be observed that missed detecti-
ons for Viewpoints 2 mainly occur at locations which
appear at the scene background. This confirms our
prior finding that very small ships are not detected.
False detections mainly occur at land areas surroun-
ded by water and around the bridge structure farther
away in Viewpoint 2, this also holds for the similar
Viewpoint 4.
The heat maps for Viewpoint 8 show that missed
detections mainly occur when ships move under the
bridge, where also incorrect detections occur. This
points to localization errors (bridge structure) and
changes of conditions (shadows). Ships are accura-
tely detected when they are in open space.
Figure 7 visualizes several detection examples and
shows some typical cases of incorrect and missed de-
tections. Localization errors mainly occur due low vi-
sibility of ship parts, for example, by strong shadows
under the bridge. Other typical localization errors are
single detections over a tow/tug boat and the con-
nected barge. Sailing ships are sometimes not de-
tected due to their high mast extending the body of the
ship. The correct detections indicate that the detector
can handle the large range of intra-class variation pre-
sent in our dataset.
6 DISCUSSION
Although the original SSD network is not specifically
designed for large aspect-ratio objects such as ships,
the performance compared to our proposed SSD net-
work obtains only marginally lower detection perfor-
mance. This shows that the original configuration can
also handle the high aspect ratios of vessels. Hence,
it indicates that the SSD network is able to exploit all
relevant information from the training dataset in con-
trast to manual fine-tuning.
False detections mostly occur due to localization
errors and viewing distance and not to ship scales.
One possible solution to detect small (distant) ships
is to apply the SSD network at a higher resolution.
A more elegant approach would be to incorporate the
perspective of the scene in the network.
Our dataset contains many different ship types, but
is limited in the number of viewpoints and scenes.
Therefore, the dataset should be extended with more
diversity in the scenes.
7 CONCLUSIONS
We have presented the application of the SSD ob-
ject detector in the field of vessel surveillance and
introduced a novel dataset containing 70,513 ships
in 48,966 images, covering 10 camera viewpoints.
Cross-validation over the viewpoints shows that the
SSD detector obtains an average precision of over
90%, which results in accurate detection of ships. The
system detects vessels over a large range of variati-
ons in aspect ratio and size. The trained network can
detect various types of ships accurately, such as tow
boats, sailing vessels and barges.
An in-depth evaluation of the influence of aspect
ratio and size as specific features was performed. It
was found that the detector can handle extreme varia-
tions in aspect ratio, while variations in size are well
handled by the detector. However, very small ships
are poorly detected. Other failure cases mainly origi-
nate from heavily truncated vessels at image bounda-
Ship Detection in Harbour Surveillance based on Large-Scale Data and CNNs
159
VP 2
VP 8
Missed
Missed
Incorrect
Incorrect
Figure 6: Heatmaps for missed objects and incorrect detections. Note that each heatmap is individually scaled, so colors are
not directly comparable. The two cases are taken from critical camera viewpoints, pointing to difficult conditions.
Figure 7: Examples of correct detections (top rows) and incorrect/missed detections (bottom rows). Correct detections are
shown in yellow, incorrect detections in red and ground-truth annotations in white.
ries, incorrect merging of multiple ships and the influ-
ence of surrounding infrastructure like bridges.
The SSD detector trained on the proposed surveil-
lance dataset significantly outperforms the detector
trained on the PASCAL and COCO datasets. This
shows that the dataset statistics for the commonly
used generic object detection datasets are quite dif-
ferent from our real-life surveillance dataset, specifi-
cally dedicated to harbours and ships.
The obtained performance and robustness of the
developed ship detector proves to be valuable for sur-
veillance in harbour infrastructure, where radar is al-
ready used. The location of the detected vessels is
complementing the positioning information of the ra-
dar system, leading to a higher accuracy of the Vessel
Tracking System (VTS). Moreover, the use of a ca-
mera enables visual feedback on details of the ships
and provides the operator with a visual cue about the
considered vessels.
REFERENCES
Arshad, N., Moon, K.-S., and Kim, J.-N. (2010). Multiple
ship detection and tracking using background registra-
tion and morphological operations. In Signal Proces-
sing and Multimedia, pages 121–126. Springer.
Bao, X., Javanbakhti, S., Zinger, S., Wijnhoven, R., and
de With, P. H. N. (2013). Context modeling combined
with motion analysis for moving ship detection in port
surveillance. Journal of Electronic Imaging, 22(4).
Brouwers, G. M. Y. E., Zwemer, M. H., Wijnhoven, R. G. J.,
and de With, P. H. N. (2016). Automatic calibration of
stationary surveillance cameras in the wild. In Proc.
ECCV 2016 Workshops, pages 743–759. Springer.
Everingham, M. et al. (2007). The PASCAL Visual Object
Classes Challenge 2007 (VOC2007) Results.
Everingham, M. et al. (2012). The PASCAL Visual Object
Classes Challenge 2012 (VOC2012) Results.
Girshick, R. (2015). Fast R-CNN. In ICCV.
Girshick, R., Donahue, J., Darrell, T., and Malik, J. (2014).
Rich feature hierarchies for accurate object detection
and semantic segmentation. In Proc. IEEE CVPR.
Hoiem, D., Chodpathumwan, Y., and Dai, Q. (2012). Diag-
nosing Error in Object Detectors, pages 340–353.
Hu, W.-C., Yang, C.-Y., and Huang, D.-Y. (2011). Ro-
bust real-time ship detection and tracking for visual
surveillance of cage aquaculture. Journal of Visual
Comm. and Image Representation, 22(6):543–556.
Lin, T. et al. (2014). Microsoft COCO: common objects in
context. CoRR, abs/1405.0312.
Liu, W., Anguelov, D., Erhan, D., Szegedy, C., Reed, S.,
Fu, C.-Y., and Berg, A. C. (2016). Ssd: Single shot
multibox detector. In ECCV, pages 21–37. Springer.
Redmon, J., Divvala, S. K., Girshick, R. B., and Farhadi, A.
(2015). You only look once: Unified, real-time object
detection. CoRR, abs/1506.02640.
Russakovsky, O. et al. (2015). ImageNet Large Scale Visual
Recognition Challenge. IJCV, 115(3):211–252.
Shi, J. and Tomasi, C. (1994). Good features to track. In
1994 Proceedings of IEEE CVPR, pages 593–600.
Simonyan, K. and Zisserman, A. (2014). Very deep convo-
lutional networks for large-scale image recognition.
Uijlings, J. R., Van De Sande, K. E., Gevers, T., and Smeul-
ders, A. W. (2013). Selective search for object recog-
nition. Int. journal of comp. vision, 104(2):154–171.
Wijnhoven, R., Van Rens, K., Jaspers, E. G., and de With,
P. H. (2010). Online learning for ship detection in
maritime surveillance. In Proc. of 31th Symposium on
Information Theory in the Benelux, pages 73–80.
VISAPP 2018 - International Conference on Computer Vision Theory and Applications
160
