
An Unsupervised Learning Model for Pattern Recognition in
Routinely Collected Healthcare Data
Sara Khalid, Andrew Judge and Rafael Pinedo-Villanueva
Nuffield Dept. of Orthopaedics, Rheumatology & Musculoskeletal Sciences, University of Oxford, Oxford, U.K.
Keywords: Cluster Analysis, Unsupervised Learning, Electronic Healthcare Records, Chronic Pain, Data Mining.
Abstract: This study examines a large routinely collected healthcare database containing patient-level self-reported
outcomes following knee replacement surgery. A model based on unsupervised machine learning methods,
including k-means and hierarchical clustering, is proposed to detect patterns of pain experienced by patients
and to derive subgroups of patients with different outcomes based on their pain characteristics. Results showed
the presence of between two and four different sub-groups of patients based on their pain characteristics.
Challenges associated with unsupervised learning using real-world data are described and an approach for
evaluating models in the presence of unlabelled data using internal and external cluster evaluation techniques
is presented, that can be extended to other unsupervised learning applications within healthcare and beyond.
To our knowledge, this is the first study proposing an unsupervised learning model for characterising pain-
based patient subgroups using the UK NHS PROMs database.
1 INTRODUCTION
With recent advances in the acquisition and
digitisation of medical data, the use of routinely
collected healthcare data for research is on the rise
(Hay et al., 2013). Recent recommendations by the
UK National Institute for Health and Care Excellence
(NICE, 2016) and the Academy of Medical Sciences
have acknowledged the potential for data science and
big data methods to play an increasingly important
role in healthcare provision and research (The
Academy of Medical Sciences, 2017).
Despite growing interest and increased
computational resources, the use of data mining
methods in healthcare research has been limited in
scope and scale (Murdoch and Detsky, 2013). As the
landscape of data science evolves, methodologies and
applications for large-scale medical datasets are
maturing (Chen et al., 2016).
In this paper, we propose a model for mining a
large routinely collected healthcare dataset using
unsupervised machine learning methods. The
proposed model detects groups of patients with
specific patterns of pain, allowing us to characterise
self-reported surgical outcomes collected from
patients who have undergone knee replacement in the
UK.
We describe challenges associated with learning
from unlabelled real-world medical data and describe
a general approach that can be adapted for other
applications and datasets.
This is, to our knowledge, the first attempt at
applying a data-mining approach to the problem of
recognising pain-related patterns in patient-reported
outcomes contained in a large, routinely collected
national-level dataset.
1.1 Clinical Context
Osteoarthritis is a musculoskeletal condition that can
cause joint pain and loss of function. It affects more
than 8 million people in the UK alone (NJR Annual
Report, 2016). In severe cases, joint replacement is
performed to restore function and reduce pain.
Approximately 75,000 patients in the UK undergo
knee replacement surgery each year. However as
many as 1 in 5 patients report poor outcomes, such as
chronic or long-term pain after surgery (Wylde et al.,
2011).
Patients with chronic pain can experience a
decrease in their ability to perform everyday tasks and
correspondingly in their quality of life (Jones et al.,
2000). There is therefore a need to be able to identify
these groups of patients and develop a better
understanding of their pain profiles.
266
Khalid, S., Judge, A. and Pinedo-Villanueva, R.
An Unsupervised Learning Model for Pattern Recognition in Routinely Collected Healthcare Data.
DOI: 10.5220/0006535602660273
In Proceedings of the 11th International Joint Conference on Biomedical Engineering Systems and Technologies (BIOSTEC 2018) - Volume 5: HEALTHINF, pages 266-273
ISBN: 978-989-758-281-3
Copyright © 2018 by SCITEPRESS – Science and Technology Publications, Lda. All rights reserved

1.2 PROMS Database
The UK Patient Reported Outcome Measures
(PROMs) Programme is an ongoing national-level
programme to evaluate patient outcomes of surgery.
Patient-reported outcomes for all NHS knee
replacement procedures in England since 2009 are
recorded in the PROMs database
(http://content.digital.nhs.uk/proms).
1.3 Oxford Knee Score
The Oxford Knee Score (OKS) (Dawson et al., 1998)
is a patient-reported outcome measure for knee
replacement. Every patient undergoing a knee
replacement is asked to complete a questionnaire that
includes 12 questions about their pain and functional
ability within the past 4 weeks, in relation to their
knee (Murray et al., 2007). The response are scored
using a 0-4 Likert-scale. OKS responses are collected
from patients within 4 weeks before the knee
replacement and again 6 months after the knee
replacement.
Five of the twelve OKS questions are known to be
related to function (Harris et al., 2013). The
remaining seven questions – on “pain”, “night pain”,
“walking”, “standing”, “limping”, “work”, and
“confidence” – are related to pain and form the subset
OKS-P. We here define a pain component summary
measure (OKS-PS), summing the 0-4 scores given by
a particular patient to the seven OKS-P questions
related to pain. The OKS-PS can be scored from 0
(worst) to 28 (best), with higher scores indicating
better outcomes. We used the seven individual OKS-
P questions and the summary OKS-PS measure in this
analysis.
1.4 Contributions in This Paper
Cluster analysis, an unsupervised learning method for
discovering groupings and patterns in data, has been
used in healthcare applications (Kongsted and
Nielsen, 2017). However, studies have typically been
based on relatively small cohorts (<10,000 patients)
and used data from a set of general practices (Dunn et
al., 2006, Lacey et al., 2015).
• Our study investigates using cluster analysis on
a large, routinely collected, nationally
representative dataset, collected from all
participating patients undergoing a knee
replacement procedure at an NHS site in the
UK.
• We expose and address methodological
challenges associated with learning from real-
world healthcare records using routinely
collected data.
• We propose a model evaluation framework that
can be adapted to other unsupervised learning
and data mining applications, within and beyond
healthcare.
2 METHODS
2.1 Data
OKS records associated with knee replacement were
extracted for the years 2012-2016 from the PROMs
database. A total of 126,064 complete-case records
(with no missing data) of knee replacement patients
were included in the analysis. We used the OKS
reported by patients 6 months after surgery.
2.2 Unsupervised Learning Model
It is not known, a-priori, if subgroups of knee
replacement patients exist and, if so, how many. This
is the main challenge in a typical unsupervised
learning scenario: without knowing about any “true”
groups, the model has to learn if the population
naturally contains subgroups and how many
subgroups, based on the population’s characteristics
or features. An underlying assumption is that the set
of features that are included in the model are
representative of the natural grouping within the
population.
We present an unsupervised learning model for
identifying patient subgroups characterised by self-
reported outcomes. Patients or subjects were
clustered based on the similarity of their OKS-P
scores, with results from hierarchical and k-means
clustering compared. The optimal number of clusters
was determined using standard internal evaluation
methods and our proposed external evaluation
technique. Finally, the characteristics of the optimally
identified clusters were examined.
2.3 Cluster Analysis
Cluster analysis methods seek to partition n subjects
into k groups or clusters, where similar subjects are
placed in the same cluster, and any two clusters are
ideally distinct from one another. The similarity of
any two subjects in the dataset is represented by the
d-dimensional distance (e.g., the Euclidean distance)
between them, where d is the number of features
included in the model.
An Unsupervised Learning Model for Pattern Recognition in Routinely Collected Healthcare Data
267

3
The choice of clustering method depends on the
nature of the clustering task and the distribution and
type of data (e.g., continuous or categorical). It is
good practice to use more than one method and
compare the resulting solutions.
2.3.1 Hierarchical Clustering
A multi-level hierarchical tree can be created by
either repetitively merging subjects into clusters
(agglomerative clustering) or repetitively splitting
clusters (divisive clustering). As divisive clustering
can be computationally more expensive, we used
agglomerative clustering.
Each subject is initially considered to be a cluster,
and the closest clusters are merged. Clusters are
continually merged based on their similarity, until
either a pre-specified number of clusters, k, has been
reached, or all of the subjects have been merged into
one cluster.
Similarity between two clusters can be assessed in
different ways, e.g. by considering the minimum
(often referred to as “single” link) or maximum
(“complete” link) distance between points in two
candidate clusters (“average” link). Alternatively it
may be assessed using the average distance between
points in two clusters. We will use the “Ward”
measure which merges two clusters such that the total
within cluster variance is minimised, and is
appropriate for use with Euclidean distance.
2.3.1.1 Handling Ties
Let the th subject be represented in feature space by
, where The d-dimensional distance
between two subjects
and
is a function of their
location in d-dimensional feature space, given by
,
where .
The distance
between two subjects
remains the same, even if the subjects’ order in the
dataset changes. Hierarchical clustering should thus
produce the same solution regardless of how the
subjects are ordered in the dataset.
However this non-dependency on ordering may
change in case of ties. Pairs of subjects are referred to
as being “tied” when they are equidistant in feature
space, illustrated for two dimensions in Figure 1.
Which of the tied pairs is merged first is an arbitrary
decision. The most common approach is to select the
pair that occurs first in the dataset, which makes the
algorithm order-dependent.
As each OKS-P question is a categorical variable
(i.e., each question takes one
Figure 1: Ties between equidistant pairs in a dataset. The
solid arrows denote equal distances, whereas the dashed
arrow denotes a non-equal distance.
of five discrete values from: 0, 1, 2, 3, and 4),
distance-based ties are expected in the 7-dimensional
feature space that represents the 7 OKS-P questions.
Although some alternatives to handling ties have
been suggested (King, 1967), they have been
designed for data that have both continuous and
categorical variables. They are not suitable for
handling ties when all of the variables are categorical,
as in this case. In practice, the algorithm’s
dependency on ties can be dealt with by repeating the
algorithm after randomly reordering the dataset and
averaging over the resulting solutions.
2.3.2 K-Means Clustering
In k-means clustering, we pre-specify the final
number of clusters, k. Clusters are initialised by
assigning k randomly selected points in the d-
dimensional space to be cluster centroids. For each
subject, the subject-to-centroid distance is computed,
and the subject is allocated to the closest centroid.
The cluster centroids are re-calculated based on the
allocations. Subjects are re-assigned to the closest
centroids until the location of the cluster centroids
stops changing.
The clustering solution depends on cluster
initialisation. A poor choice of initial cluster centroids
can result in a local minima trap, which is a well-
known limitation of k-means clustering. As the
cluster centroids are initialised at random, the
algorithm should be repeated with random
initialisation and the results combined.
2.4 Cluster Evaluation
As “true” groups are not known, evaluating a
clustering solution can be notoriously challenging.
2.4.1 Internal Evaluation
Internal evaluation techniques determine how well
HEALTHINF 2018 - 11th International Conference on Health Informatics
268

the data fit within the candidate clusters, by
assessing how well a clustering solution minimises
homogeneity within a cluster and maximises
separation between clusters. Many criteria have been
developed to achieve these aims. The simplest is
based on the variance or scatter within a cluster,
called the within-cluster sum of squares (WCSS):
,
where
is the set of subjects in the kth cluster,
is the cluster mean, and k is the candidate number
of clusters, k = 1:K. K is the maximum number
candidate clusters considered.
By design, k-means clustering seeks to minimise
the . Other commonly used objective criteria
include the Silhouette, Gap, and Calinski-Harabasz
(CH), and are well-described in literature. The
number of clusters for which a given criterion is met
is considered to be the optimal number of clusters,
2.4.2 External Evaluation
Internal evaluation criteria sometimes fail to yield a
clear choice of
We can then use an independent
variable to externally validate the clustering solution.
This independent variable must be associated in some
way with the features included in the clustering
model, but must not be a feature used in the model.
As the “true” label is not known, this independent
variable can at best be thought of as a validation
variable, and not a label.
Both internal and external evaluation methods are
useful for developing an understanding of a clustering
algorithm’s performance and the grouping behaviour
present in the data. However, as there is no single,
well-accepted criterion, choosing a
that most
suitably characterises any naturally existing clusters
within the data is ultimately a subjective decision
(Friedman et al., 2001). We chose to use both internal
and external evaluation.
2.4.3 Our Approach
Hierarchical and k-means clustering solutions were
internally validated using the gap, silhouette, and CH
criteria, and externally evaluated using the OKS-PS
score. As explained in section 1.3, the OKS-PS is a
function of the features included in the model, where
for subject ,
OKS-PS
.
The underlying notion here is that the optimal
clustering solution will lead to the best separation
between the OKS-PS distributions belonging to
subjects in the k subgroups. In particular, the OKS-PS
distribution for the poor-outcomes cluster should be
distinct from the OKS-PS distributions for the other
clusters. The poor-outcomes cluster is the group of
patients with the worst or lowest OKS-P scores and
hence the lowest OKS-PS scores. These patients are
expected to have the most pain.
We defined a heuristic criterion for evaluating
results using the OKS-PS: the optimal clustering
solution is the solution that results in the greatest
distinction, or least overlap, between the poor-
outcomes cluster and the other clusters.
2.4.3.1 Estimating Overlap
We used two approaches to estimate the similarity
between OKS-PS distributions.
The degree of overlap between two distributions was
estimated using the Kullback-Leibler (KL)
divergence metric (a measure of the joint entropy or
common information contained in two distributions,
and
must be non-negative and is
given by
where
, if
.
Ideally, for the solution corresponding to
the
overlap between the OKS-PS distributions of the
poor-outcomes cluster and the other clusters would be
minimised and the KL divergence would be
maximised, i.e.,
.
We considered both the average between the
OKS-PS distributions of the poor-outcomes cluster
and all other clusters, and the smallest , i.e the
between the OKS-PS distributions of the poor-
outcomes cluster and the cluster most similar to it.
The measure was defined to be the proportion
of subjects from another cluster whose OKS-PS was
within the range of the OKS-PS values for the poor-
outcomes cluster. Ideally, there would be no overlap
between the two distributions, and this proportion
would be 0, i.e.,
.
2.4.3.2 Error Search Method
The search for
can be conducted using different
rules. For a given evaluation criterion, we can
compute the error and search for the global
minimum error (method A):
.
Alternatively, we can search for the greatest
change in error (method B):
, where
, for .
As with the evaluation criteria, the choice of
search method is arbitrary. We show results using
both methods.
An Unsupervised Learning Model for Pattern Recognition in Routinely Collected Healthcare Data
269
5
3 RESULTS
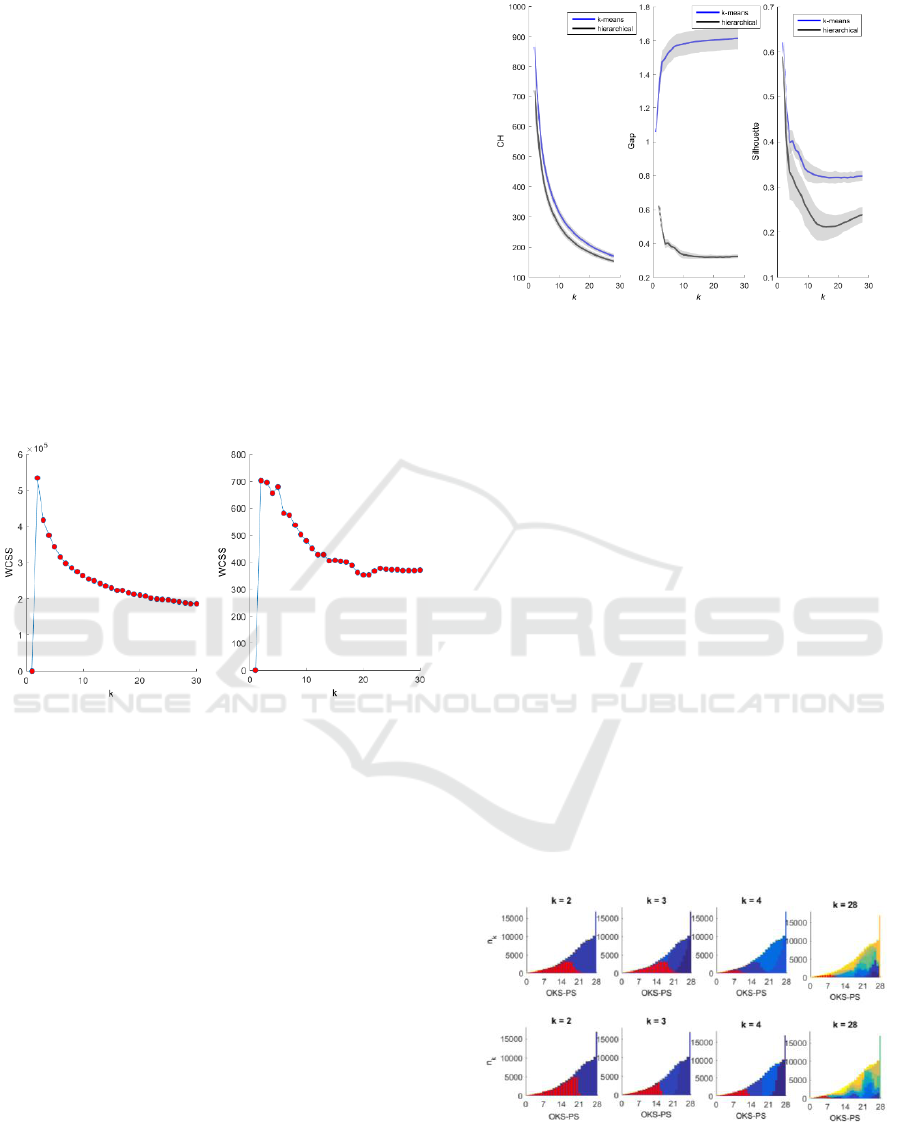
Figure 2 shows the using k-means and
hierarchical clustering. For both methods, was
lowest at k = 1, rose sharply at k = 2, then decreased
exponentially as the number of clusters increased. As
there was no distinct drop or “elbow” point,
has limited use as an evaluation criterion here.
There is no theoretical upper limit on candidate k.
However, the clustering solution is seeking an
optimal number of clusters within patients according
to pain groups, and the OKS-PCS has a minimum
value of 0 and a maximum value of 28. We therefore
applied a limit of = 28. Internal and external
evaluation of the hierarchical and k-means clustering
algorithms was conducted to derive k clusters, where
k = 2:28. Distances were measured using Euclidean
distance measure.
Figure 2: Within-cluster sum of squares (WCSS) plotted
against k, the number of candidate clusters, for k-means
(left) and hierarchical clustering (right).
3.1 Internal Evaluation
For a dataset of size n, internal evaluation involves a
calculation of size n x n x k. Internal evaluation
therefore cannot be directly applied to a dataset as
large as ours. We based the internal evaluation on a
random sample of 1,000 subjects from the dataset and
repeated the random sampling 100 times. Figure 3
shows the average results over 100 iterations. Higher
Gap, Silhouette, and CH values indicate better within-
cluster homogeneity and inter-cluster separation. The
k-means and hierarchical clustering produced similar
solutions using the CH (Figure 3, left plot) and
Silhouette (Figure 3, right plot) criteria, but dissimilar
solutions using the Gap criterion (Figure 3, centre
plot).
Figure 3: Internal evaluation of hierarchical (black) and k-
means (blue) clustering solutions using the CH (Calinski-
Harabasz) (left), Gap (centre), and Silhouette (right)
criteria.
3.2 External Evaluation
Figure 4 shows the OKS-PS distributions for each
cluster. At k = 2, the OKS-PS distributions for the two
clusters largely overlapped one another. As k
increased, the degree of overlap between the
distributions of the resultant clusters decreased. The
cluster with a corresponding OKS-PS distribution at
the lower end of the scale is the poor-outcomes
cluster.
Figure 5 shows that as k increased, decreased
(left-most plot) and that the average KL between the
poor-outcomes cluster and all other clusters increased
(i.e., the overlap in their OKS-PS distributions
decreased) (centre plot). Both these results are
intuitive. However, the smallest KL measure (right
plot) seems to suggest that the similarity between the
poor-outcomes cluster and the most similar cluster
increases with k, but beyond that it has limited use in
deriving the optimal k.
Figure 4: OKS-PS distributions for clusters derived using
hierarchical clustering (top panel) and k-means clustering
(bottom panel). The y-axis shows the number of patients in
the k-th cluster, and the x-axis shows the corresponding
OKS-PS score. Colours represent clusters. The distribution
of the poor-outcomes cluster is highlighted in red.
HEALTHINF 2018 - 11th International Conference on Health Informatics
270
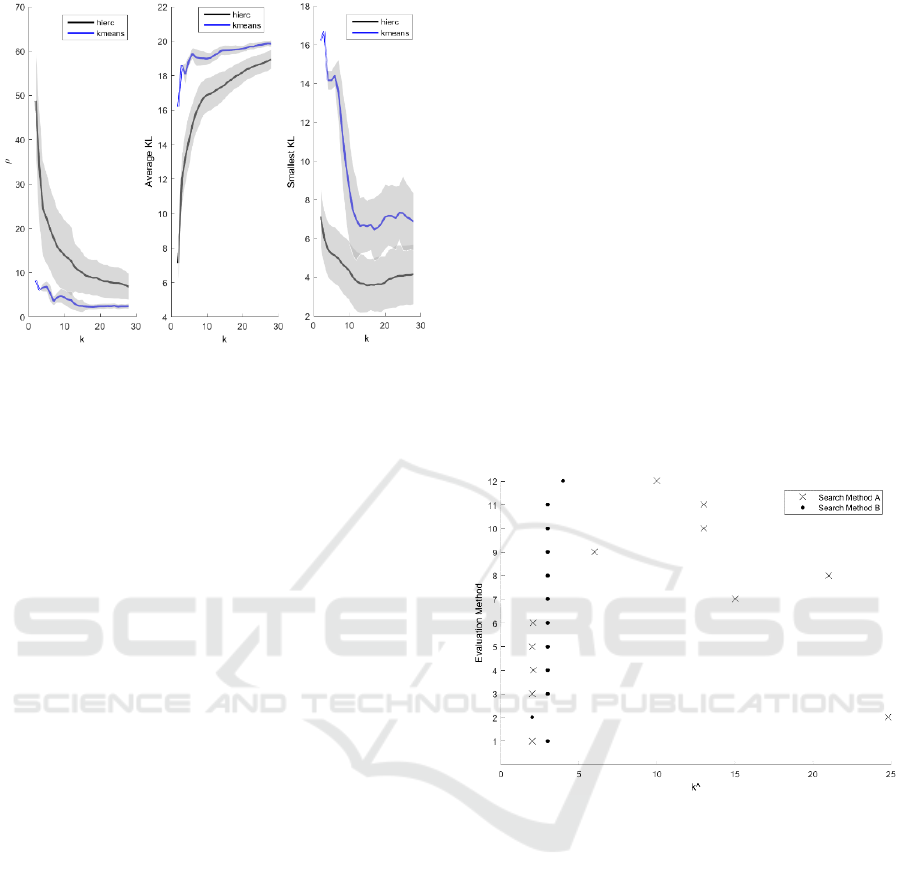
Figure 5: External evaluation of hierarchical (black) and k-
means (blue) clustering solutions. ρ is the proportion of
subjects from another cluster whose OKS-PS was within
the range of the OKS-PS values for the poor-outcomes
cluster (left). The average Kullback-Leibler (KL)
divergence (centre) refers to the average of the KL
divergence between the OKS-PS distribution of the poor-
outcomes cluster and the OKS-PS distributions of all other
clusters. The smallest KL divergence (right) refers to the
smallest KL divergence between the OKS-PS distribution
for the poor-outcomes cluster and the OKS-PS distributions
of all other clusters.
3.3 Optimal Clustering Solution
Figure 6 shows the optimal clustering solutions from
Figures 3 and 4, using the two error search methods
described in section 2.4.3.2. When the global
minimum error (method A) was used, the different
criteria suggested a wide range of
, from
to
8, suggesting that this may be not be the
appropriate search criteria here. When the greatest
change in error (method B) was used, most criteria
suggested
= 3, with the lowest suggested
and
the highest
4. As 10 out of 12 methods agreed on
= 3, it appears that the subjects in our dataset can be
optimally separated into three groups.
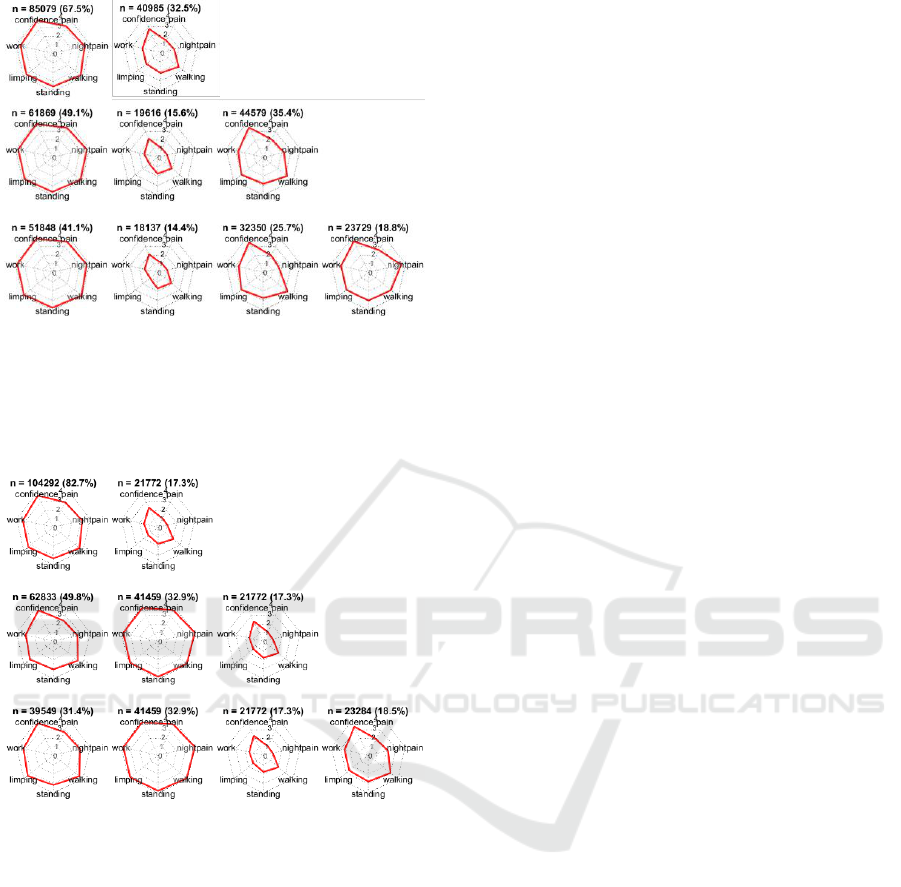
Figure 7 shows the distribution of features in the
clusters according to
= 2,
= 3, and
= 4, obtained
using k-means clustering. At
, one cluster
(containing 67.5% of the patients) represented
patients with an average OKS-P score > 3 for all
seven questions, and the other cluster represented
(32.5%) patients who reported for most
questions. At
, the three clusters represented
patients who reported average OKS-P score
,
OKS-P score and OKS-P score . At
, the OKS-P range for the poor-outcomes cluster
(OKS-P score ) did not change, suggesting that
is sufficient to obtain a “stable” description of
this poor-outcomes cluster, and also that for
,
the poor-outcomes cluster summary OKS-PS score
.
The clusters obtained using hierarchical clustering
appear similar to those obtained using k-means
(Figure 8). Here it may be seen that the poor-
outcomes cluster has the same range (OKS-P score
) and number of patients (n = 21,772) at
= 2,
=
3, and
= 4, suggesting that the poor-outcomes
cluster is indeed distinct.
Finally it may be seen that the poor outcomes
cluster obtained using k-means clustering contains
15.6% and 14.4% of all patients at
and
, respectively, and 17.3% using hierarchical
clustering (at
= 2,
= 3, and
= 4) which agrees
with literature on prevalence of poor-outcomes after
knee replacement surgery as being up to 20%
(Beswick et al., 2012).
Figure 6: Proposed
(x-axis) obtained using different
evaluation methods (y-axis): 1-3 refer to internal evaluation
of k-means clustering using the CH, gap, and silhouette
criteria, respectively; 4-6 refer to internal evaluation of
hierarchical clustering using the CH, gap, and silhouette
criteria, respectively; 7 - 9 refer to external evaluation of k-
means using the ρ, average KL, and smallest KL criteria,
respectively; and 10 - 12 refer to external evaluation of
hierarchical clustering using the ρ, average KL, and
smallest KL criteria, respectively; The results of searching
for the global minimum error (search method A) are shown
in crosses and when searching for the greatest change in
error (search method B) are shown in circles.
An Unsupervised Learning Model for Pattern Recognition in Routinely Collected Healthcare Data
271
7
Figure 7: Distribution of the average OKS-P score within a
cluster, corresponding to the features included in the model,
obtained using k-means clustering. The clusters
corresponding to k = 2, k = 3, and k = 4 are shown in the
top, middle, and bottom panels, respectively. The number
(n) and percentage (%) of patients in each cluster is shown.
Figure 8: Distribution of the average OKS-P score within a
cluster, corresponding to the features included in the model,
obtained using hierarchical clustering. The clusters
corresponding to k = 2, k = 3, and k = 4 are shown in the
top, middle, and bottom panels, respectively. The number
(n) and percentage (%) of patients in each cluster is shown.
4 DISCUSSION
Evaluating a cluster analysis solution is challenging,
as the optimal number of clusters is not known a-
priori.
Objective evaluation criteria may be appropriate
for some algorithms and applications, but not for
others. This limitation of internal evaluation was
demonstrated in Figure 3 (centre plot) – while the
hierarchical clustering solution suggested a decrease
in the Gap criteria with an increase in k, the k-means
algorithm produced an increase in the same with
increasing k. Consequently, the global minimum
method for error minimisation (method A) suggested
some extremely high values as the optimal k
(Figure 6) including values as high as
, and
, which seem clinically implausible,
suggesting that the gap criteria is perhaps not an
appropriate evaluation criteria for use in combination
with k-means clustering for our application.
We evaluated solutions using both internal and
external evaluation approaches, and assessed results
in view of the context, rejecting clinically implausible
solutions.
The choice of clustering algorithm, evaluation
criteria, and error minimisation method are all
important considerations, and the ideal combination
is specific to the application. Hence, as demonstrated
in this paper, several approaches should be compared
in light of clinical knowledge and context.
The external evaluation criteria devised in this
study is rooted in the clinical background that there
exists a poor outcomes cluster which is distinct from
other patients based on the distribution of their OKS-
P. The external evaluation criteria we used were
therefore based on the requirement for a clustering
solution that optimally separates the poor outcomes
cluster from other clusters. Given a different context,
other external criteria could be adopted.
The algorithms used in this study assign subjects
to a specific cluster. In future work, we intend to
propose an extension of these methods to perform a
form of “soft” clustering and assign a probability of
cluster membership.
5 CONCLUSIONS
We have demonstrated the application of unsuper-
vised learning and associated challenges to a large
representative routinely collected healthcare dataset.
Key considerations during cluster analysis such as
choice of clustering algorithm and evaluation criteria
have been described and the implications of
subjective choices have been demonstrated. The
model described here has been tailored to the UK
NHS PROMs database. However, it is scalable and
may be extended to other applications of learning in
the absence of labels or for detecting patterns and
groupings in large datasets, within healthcare and
beyond.
HEALTHINF 2018 - 11th International Conference on Health Informatics
272

ACKNOWLEDGEMENTS
The STAR programme is funded by the UK National
Institute of Health Research (NIHR) Programme
Grant for Applied Research.
Further acknowledgements removed for review
purposes.
DISCLAIMER
This paper presents independent research funded by
the National Institute for Health Research (NIHR)
under its Programme Grants for Applied Research
programme (RP-PG-0613-20001). The views
expressed are those of the author(s) and not
necessarily those of the NHS, the NIHR or the
Department of Health.
REFERENCES
Beswick, A. D., Wylde, V., Gooberman-Hill, R., Blom,
A. & Dieppe, P. 2012. What Proportion of Patients
Report Long-Term Pain After Total Hip or Knee
Replacement For Osteoarthritis? A Systematic Review
of Prospective Studies In Unselected Patients. BMJ
Open, 2, E000435.
Chen, M., Langan, S. & Benchimol, E. 2016. Routinely
Collected Electronic Health Data And STI Research:
RECORD Extension To The STROBE Guidelines.
BMJ Publishing Group Ltd.
Dawson, J., Fitzpatrick, R., Murray, D. & Carr, A. 1998.
Questionnaire on the Perceptions of Patients About
Total Knee Replacement. J Bone Joint Surg Br,
80, 63-69.
Dunn, K. M., Jordan, K. & Croft, P. R. 2006. Characterizing
The Course of Low Back Pain: A Latent Class Analysis.
American Journal of Epidemiology, 163, 754-761.
Friedman, J., Hastie, T. & Tibshirani, R. 2001. The
Elements of Statistical Learning, Springer Series In
Statistics New York.
Harris, K., Dawson, J., Doll, H., Field, R. E., Murray, D.
W., Fitzpatrick, R., Jenkinson, C., Price, A. J. & Beard,
D. J. 2013. Can Pain And Function Be Distinguished In
The Oxford Knee Score In A Meaningful Way? An
Exploratory and Confirmatory Factor Analysis. Quality
of Life Research, 22, 2561-2568.
Hay, S. I., George, D. B., Moyes, C. L. & Brownstein, J. S.
2013. Big Data Opportunities For Global Infectious
Disease Surveillance. Plos Medicine, 10, E1001413.
Jones, C. A., Voaklander, D. C., Johnston, D. & Suarez-
Almazor, M. E. 2000. Health Related Quality Of Life
Outcomes After Total Hip And Knee Arthroplasties In
A Community based Population. The Journal of
Rheumatology, 27, 1745-1752.
King, B. 1967. Step-Wise Clustering Procedures. Journal
of The American Statistical Association, 62, 86-101.
Kongsted, A. & Nielsen, A. M. 2017. Latent Class Analysis
In Health Research. Journal of Physiotherapy,
63, 55-58.
Lacey, R., Strauss, V., Rathod, T., Belcher, J., Croft, P.,
Natvig, B., Wilkie, R. & Mcbeth, J. 2015. Clustering of
Pain and Its Associations With Health In People Aged
50 Years and Older: Cross-Sectional Results From The
North Staffordshire Osteoarthritis Project. BMJ Open,
5, E008389.
Murdoch, T. B. & Detsky, A. S. 2013. The Inevitable
Application of Big Data To Health Care. Jama, 309,
1351-1352.
Murray, D., Fitzpatrick, R., Rogers, K., Pandit, H., Beard,
D., Carr, A. & Dawson, J. 2007. The Use of The Oxford
Hip And Knee Scores. Bone & Joint Journal, 89, 1010-
1014.
Nice 2016. Data Science For Health and Care Excellence:
Harnessing The UK Opportunities For New Research
and Decision-Making Paradigms. National Institute For
Health and Care Excellence.
NJR 2016. National Joint Registry for England and Wales.
13th Annual Report.
The Academy Of Medical Sciences, U. 2017. Enhancing
The Use of Scientific Evidence to Judge The Potential
Benefits and Harms of Medicines.
Wylde, V., Hewlett, S., Learmonth, I. D. & Dieppe, P.
2011. Persistent Pain After Joint Replacement:
Prevalence, Sensory Qualities, and Postoperative
Determinants. PAIN®, 152, 566-572.
An Unsupervised Learning Model for Pattern Recognition in Routinely Collected Healthcare Data
273
