
The Effect of Service Quality Dimensions on Student Satisfaction
in Higher Education X
Friska Sipayung
1
, Endang Sulistya Rini
1
and Liasta Ginting
1
1
Department of Management Universitas Sumatera Utara, Jl. Prof.TM Hanafiah, Medan, Indonesia
Keywords: Service Quality, Satisfaction, Academic Services
Abstract: Higher Education X as part of the higher education system is faced with various challenges both in the
development of science and technology, globalization and competition with other educational institutions.
Therefore, management improvements, customer orientation, and the implementation of quality
management are demands to be able to survive and be able to compete in the future. One important step that
must be done to start making changes is the need to know how satisfied students are. This study aims to
determine and analyze the effect of service quality dimensions on student satisfaction. This research was
conducted in X college. Data collection techniques were questionnaires. Data is processed using the SEM-
Partial Least Square-Smart PLS application. The results showed that, 65.85% of student satisfaction could
be explained by lecturer competence, leadership commitment, lectures, physical facilities, supporting
facilities, administrative and student services. Lecturer competence, lectures, physical facilities, supporting
facilities, administrative services, and student affairs have a positive influence on student satisfaction.
1 INTRODUCTION
Produce qualified graduates who are able to develop
science, technology, humanities, and arts, based on
religious morality. Being able to compete at the
national and international levels, is one of the
missions of X universities. In an effort to realize the
mission and goals, without exception all faculties,
and study programs must be able to carry out their
functions and objectives. This is intended to be able
to produce qualified students who are competent in
their field. Thus, they can make good name and
image of the university, and be calculated by
prospective students, users and recruiter. Various
efforts have been carried out to improve the quality
of education services.
In accordance with the new paradigm of higher
education management as a service industry, it is
necessary to improve the quality of services.
Service quality consists of curricular services,
research services, community service, administrative
services and extra-curricular services. One form of
curricular services is the implementation of lectures,
among others: curriculum, lecture design, syllabus,
lecture material, lecture process and evaluation.
Curriculum services will be quality if supported by
adequate facilities and infrastructure. As a service
industry, customer satisfaction is an indicator of the
success of educational institutions in carrying out
their functions.
In addition, customer satisfaction is an essential
factor in the application of Total Quality
Management (TQM). Therefore, education and
training institutions in this case universities must
identify customers and their needs carefully and try
to satisfy them. The main step that must be done in
implementing Total Quality Management is to view
students as the main customers who must be served
(Ivancevich, 2014). Through sustainable service
development programs will be able to be presented
and provided educational services in accordance
with customer needs so that customer satisfaction
will be created. Higher Education X as part of the
higher education system is faced with various
challenges both in the development of science and
technology, globalization and competition with other
educational institutions.
Therefore, management improvements, customer
orientation, and the implementation of quality
management such as quality assurance, are demands
to be able to survive and be able to compete in the
future. One of the important steps that must be done
to start making changes is the need to know how
Sipayung, F., Rini, E. and Ginting, L.
The Effect of Service Quality Dimensions on Student Satisfaction in Higher Education X.
DOI: 10.5220/0010103118291836
In Proceedings of the International Conference of Science, Technology, Engineering, Environmental and Ramification Researches (ICOSTEERR 2018) - Research in Industry 4.0, pages
1829-1836
ISBN: 978-989-758-449-7
Copyright
c
2020 by SCITEPRESS – Science and Technology Publications, Lda. All rights reserved
1829

satisfied students are in academic and non-academic
services so far. Without these initial steps, it is
difficult to make further improvements. Therefore,
the purpose of this study was to find out and analyze
the factors that influence the satisfaction of college
students X. The problems are formulated as follows:
How is the influence of service quality dimensions
on student satisfaction?
2 CUSTOMER SATISFACTION
THEORY AND SERVICE
QUALITY IMPROVEMENT
Customer satisfaction according to Gerson (2014), is
"customer perception that expectations have been
met or exceeded". Based on this theory, customer
satisfaction lies in customer expectations of a
product. Customers will feel satisfied if the product
they consume is the same as the customer wants the
product. Mowen and Kotler stressed that customer
satisfaction lies in the attitude shown by customers
after they use a product that attitude can indicate
they are happy or they are disappointed. This
customer pleasure is indicated that the customer is
satisfied, on the contrary if the customer is
disappointed it can be said that they are not satisfied.
Kotler (2011) argues that: Customer form
expectations about the value and satisfaction that
market offers will deliver and buy accordingly.
Satisfied customers buy again and tell others about
their good experience. The theory states that
customers who are satisfied with a product, it is
certain that the customer will make a repeat
purchase. And the other thing that is done by a
satisfied customer is word of mouth marketing about
an experience that satisfies him. Customer
satisfaction is a situation where the wishes,
expectations, and needs of customers are met. While
a service is considered satisfactory if the service can
meet customer needs and expectations. So the
relationship between satisfaction and service quality
is: if the quality of service is high or high, customer /
customer satisfaction will increase or be high. In
other words, the customer / customer will be
satisfied or very satisfied if the quality or quality of
service can be trusted, relied on and tested.
Satisfaction and quality of service delivery are two
inseparable things. Some experts have succeeded in
identifying the 10 main factors that determine
service quality, including: reliability,
responsiveness, competence, access, courtesy,
communications, credibility, security, understanding
/ knowing the customer and tangibles.
Referring to these definitions, student
satisfaction means a feeling of pleasure, satisfaction
and the relief of learners in higher education for
what they need during the study. Students are said to
be customers because he pays education services to
study. This is certainly accompanied by the desired
expectations in the education process such as
service, facilities, quality of lecturers, and
leadership. Referring to these expectations, of
course, every student has different perceptions from
one another. There are those who perceive with high
standards so that they cannot be fulfilled by the
institution, some are moderate and some are low.
3 MEASUREMENT OF
CUSTOMER SATISFACTION
In measuring customer satisfaction Kurtz and Louis
(2009) argue that: “Satisfaction can be measured in
terms of the gaps between what customers expect
and what they perceived they have received. This
theory can be concluded that real satisfaction can be
measured, by looking at customer expectations of a
product and how the company meets these
expectations. If positive results and customers feel
fulfilled, then it can be said that customers are
satisfied. Zeithaml, Mary and Gremler (2013) argue
that:“Customer satisfaction is influenced by spesific
product or service features, perception of product
and service quality, and price”. According to this
theory that customer satisfaction can be influenced
of product specifications , there is a perception of a
product and service quality and how much the
company gives to the product. Dann argue that:
Customer loyalty is seen by Whitwell, Lukas and
Doyle (2003) as being influenced by satisfaction
with the quality of the value offering, which in turn
is affected by five factors: (1) Realiability(2)
Responsiveness (3) assurance(4) empathy (5)
tangibles.
4 RESEARCH METHODS
4.1 Research Location, Samples and
Data Collection Techniques
This research was conducted in X college, with a
total sample of 640 students with proportional
randomized composition based on the Faculty. Data
ICOSTEERR 2018 - International Conference of Science, Technology, Engineering, Environmental and Ramification Researches
1830

collection techniques in this study are questionnaires
or questionnaires
.
4.1 Analysis Technique
The research data was processed using the SEM -
Partial Least Square (PLS) application of the
SmartPLS application. Measurement of satisfaction
using the Likert-Scale based on the instructions of
Riduwan and Sunarto, (2013).
4.3 Conceptual Research Model and
Research Instrument
The conceptual model in this study is a modification
of the total quality management model, while the
instrument used to measure the quality of higher
education service refers to in-depth literature review
of previous research, interviews with several
students and deans, as well as a combination of
Team Student Satisfaction FIU (2002), Ardi R
(2011) and Singgih M (2008), Wibisono, (2012).
5 RESULTS AND DISCUSSION
5.1 Identification of Service Quality
Attributes
The FGDs were conducted for students in 2016, the
materials presented were services thought out by
students, positive aspects experienced by students
during the service, negative aspects experienced by
students , ideal service in the eyes of students. Based
on the results of the FGD, there were general themes
related to the quality of higher education services.
Further review of the themes that emerge yields 62
attributes of higher education service quality.
5.2 Formulation of Service Quality
Measurement Instruments
Each statement is measured using a Likert scale with
a range of 1-5, where 1 shows strongly disagree and
5 shows strongly agree to the features in the
statement. Model Structural.Analysis
5.3 Outer Model Instrument/Analysis
Testing
Good instruments are valid and reliable instruments.
To test the validity and reliability of an instrument,
the dimensional of the instrument must be fulfilled.
The dimensional can be seen from the loading factor
of each variable. Outer model analysis is carried out
to ensure that the measurement used is feasible to be
used as a measurement (valid and reliable). Outer
analysis of this model specifies the relationship
between latent variables and their indicators. Tests
carried out on the outer model are:
5.3.1 Convergent Validity
The converging values of validity is the value of the
loading factor on the latent variable with the
indicators. Expected values > 0.6. Outer Loadings
(measurement model) or convergent validity are
used to test the uni dimensional of each construct.
According to Chin (1998), the indicator loading
factors which are greater or equal to 0.5 can be said
to be valid. SmartPLS output for loading factor gives
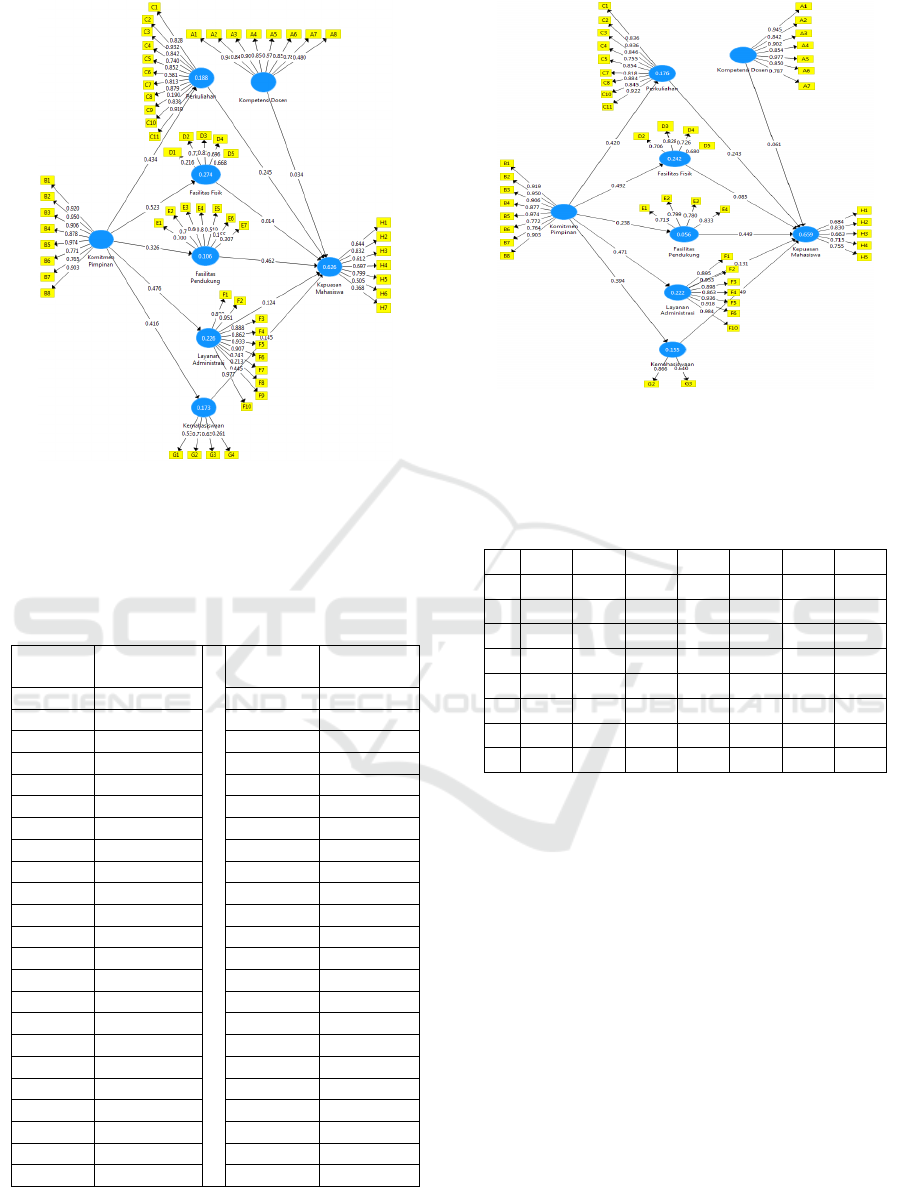
results as in Figure 1 and Table 1.
Figure 1 shows that the item A-8,C-6,C-9,D-1,E-
5,E-6,E-7,F-7,F-8,F-9,G-1,G-4,H-6 dan H-7 has a
factor loading below 0.6. Therefore, it must be
removed from the model. Thus, the model used is as
shown in Figure 2.
Validity testing for reflective indicators uses
correlations between item scores and their construct
scores. Measurements with reflective indicators
indicate changes in an indicator in a construct if
other indicators in the same construct change (or are
removed from the model). Reflective indicators are
suitable for measuring perception so that this study
uses reflective indicators. Table 2 shows that the
loading factor gives a value above the recommended
value of 0.5. The smallest value is 0.640 for the G3
indicator, namely soft skill development. This means
that the indicators used in this study are valid or
have met convergent validity. The following is a
diagram of the loading factor of each indicator in the
research model:
5.3.2 Discriminant Validity
This value is a cross loading value factor that is
useful to find out whether the construct has adequate
discriminant that is by comparing the loading values
in the intended construct must be greater than the
loading value with another construct.
The Effect of Service Quality Dimensions on Student Satisfaction in Higher Education X
1831
Source: Output SmartPLS 2017
Figure 1. Loading Diagram Factors Affecting Service
Quality Dimensions Against Student Satisfaction at
Higher Education
Table 1: Outer Model (Weights or Loadings)
Source : Output SmartPLS 2017
Source : Output SmartPLS 2017
Figure 2. Loading Diagram Factors Influencing Service
Quality Dimensions Against Student Satisfaction At
Higher Education (revised)
Table 2: Discriminant Validity
A B C D E F G
A
0.881
B
0.437 0.886
C
0.346 0.419 0.856
D
0.483 0.492 0.377 0.737
E
0.384 0.237 0.275 0.594 0.782
F
0.441 0.470 0.357 0.440 0.278 0.921
G
0.315 0.393 0.326 0.547 0.461 0.303 0.761
H
0.439 0.413 0.509 0.612 0.695 0.461 0.552
Source : Output SmartPLS 2017
From Table 3 it can be seen that the loading value of
each item on the construct is greater than the cross
loading value. From this analysis it can be stated that
there are no problems with discriminant validity.
5.3.3 Unidimensionality Test
Unidimensionality test is done by using the
Composite Reliability and Alpha Cronbach
indicators. Data that has a composite reliability > 0.7
has high reliability.
Original
Sample
Original
Sample
A
1
<- A 0.945 C
11
<- C 0.922
A
2
<- A 0.842 D
2
<- D 0.706
A
3
<- A 0.902 D
3
<- D 0.826
A
4
<- A 0.854 D
4
<- D 0.726
A
5
<- A 0.977 D
5
<- D 0.680
A
6
<- A 0.850 E
1
<- E 0.713
A
7
<- A 0.787 E
2
<- E 0.799
B
1
<- B 0.919 E
3
<- E 0.780
B
2
<- B 0.950 E
4
<- E 0.833
B
3
<- B 0.906 F
1
<- F 0.895
B
4
<- B 0.877 F
2
<- F 0.953
B
5
<- B 0.974 F
3
<- F 0.988
B
6
<- B 0.772 F
4
<- F 0.863
B
7
<- B 0.764 F
5
<- F 0.936
B
8
<- B 0.903 F
6
<- F 0.918
C
1
<- C 0.836 F
10
<- F 0.984
C
2
<- C 0.936 G
2
<- G 0.866
C
3
<- C 0.846 G
3
<- G 0.640
C
4
<- C 0.755 H
1
<- H 0.684
C
5
<- C 0.854 H
2
<- H 0.830
C
7
<- C 0.818 H
3
<- H 0.663
C
8
<- C 0.884 H
4
<- H 0.715
C
10
<- C 0.845 H
5
<- H 0.755
ICOSTEERR 2018 - International Conference of Science, Technology, Engineering, Environmental and Ramification Researches
1832
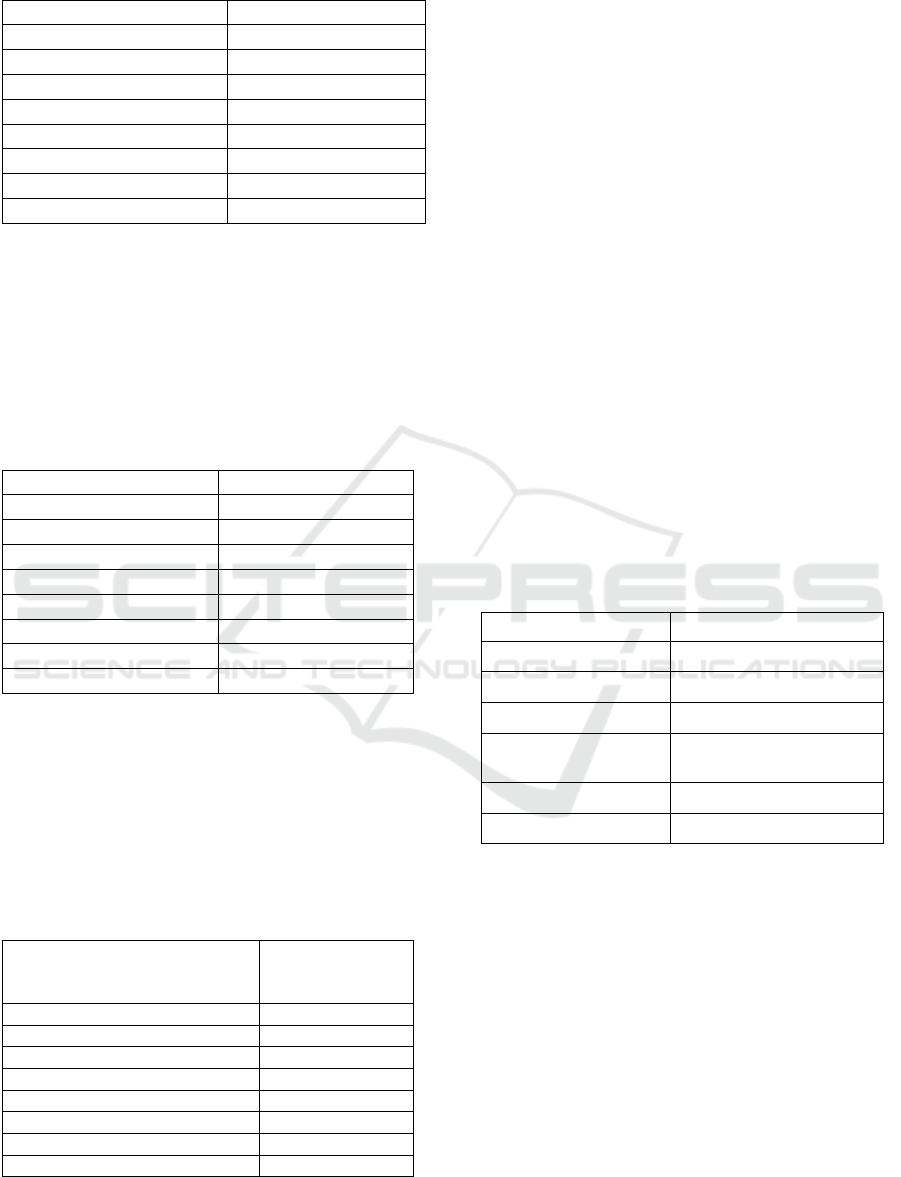
Table 3: Composite Reliability
Composite Reliability
Lecturer competence 0.9605
Leadership commitment 0.9667
Lecture 0.9611
Physical facilities 0.8257
Supporting facilities 0.8630
Administrative Services 0.9753
Student Affairs 0.7291
Student Satisfaction 0.8514
Source : Output SmartPLS 2017
Table 4. shows that all constructs have
composite reliability values above 0.7. It can be
stated that there is no reliability / uni dimensional
problem in the model formed.Cronbach Alpha.
Reliability tests are reinforced with Cronbach Alpha.
Expected values > 0.6 for all constructs.
Table 4: Cronbach’s Alpha
Cronbach’s Alpha
Lecturer competence 0.9516
Leadership commitment 0.9599
Lecture 0.9543
Physical facilities 0.7216
Supporting facilities 0.7919
Administrative Services 0.9702
Student Affairs 0.8886
Student Satisfaction 0.7807
Source : Output SmartPLS 2017
Table 4. shows that the Cronbach Alpha value
for all constructs is > 0.6, meaning that there is no
reliability / unidimensionality problem in the model
formed. Next is to look at the value of Average
Variance Extracted (AVE). Expected AVE value >
0.5.
Table 5: Average Variance Extracted (AVE)
Average
Variance
Extracted (AVE)
Lecturer competence 0.7773
Leadership commitment 0.7853
Lecture 0.7338
Physical facilities 0.5436
Supporting facilities 0.6124
Administrative Services 0.8495
Student Affairs 0.5791
Student Satisfaction 0.5356
Source : Output SmartPLS 2017
Table 5. shows that the value of Average
Variance Extracted (AVE). for all constructs is >
0.5, it means that there are no
reliability/unidimensional problems found in the
model.
5.4 Inner Model Analysis
Inner model analysis / structural analysis model is
done to ensure that structural models are built
robustly and accurately. Inner model evaluation can
be seen from several indicators which include:
The coefficient of determination (R2)
The first time is to look at the R-Square Value.
Assessment criteria for the R-Square Value are as
follows:
- R-Square value of 0.67 is categorized as
substantial
- R-Square value of 0.33 is categorized as
moderate
- R-Square value of 0.19 is categorized as weak
- R-Square value of> 0.7 is categorized as
strong (Riduan, 2013)
Here at Table 6 are the R-Square values in the
construct:
Table 6: R-Square (R
2
)
Nilai R-Square
Lecture 0.3761
Physical facilities 0.2425
Supporting facilities 0.2564
Administrative
Services
0.2817
Student Affairs 0.1551
Student Satisfaction 0.6585
Source : Output SmartPLS 2017
R-Square value of student satisfaction is 0.6585.
It can be explained that the influence of lecturer
competence variables, leadership commitment,
lectures, physical facilities, supporting facilities,
administrative services and student affairs on student
satisfaction gives a value of 0.6585 which can be
interpreted that construct variables student
satisfaction can be explained by constructing
variable lecturer competence, leadership
commitment, lectures, physical facilities, supporting
facilities, administrative and student services
65.85%. While the remaining 34.15% is explained
by other variables outside the one studied. Student
R-Square value of 0.1551 can be explained that the
influence of the leadership commitment variable on
The Effect of Service Quality Dimensions on Student Satisfaction in Higher Education X
1833
student affairs is 0.1551. While the remaining
34.15% is explained by other variables outside the
one studied.
Student R-Square value of 0.1551 can be
explained that the influence of the leadership
commitment variable on student affairs is 0.1551.
The value of R-Square Administrative Services is
0.2817 can be explained that the influence of the
leadership commitment variable on administrative
services is 0.2817. The value of R-Square supporting
facilities is 0.2564 can be explained that the
influence of the leadership commitment variable on
administrative services is 0.2564. The R-Square
value of physical facilities is 0.2425 can be
explained that the influence of the leadership
commitment variable on administrative services is
0.2425. The value of the R-Square lecture is 0.3761
can be explained that the influence of the leadership
commitment variable on lectures is 0.3761.
5.5 Hipothesis Testing
The Path Coefficient output, as shown in Table 7,
looks at the significance of the influence of each
variable. These variables are lecturer competence
variables, leadership commitment, lectures, physical
facilities, supporting facilities, administrative and
student services by looking at the parameter
coefficient (original sample).
Table 7: Path Coefficients
Original
Sample
Sample
Mean
Standard
Deviation
T
-Statistics P
Values
A->H 0.3610 0.4667 3.6673 3.6673 0.5049
B->C 0.4197 0.4086 3.3437 3.4374 0.0006
B->D 0.4924 0.4878 4.5791 4.5791 0.0000
B->E 0.2376 0.2260 1.6326 2.6326 0.1032
B->F 0.4709 0.4726 4.6506 4.6506 0.0000
B->G 0.3939 0.3916 2.7085 2.7085 0.0070
C->H 0.2426 0.2352 0.0807 3.0049 0.0028
D->H 0.0851 0.1081 0.1034 0.8230 0.4169
E->H 0.4493 0.4431 0.0889 5.0570 0.0000
F->H 0.1310 0.1385 0.0910 3.4407 0.1503
G->H 0.1495 0.1386 0.0953 2.5681 0.1175
Source : Output SmartPLS 2017
The magnitude of the parameter coefficient for
lecturer competence variables on student satisfaction
is (original sample) 0.2610 which means there is a
positive influence between the lecturers' competence
on student satisfaction. Or it can be interpreted that
the better the competency of the lecturer, the student
satisfaction will increase. The t-statistic value is
0.6673 not significant (t 5% significance table =
1.96). Therefore, the t-value of statistics is smaller
than the t-table of 1.96 (0.6673 <1.96). The
parameter coefficient for the leadership commitment
variable towards the original sample is 0.4197 which
means there is a positive influence between the
leadership commitment to the lecture. Or it can be
interpreted that the better the commitment of the
leader, the better the lecture will be. The t-statistic
value of 3.4374 is significant (t table of 5%
significance = 1.96). Therefore, the t-value of
statistics is greater than the t-table of 1.96 (3.4374>
1.96). The parameter coefficient for the leadership
commitment variable to the physical facility is
(original sample) 0.4924 which means there is a
positive influence between the leadership's
commitment to physical facilities. Or it can be
interpreted that the better the commitment of the
leader, the better physical facilities will be. The
value of t-Statistics of 2.6326 is significant (t table
of significance 5% = 1.96). Therefore, the t-value of
statistics is greater than the t-table of 1.96 (4.5791>
1.96). The parameter coefficient for the leadership
commitment variable for supporting facilities is
(original sample) 0.2376 which means there is a
positive influence between the leadership
commitment to the supporting facilities. Or it can be
interpreted that the better the commitment of the
leader, the better physical facilities will be. The
value of t-Statistics of 2.6326 is significant (t table
of significance 5% = 1.96). Therefore, the t-value of
statistics is greater than the t-table of 1.96 (2.6326>
1.96). The parameter coefficient for the leadership
commitment variable to the original administrative
service is 0.4709 which means that there is a positive
influence between the leadership commitment to
administrative services. Or it can be interpreted that
the better the leadership commitment, the better the
administrative services. The value of t-Statistics of
4.6506 is significant (t table of significance 5% =
1.96). Therefore, the t-value of statistics is greater
than the t-table of 1.96 (4.6506> 1.96). The
parameter coefficient for the leadership commitment
variable towards the original sample is 0.3939 which
ICOSTEERR 2018 - International Conference of Science, Technology, Engineering, Environmental and Ramification Researches
1834

means there is a positive influence between the
leadership commitment to administrative services.
Or it can be interpreted that the better the
leadership's commitment, the better student affairs.
The value of t-Statistics of 2.7085 is significant (t
table of significance 5% = 1.96). Therefore, the t-
value of statistics is greater than the t-table of 1.96
(2.7085> 1.96).
The parameter coefficient for lecture variables
on student satisfaction is (original sample) 0.2426
which means there is a positive influence between
the leadership commitment to administrative
services. Or it can be interpreted that the better the
leadership's commitment, the better student affairs.
The value of t-Statistics of 3.0049 is significant (t
table of significance 5% = 1.96). Therefore, the
value of t-statistic is greater than t-table 1.96
(3.0049> 1.96). The parameter coefficients for
physical facility variables on student satisfaction are
(original sample) 0.0851 which means there is a
positive influence between the leadership
commitment to administrative services. Or it can be
interpreted that the better the leadership's
commitment, the better student affairs. The value of
t-Statistics of 0.8230 is not significant (t table of
significance 5% = 1.96).Therefore, the t-value of
statistics is greater than the t-table of 1.96 (0.8230
<1.96). The parameter coefficient for supporting
facility variables for student satisfaction is original
sample 0.4493 which means there is a positive
influence between the leadership commitment to
administrative services. Or it can be interpreted that
the better the leadership's commitment, the better
student affairs. The value of t-Statistics of 5.0570 is
significant (t-table of significance 5% = 1.96).
Therefore, t-statistic value is greater than t-table 1.96
(5.0570> 1.96. The parameter coefficient for
administrative service variables on student
satisfaction is (original sample) 0.1310 which means
there is a positive influence between the leadership
commitment to administrative service. Interpreted
that the better the commitment of the leader, the
better the student affairs. T-value-Statistics of
3.4407 is significant (t table of 5% significance =
1.96). Therefore, t-statistic value is greater than t-
table 1.96 (3.4407> 1.96. The parameter coefficient
for student variables on student satisfaction is
(original sample) 0.1495 which means there is a
positive influence between leadership commitment
to administrative services. Or it can be interpreted
that the better the commitment of the leadership, the
better the student affairs. T-Statistics value of 2.5681
is significant (t-table of 5% significance = 1.96).
There is a statistic value greater than t-table 1.96
(2.5681> 1, 96.
6 CONCLUSION
1) That the leadership commitment variable has a
significant positive effect on lectures, physical
facilities, supporting facilities, administrative
services, while the positive student affairs are not
significant.
2) Whereas the variables of lecturer competence,
leadership commitment, lectures, physical facilities,
supporting facilities, administrative and student
services have a significant positive effect on student
satisfaction.
3) The most dominant variable affecting student
satisfaction is the variable supporting facilities and
then the competence of lecturers
4) The influence of lecturer competence variables,
leadership commitment, lectures, physical facilities,
supporting facilities, administrative and student
services on student satisfaction gives a value of
0.6585 which can be interpreted that the construct
variable student satisfaction can be explained by
constructing variable lecturer competence,
leadership commitment, lecturer, physical facilities,
supporting facilities, administrative and student
services 65.85%. While the remaining 34.15% is
explained by other variables outside the one studied.
Based on the results of the research, it is advisable to
X universities, namely:
1) Supporting facilities owned should be more
considered, so that student satisfaction can increase
2) Lecturer competence should be further
enhanced, for example by following training training
in accordance with the field of science
3) The number of respondents in this study is still
minimal so that the results obtained are less
representative. To further improve the quality of the
results of subsequent studies, the number of
respondents is even more
REFERENCES
Al-Rafai Adnan etall. (2016) Measuring Student
Satisfaction with Performance Enhancement
Activities: Evidence from Business Education,
International Journal of Information and Education
Technology, Vol. 6, No. 10, October.
Arikunto, Suharsimi (2013) Prosedur Penelitian, Jakarta,
PT. Rineka Cipta.
David Schüller, Martina Rašticová..(2013) Measuring
student satisfaction with the quality of services offered
The Effect of Service Quality Dimensions on Student Satisfaction in Higher Education X
1835

by universities – Central European View. Acta
Universitatis Agriculturae et Silviculturae
Mendelianae Brunensis, LXI, No. 4, pp. 1105–1112
Fakultas Kedokteran Universias Islam Indonesia Dalam
PBL (Problem Based Learning) USU, Rencana
Strategis USU 2015–2019
Garvin David.( 2003) Managing Quality: The Strategic
and Competitive Edge, Simon and Schuster.
Gerson,Richard. (2014) Mengukur Kepuasan Pelanggan:
Panduan Menciptakan Pelayanan Bermutu, Publisher,
PPM, Jakarta.
Hasnain, Manzoor (2013). Measuring Student Satisfaction
in Public and Private Universities in Pakistan, Global
Journal of Management and Business Research
Interdisciplinary, Volume 13, Global Journals Inc.
(USA).
Ivancevich John M, Konopaske, Robert ; Matteson,
Michael.(2014), Organization Behavioral
Management, New York, Mc Graw Hill, 10 th ed.
Kolb David, A.(2014) Experimental Learning: Experience
as the Source of Learning and Development, Pearson.
Second Edition.
Kotler, Philip. (2011) Marketing Management, Prentice
Hall, 14 th edition.
Kotler, Philip & Amstrong, Gary. (2014) Principles of
Marketing, Pearson, 15th ed.
Kurtz David and Boone Louis(2009) Contemporary
Marketing. Cengage Learning.
Kuswanti, Eko.(2010) “Pengaruh Antara Kebiasaan
Belajar dan Penilaian terhadap Sistem Evaluasi dengan
Prestasi Belajar Mahasiswa”. JPP Vol.8 No.1 March.
LP USU, Rencana Strategis Lembaga Penelitian
Universitas Sumatera Utara Tahun 2011 – 2015
Rahman, A. (2001) A comparative study of TQM Practice
and Organizational performance of SMEs with and
without ISO 9000 certification. International Journal
of Quality and Reliability Management.
Ramayah MR.(2009) Learning Style: Gender Influence On
Preferred Learning Style Among Business Students.
Journal of US - China Public Administration.
Riduwan dan Sunarto.(2013) Pengantar Statistika
Pendidikan, Sosial, Ekonomi, Komunikasi dan Bisnis,
Bandung, Alfabeta.
Simamora. (2014) Membuat Karyawan Lebih Produktif
DalamJangkaPanjang(Manajemen SDM). STIE
YKPN,Yogakarta.
Sopiatin, Popi (2010) Manajemen Belajar Berbasis
Kepuasan Siswa, Gramedia Indonesia, Jakarta
Supranto, J. (2011) Pengukuran Tingkat Kepuasan
Pelanggan Untuk Menaikkan Pangsa Pasar (Cetakan
Keempat). Jakarta : PT. Rineka Cipta.
Tatiana, Endang etall. (2005) Model Prestasi Akademik
Mahasiswa: Potensi Akademik Dan Gaya Belajar,
Usahawan, No 4 TH XXXIV April.
Thomas Foster. (2016) Managing Quality: Integrating the
Supply Chain, Global Edition, Pearson.
Tjiptono, Fandy and Gregorius Chandra. (2016) Service
Quality & Satisfaction. Andi Offset., Yogyakarta.
Tjiptono, Fandy. (2015) Strategi Pemasaran, 4 th ed, Andi
Offset, Yogyakarta.
Tri Bowo, E. (2008) Korelasi Antara Gaya Belajar Dengan
Prestasi Akademik Mahasiswa.
Umi Marfuah, Renty Anugerah Mahaji Puteri. (2016)
Pengukuran Tingkat Kepuasan Mahasiswa Terhadap
Pelayanan Akademik Fakultas X Universitas
Xyz,Website : jurnal, umj.ac.id/index.php/semnastek,
Vanany, etall. (2005) Perancangan dan Pengukuran
Kepuasan Mahasiswa di Perguruan Tinggi: Studi
Kasus ITS, Usahawan, No 4 TH XXXIV April.
Wibisono Yogi Y dan Nainggolan Marihot. (2012)
Pengembangan Instrumen Pengukuran Mutu Jasa
Pendidikan Tinggi, Laporan Penelitian, Lembaga
Penelitian Dan Pengabdian Masyarakat Universitas
Katolik Parahyangan, Bandung.
Whitwell Gregory, Lukas Bryan and Doyle Peter. (2003)
Marketing Management: A Value-Based Approach 1st
Edition, Wiley.
Zeithaml Valarie, Bitner Mary and Gremle. (2013),
Services Marketing, McGraw-Hill Learning Solutions.
ICOSTEERR 2018 - International Conference of Science, Technology, Engineering, Environmental and Ramification Researches
1836
