
Land Cover Analysis of Percut Watershed of North Sumatra
Province using Sentinel-2 Imagery
Bejo Slamet
1
, Melda Tiurma Sinaga
1
, Mohammad Basyuni
2
1
Department of Forest Management, Faculty of Forestry, Universitas Sumatera Utara, Jl. Tri Dharma Ujung No. 1,
Medan, Indonesia
2
Department of Silviculcute, Faculty of Forestry, Universitas Sumatera Utara, Jl. Tri Dharma Ujung No. 1, Medan,
Indonesia
Keywords: Land Cover, Use of Forest Area, Percut Watershed, Sentinel-2 Satellite Imagery.
Abstract: The purpose of this research was undertaken to identify the type of land covers and evaluate the use of
forest area in Percut Watershed using Sentinel 2 satellite imagery. Image classification in this study was
divided into 14 classes, namely forests, gardens, rice fields, oil palm, shrubs, open area, dryland agriculture,
settlements, mangroves, ponds, clouds, and cloud shadows. The value of overall accuracy obtained is equal
to 97.11%, while the kappa accuracy is 96.52%. The results of this accuracy test indicate that the land cover
classification was acceptable. The dominant land cover in the Percut watershed is forests, gardens,
settlements and oil palm plantations. The percentage of forest area in the Percut watershed is only 29.5%,
below 30% of the minimum area of good watershed criteria. The land use that not in accordance with its
ability wherein slopes above 45% were found as oil palm plantations.
1 INTRODUCTION
The land cover is important information in the
planning activities management of river basin areas.
This information needed in determining
recommendations best allocation of land use
planning. One of the watersheds in the province of
North Sumatra in critical condition is Percut
Watershed. Land use is the main problem of Percut
Watershed management, especially the use of land
without soil conservation practices.
Administratively, the Percut Watershed covers
three administrative regions, namely Karo District,
Deli Serdang Regency and Medan City. The
upstream of Percut watershed located in Karo
District and Deiserdang, while the middle and
downstream area is located in the Medan.
Identification of land use undertaken to gain
information conformity human activity to potential
and carrying capacity. The purpose of this research
was undertaken to identify the type of land covers
and evaluate the use of forest area in Percut
Watershed using Sentinel 2 satellite imagery.
2 RESEARCH AREA
DESCRIPTION AND METHODS
The study was conducted in the Percut watershed of
North Sumatra Province. Field data collection was
carried out in April 2018. Administratively the
Percut watershed area included Karo Regency,
Deliserdang Regency, and Medan City (Fig. 1).
The tool used in this study consisted of data
collection tools and data analysis tools. Field data
collection tools include global positioning system
(GPS), compass, camera, and tally sheet. Image
analysis is done using ESA SNAP and ArcGIS 10.5
software. Sentinel-2 satellite imagery used in this
study was recorded in October 2017 and Digital
Elevation Model (DEM) data used are from SRTM.
The data used in this study are tabulated in Table 1.
Sentinel-2 imagery data was obtained free from
the website www.scihub.copernicus.eu. The satellite
imagery used in this study was recorded on October
19, 2017. There is no satellite imagery with good
conditions of the study area that recorded in 2018
because of its large cloud cover.
136
Slamet, B., Sinaga, M. and Basyuni, M.
Land Cover Analysis of Percut Watershed of North Sumatra Province using Sentinel-2 Imagery.
DOI: 10.5220/0010103001360142
In Proceedings of the International Conference of Science, Technology, Engineering, Environmental and Ramification Researches (ICOSTEERR 2018) - Research in Industry 4.0, pages
136-142
ISBN: 978-989-758-449-7
Copyright
c
2020 by SCITEPRESS – Science and Technology Publications, Lda. All rights reserved
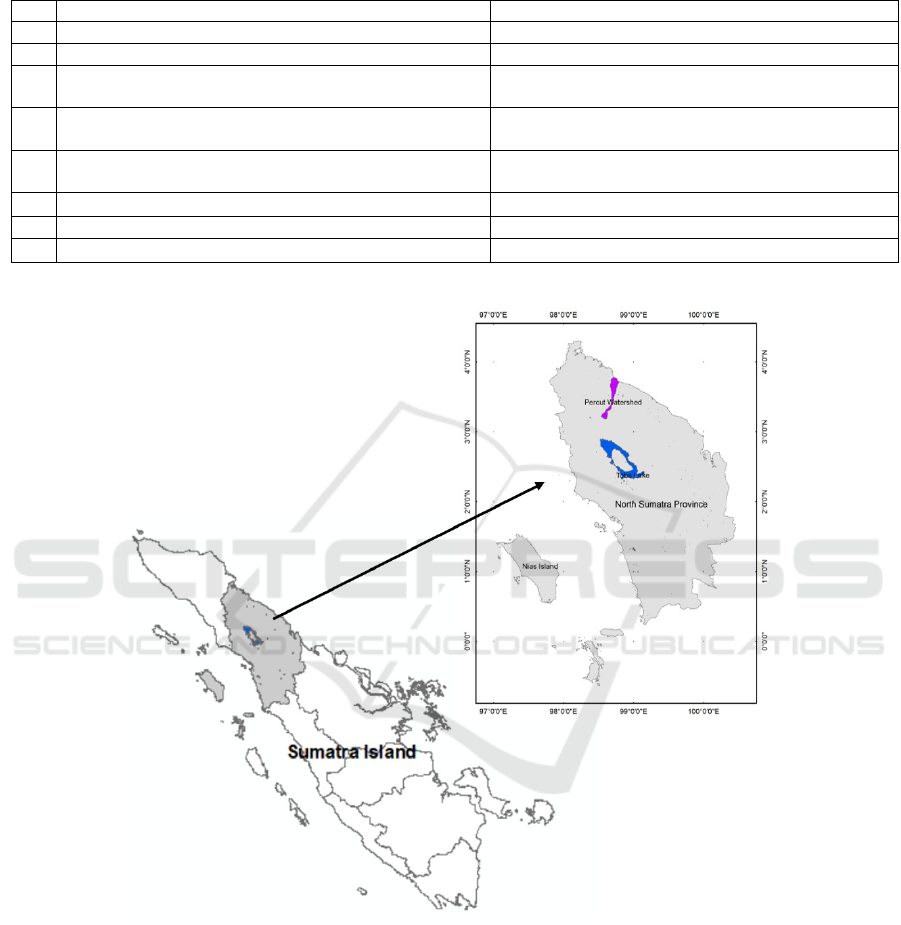
Table 1: The source of data
No Data Source
1. Ground control
p
oint GPS and di
g
ital cameras
2 Sentinel-2 Satellite ima
g
er
y
www.scihub.co
p
ernicus.eu
3. Indicative Map of Administrative Boundaries of Deli
Serdan
g
District
Central Bureau of Statistics
4. Indicative Map of Administrative Boundaries of Medan
Cit
y
Central Bureau of Statistics
5. Indicative Map of Administrative Boundaries of Karo
District
Central Bureau of Statistics
6.
Map of the North Sumatra provincial river networ
k
Ministry of Environment and Forestry
7. Map of Percut watershed boundary Ministry of Environment and Forestry
8.
Map of North Sumatra Province Forest Area
Ministry of Environment and Forestry
Figure 1: Map of Research location
Ground check data was obtained from direct
observation in the field which includes
documentation of the existing land cover, marking
of ground control point positions in the field, as well
as recording into the tally sheet. Data collection was
carried out by a survey with taking into account the
distribution of the land cover type in that area.
For the analysis of land cover, all bands in
Sentinel-2 imagery were selected. All bands from
Sentinel-2 imagery are composited together to create
a composite band image. The image composite
process was done with Arc Gis 10.3 software.
The next step is the image subset which cuts the
image with the Percut watershed boundary. The
Land Cover Analysis of Percut Watershed of North Sumatra Province using Sentinel-2 Imagery
137
image cutting process is done with Arc Gis 10.5
software.
Land cover classification conducted by
Supervised Classification method with an area of
interest (AOI) reference to the results of GPS point
taking in the Field. The method used to separate land
cover classes is the maximum likelihood.
Separation analysis is an evaluation of the
separability of training areas from each class
whether a class is worthy of merging or not. In this
study the method used is transformed divergence.
Minimum value means that it cannot be separated,
while the maximum value shows excellent
separation.
Criteria for the level of separation between
classes according to Jaya in (Jaya and Kobayashi,
1995) are as follows:
a. Unseparable: < 1600
b. Poor: 1600 - < 1800
c. Fair: 1800 - < 1900
d. Good: 1900 - < 2000
e. Excellent: 2000
Accuracy testing was used to evaluate the
accuracy of the land cover classification based on
training area of each class. The accuracy was
analysed using a contingency matrix or a confusion
matrix. The calculated accuracy consists of the
producer’s accuracy, user accuracy, overall accuracy
and kappa accuracy.
Analysis of the relationship between altitude and
slope to land cover was done by making the class the
altitude above sea level and the slope class. Altitude
and slope generated from DEM image with spatial
resolution 1 arc-second for global coverage (~ 30
meters). The DEM image was a free to download
from website https://earthexplorer.usgs.gov/.
Altitude was classified to be 5 class as shown in
Table 2. The slope was classified to be 5 class as
shown in Table 3.
Table 2: Classification of altitude
Class Altitude (m asl) Remar
k
I 0 - 300 Lowlan
d
II 300 - 600 Lowland
III 600 - 900 Hills
IV 900 - 1200 Mountains
V >1200 Mountains
Table 3: Slope classification
Class Slo
p
e
(
%
)
Remar
k
I0-8 Flat
II 8-15 Slo
p
in
g
III 15-25 Moderate
IV 25-45 Steep
V >45 Extremely steep
3 RESULT AND DISCUSSION
Image classification in this study was divided into
14 classes, namely forests, gardens, rice fields, oil
palm, shrubs, open area, dryland agriculture,
settlements, mangroves, ponds, clouds, and cloud
shadows. Field observations obtained 384 coordinate
points of existing land cover. The land cover
separability value in this study shows that all land
cover classes have good and very good separations.
The lowest separability value occurs between
bushland and plantations which has a separability
value of 1,841.06 (fair).
The results of accuracy obtained showed that
user's accuracy of the plantation was the lowest that
is 87.93%, while the highest value is in the cloud
shadow that is equal to 100%. The lowest producer’s
accuracy was found in the plantation that is 86.44%
while the highest value was found in forest land
cover that is 99.81%. The value of overall accuracy
obtained is equal to 97.11%, while the kappa
accuracy is 96.52%. The results of this accuracy test
indicate that the land cover classification was
acceptable (Jaya and Kobayashi, 1995).
The dominant land cover in the Percut
watershed is forests, gardens, settlements and oil
palm plantations. The area categorized as a bush in
the Percut watershed was found to be 6.29% of the
total watershed area (Table 4). Oil palm plantations
reach an area of 35,802.55 ha (10.44%). Dryland
agriculture reaches an area of 32,638 ha (9.52%).
Dryland forests and mangrove forest respectively
covers about 95,562.78 ha and 5,215.78 ha or about
27.93% and 1.52% from the total area of the
watershed. The percentage of forest area remains in
the Percut watershed is 29.5%. This area is still
below 30%, a minimum area of good watershed
criteria suggested by Tarigan. (2018). The spatial
distribution of land cover type in Percut Watershed
as shown in Fig. 2.
ICOSTEERR 2018 - International Conference of Science, Technology, Engineering, Environmental and Ramification Researches
138
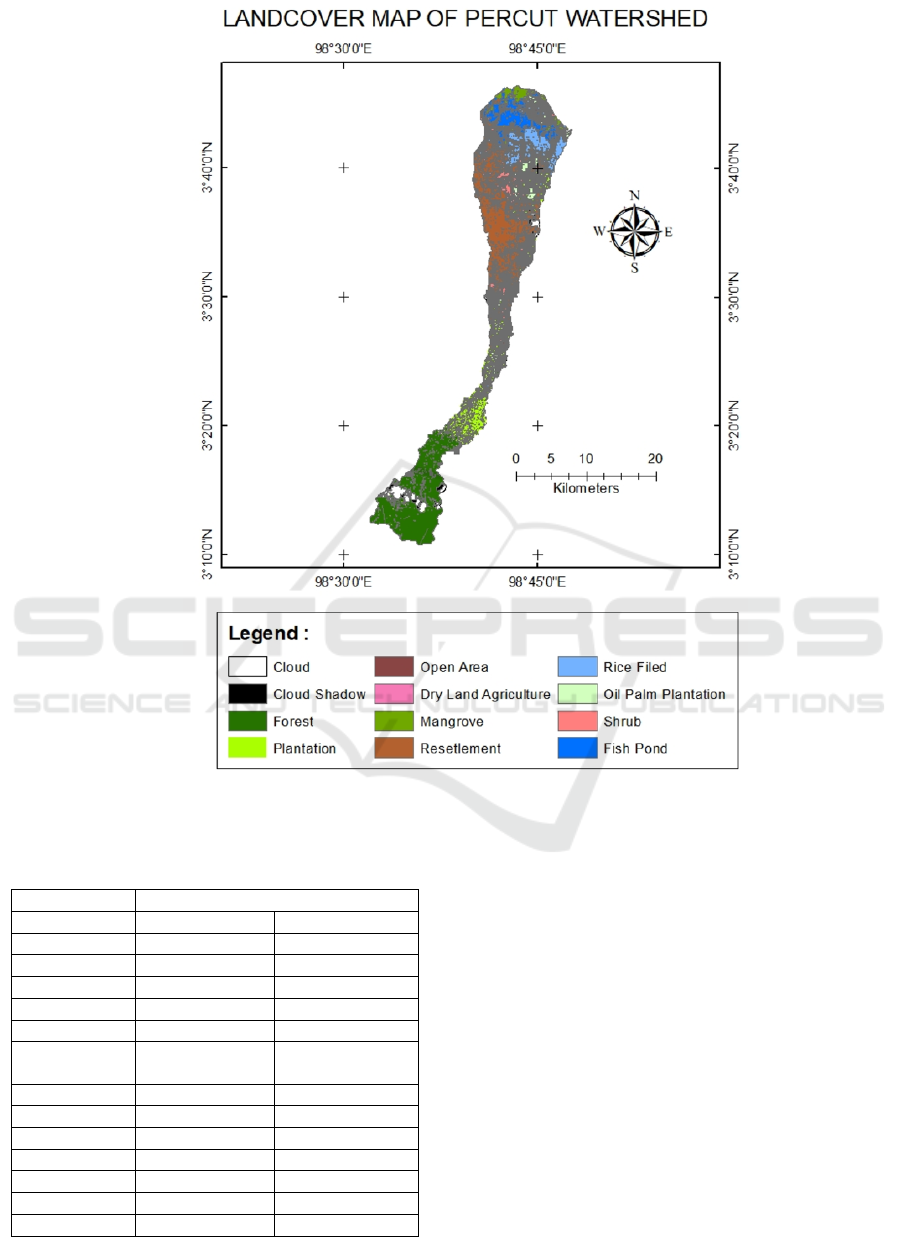
Figure 2. Land cover distribution in Percut Watershed
Table 4: Land cover in Percut Watershed based on
Sentinel-2 Imagery
Land cove
r
Area
(
hectares
)
(
%
)
Clou
d
8,497.61 2.47
Cloud shade 3,597.26 1.04
Forest 95,562.78 27.93
Plantation 66,418.38 19.38
O
p
en area 3,257.63 0.95
Dry land
agriculture
32,638.00 9.52
Man
g
rove 5,215.78 1.52
Resettlement 40,549.33 11.83
Rice fiel
d
18,890.51 5.51
Oil Pal
m
35,802.55 10.44
Shrub 21,562.89 6.29
Fish pon
d
10,707.05 3.12
Total 342,699.77 100.00
The upstream part of the Percut watershed at
altitudes above 900 meters above sea level is still
dominated by forests (Table 5). However, the
percentage of forest area identified from Sentinel-2
image analysis is still less than 30% of the total area.
This indicates that the Percut watershed categorized
to the critical watershed. The large area of oil palm
plantation must be followed by surface runoff
management (Tarigan., 2016).
This study shows the existence of land use that
not in accordance with its ability wherein slopes
above 45% there is still found the land use for oil
palm plantations in addition also found open areas
and shrubs (Table 6). This condition tends to
increase runoff and erosion coefficients, especially if
the soil and water conservation techniques are not
applied (Tarigan., 2016).
Based on the regulation of the Minister of
Land Cover Analysis of Percut Watershed of North Sumatra Province using Sentinel-2 Imagery
139
Environmental and Forestry No. SK.579/Menhut-
II/2014 concerning Forest Areas in North Sumatra
Province, we found the use of forest areas that not in
accordance with their designation. Land use for oil
palm plantations, rice fields, ponds and dryland
agriculture in forest areas was found (Table 7). The
main factor of forest conversion to oil palm
plantations is an economic reason. Susanti and
Maryudi (2016) Reported that the speed and the
direction of land conversion to oil palm expansion in
Indonesia were shaped by multiple factors.
Development narratives and poverty alleviation have
used by the various actor to build spaces and oil
palm development opportunities. The actors were
omitting the environmental services of forest to
justify oil palm extension by forest conversion. The
returns to oil palm are potentially high relative to
other activities (Papenfus, 2000).
The use of forest areas that are not in
accordance with their designation will lead to the
degradation and criticality of the Percut watershed.
Land conversions, especially from forest to others
land use tends to increase the runoff coefficient of
the watershed (Pradiko., 2015). The conversion of
forests area to oil palm plantations would lead the
soil erosion resulting in the loss of soil organic
matter (Guillaume., 2015). Soil organic matter loss
will trigger land degradation.
Table 5. Land cover based on elevation in Percut Watershed
Elevatio
n
Land cover area (hectares)
(m Asl)
Plantati
on
Open
area
Rice
field
Shrub Fish pond Mangrove Resettlement
Dry land
agriculture
Oil
palm
Forest
T
o
t
a
l
0-300
30,152.7
8
2,046.33 9,781.68 3,482.59 10,707.05 5,215.78 25,308.00 7,682.26 6,902.34 6,423.01
1
0
7
,
7
0
1
.
8
2
300-600
27,620.6
7
1,211.00 7,341.24 6,725.13
15,241.33 18,013.61 14,165.04
24,782.1
1
1
1
5
,
1
0
0
.
1
3
600-900 8,644.93
1,767.59
11,103.4
0
6,942.13 14,735.17
34,120.5
0
7
7
,
3
1
3
.
7
2
900-
1200
251.77
28,352.2
1
2
8
,
6
0
3
.
9
8
>1200
1,883.95
1
,
8
8
3
.
9
5
Total 66,418.3 3,257.33 18,890.5 21,562.8 10,707.05 5,215.78 40,549.33 32,638.00 35,802.55 95,561.7 3
ICOSTEERR 2018 - International Conference of Science, Technology, Engineering, Environmental and Ramification Researches
140
8 1 9 8 3
0
,
6
0
3
.
6
0
Table 6. Land cover based on slope class in Percut Watershed
Elevation
(%)
Land cover area
(
hectares
)
Plantation
Open
area
Rice
field
Shrub
Fish
pond
Mangrove
Resettlem
ent
Dry
land
a
g
riculture
Oil
palm
Forest
T
ot
al
0 - 8 30,570.33 1,257.63 7,426.08 8,152.78 10,707.05 5,215.78 16,931.22 6,001.04 2,407.49 7,583.61
9
6,
2
5
3.
0
1
8 - 15 28,207.46 1,103.57 8,112.78 6,689.73
16,861.39 26,118.34 19,638.50 9,455.81
1
1
6,
1
8
7.
5
8
15 - 25 7,199.86 420.12 3,267.21 4,413.70
6,462.40 266.21 4,433.70 15,324.73
4
1,
7
8
7.
9
3
25 - 45 441.06 311.67
1,321.43
454.96
5,312.41 21,836.31
2
9,
6
7
7.
8
4
> 45 164.64 1,002.67
1,572.31 37,320.87
4
0,
0
6
0.
4
9
Total 66,418.71 3,257.63 18,806.07 21,580.31 10,707.05 5,215.78 40,709.97 32,385.59 33,364.41 91,521.33
3
2
3,
9
6
6.
8
5
Table 7. The use of forest area in Percut Watershed
Forest Area
Land cover area
(
hectares
)
Forest Mangrove
Open
area
Dry land
agriculture
Plantation Residential
Rice
field
Oil
palm
Shrub
Fish
pon
d
Tota
l
Protected Forest
342 7 7 39 16 53 20 49 248 781
Production Fores
t
1 369 4 9 181 174 6
745
Limited
Production Fores
t
314 2 2 1 16
1 174 510
Conservation
Fores
t
5
105 8 7
125
Land Cover Analysis of Percut Watershed of North Sumatra Province using Sentinel-2 Imagery
141

Total 5 656 10 481 53 26 257 194 56 422
2,16
0
4 CONCLUSIONS
Sentinel-2 satellite imagery is very helpful for
identifying the land cover and the use of forest areas
in the Percut watershed. The identified forest cover
is still less than 30% of the watershed area. Land use
was found that was not in accordance with its
allocation, especially in slopes above 45% which
were used as oil palm plantations.
ACKNOWLEDGEMENTS
The authors would like to extend sincerely
appreciation to the TALENTA USU 2018 for the
financial support.
REFERENCES
Guillaume, T., Damris, M. & Kuzyakov, Y. 2015.
Losses of soil carbon by converting tropical
forest to plantations: erosion and decomposition
estimated by δ13C. Global change biology, 21,
3548-3560.
Jaya, I. N. S. & Kobayashi, S. 1995. Classification
Of Detailed Forest Types Based Upon The
Separability Algorithm: A case study in the
Yahiko Mountain and Shibata Forest Areas,
Niigata Prefecture. Journal of The Remote
Sensing Society of Japan, 15, 40-53.
Papenfus, M. M. 2000. Investing in oil palm: an
analysis of independent smallholder oil palm
adoption in Sumatra, Indonesia. Southeast Asia
policy research working paper, 15, 1-20.
Pradiko, H., Arwin, Soewondo, P. & Suryadi, Y.
2015. The Change of Hydrological Regime in
Upper Cikapundung Watershed, West Java
Indonesia. Procedia Engineering, 125, 229-235.
Susanti, A. & Maryudi, A. 2016. Development
narratives, notions of forest crisis, and boom of
oil palm plantations in Indonesia. Forest Policy
and Economics, 73, 130-139.
Tarigan, S., Wiegand, K., Sunarti & Slamet, B.
2018. Minimum forest cover required for
sustainable water flow regulation of a watershed:
a case study in Jambi Province, Indonesia.
Hydrology and Earth System Sciences, 22, 581-
594.
Tarigan, S. D., Sunarti, Wiegand, K., Dislich, C.,
Slamet, B., Heinonen, J. & Meyer, K. 2016.
Mitigation options for improving the ecosystem
function of water flow regulation in a watershed
with rapid expansion of oil palm plantations.
Sustainability of Water Quality and Ecology, 8,
4-13.
ICOSTEERR 2018 - International Conference of Science, Technology, Engineering, Environmental and Ramification Researches
142
