
Lean Manufacturing Concept: Minimizing Non-value Added
Activities in Wood Manufacturing Process
Ukurta Tarigan.
1
, Aulia Ishak
1
, Vincent Sukirman
1
, and Uni Pratama P. Tarigan
1
1
Faculty of Engineering, Industrial Engineering Department, Universitas Sumatera Utara, Medan, Indonesia
Keywords: Lean Manufacturing, Value Stream Mapping, 5W and 1H, Non-Value Added.
Abstract: PT. XYZ is a wood processing manufacturing company that produces household appliances. From the results
of monitoring to the company, it is seen that in the production process there is still a lot of waiting activities
and transport activities (non-value added activity) which leads to waste of processing time and resulting in
the longer lead time production process. Based on the problems, the lean manufacturing approach is used to
reduce non-value added activities. Through this method its analyze value-added activities and non-value
added activities with Value Stream Mapping tool then to reduce non-value added activities used 5W and 1H
principles. The study aims to eliminate non-value added activities through simplification of production
processes in order to reduce production time. After doing this research, obtained the improvement of
manufacturing lead time from the initial of 21471,76 seconds to 16352,76 seconds. Improvement by Lean
Manufacturing method also caused Process Cycle Efficiency to increase by 22 % and to increase the average
production per day by 42 units.
1 INTRODUCTION
PT. XYZ is engaged in processing wood into
furniture of household appliances such as chairs,
tables, cabinets, clothes hangers, wagons, shelves,
and others. This company uses raw material in the
form of wood brick from the wood of hull bought
from other company.
From the results of monitoring to the company, it
can be seen that in the production process there are
still many waiting activities and transportation
activities which is the non-value added activity that
leads to waste of processing time and longer lead time
production process. Therefore, it is applied to
improve production process with a lean
manufacturing approach to reduce the non-value
added activities.
The lean principle is an ongoing effort to
eliminate waste and increase the value added of the
product (Gaspersz, 2007). The lean process is
characterized by flow and prediction that overall
reduces uncertainty and confusion in manufacturing
plants (Liker, 2006). The concept of lean
manufacturing was developed to maximize the source
of utilization through minimizing disposal, then
formulated in response to a fluctuating and
competitive business environment (Sundar, 2014).
Lean Manufacturing is a philosophy that maximizes
efficiency, reduces costs, improves product quality,
and also sees the importance of how people work in
factories (Ali, 2015). Waste or waste is any human
activity that uses resources but does not create added
value (Haghani, 2015). Production at each process
must be triggered by a request from the process that
follows it (Das, 2014). Production Process of wood
processing at PT. XYZ can be seen in Figure 1.
T-1
S-1
O-1
Taken from raw
material storage
Brought to the
tapping station using
forklift
Tapping raw m aterial
T-2
Brought to the cutting
station using forklift
O-2 Cut into 40 cm in size O-3
Cut into 60 c m i n
siz e
T-3
Taken to drilling
sta tion
O-4
Drilled on parts that
will be assemblied
T-7
Brought to the
refinement station
using forklift
O-8
Conducting s anding
activity
T-8
Taken to painting
sta tio n
O-9
Pa i n te d wi t h bas ic
colour
T-9
Taken to va rnish
sta tio n
O-10
Var nishi ng
T-10
Taken to drying
sta tion
Dryi ng
T-4
Taken into f-joint
sta tion
O-5
Conducting sti cking
activity t o form a
seating wit h (40x40)
cm in si ze
I-2
Dryi ng
I-1
D-1
Stacking t apping
results
T-6
Taken to drilling
sta tio n
O-7
Drilled on pa rts that
wil l b e a sse mb lie d
D-2
Stacking dril ling
result
T-5
Taken int o dri ling
sta tio n
O-6
Drilled on pa rts that
wil l b e a sse mb lie d
D-4 Stacking all parts
O-11
Assembly the chair
parts
T-11
Taken to pa cking
sta tion
T-12
Taken to product
stor age
S-2
Keep in product
stor age
5"
700"
5" 5"
60"
15"
60"
60"
D-3
Stacking sanding
results
1200"
300"
3600"
600"
600"
600"
600"
2000"
3600"
Figure 1: Wood Processing Process Chart
208
Tarigan, U., Ishak, A., Sukirman, V. and Tarigan, U.
Lean Manufacturing Concept: Minimizing Non-value Added Activities in Wood Manufacturing Process.
DOI: 10.5220/0010076602080212
In Proceedings of the International Conference of Science, Technology, Engineering, Environmental and Ramification Researches (ICOSTEERR 2018) - Research in Industry 4.0, pages
208-212
ISBN: 978-989-758-449-7
Copyright
c
2020 by SCITEPRESS – Science and Technology Publications, Lda. All rights reserved
2 RESEARCH METHOD
The research begins with the review and data
collection at PT. XYZ. Data collected from company
documents are the production volume, and
description of the production process using direct
observation and interviews directly in the field
The data processing steps in this research are as
follows :
a. Current state map
1) Constructing the value stream manager
2) SIPOC Diagram (Supplier-Input-Process-
Output-Customer)
3) Calculation of Standard Time
4) Waste Identification using Process Activity
Mapping
5) Map Creation for Each Process Category
Throughout the Value Stream
6) Forming the Overall Factory Flow Chart
7) Calculating Process Cycle Efficiency
b. Analyzing Current State Map
1) Waste Analyzing using 5W and 1H Method
c. Improvement using Lean Manufacturing
1) Proposed Process activity mapping
2) Constructing future state map
3 RESULT AND DISCUSSION
3.1 Constructing Current State Map
The paper Current state map is a description of the
production process that takes place within the
company covering material flow and information
flow. The steps of forming the current state map are
as follows
3.1.1 Deciding Value Stream Manager
In this research, the selected value stream manager is
the production manager
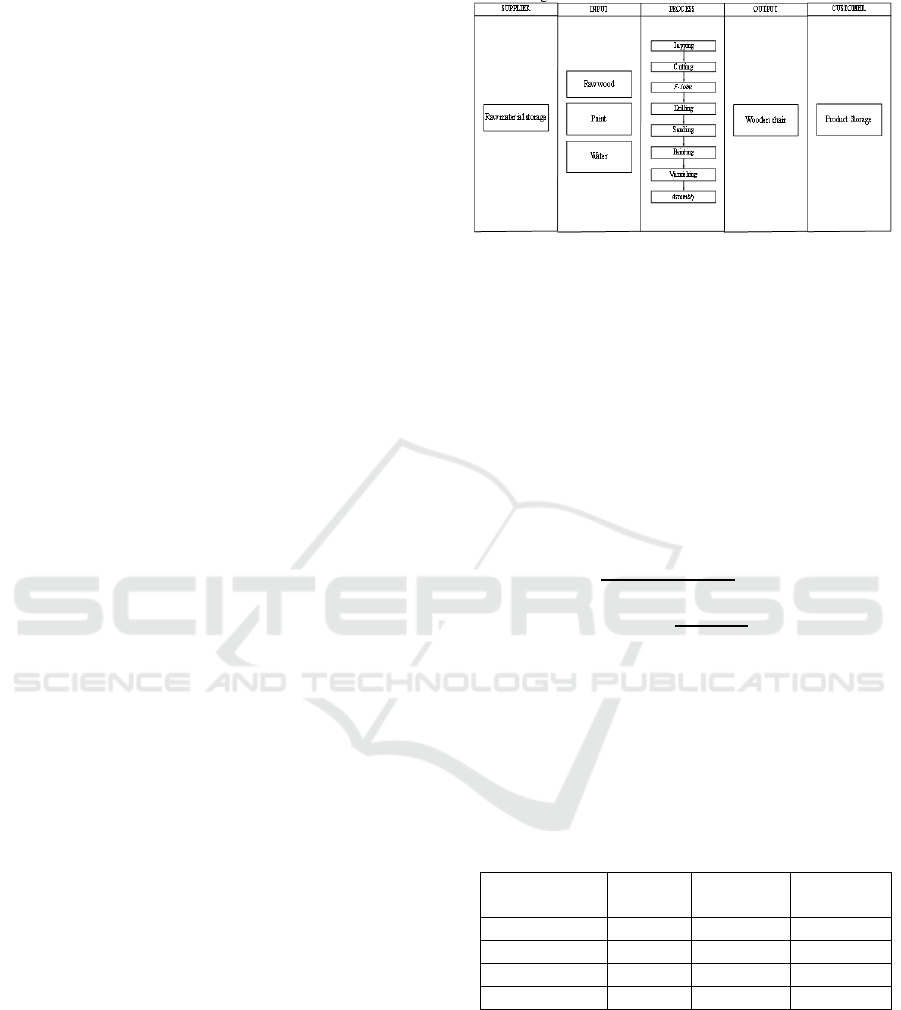
3.1.2 SIPOC Diagram (Supplier-Input-
Process-Output-Customer)
SIPOC Diagram (Supplier-Input-Process-Output-
Customer) of the wood processing production process
can be seen in Figure 2.
Figure 2: SIPOC Diagram of the Wooden Chair Production
3.1.3 Calculation of Standard Time and
Normal Time
The example of standard time and normal time
calculation for WC 1 is as follow (Sulataksana, 2005).
Normal Time =
𝐶𝑦𝑐𝑙𝑒 𝐶𝑦𝑐𝑙𝑒 𝑡𝑖𝑚𝑒 𝑥 𝑟𝑎𝑡𝑖𝑛𝑔 𝑓𝑎𝑐𝑡𝑜𝑟 (1)
= 705 x 1.04 = 733.2 sec
Standard Time =
Normal Time x
100 %
100% - Allowance %
(2)
= 733.2 x
100 %
100 % - 17%
= 883.37 sec
3.1.4 Deciding Value Stream Manager
Through process activity mapping of wooden chair
making above obtained the number of operation
process, transportation, inspection, storage and delay
along with its time can be seen in Table 1. (Vanany,
2005)
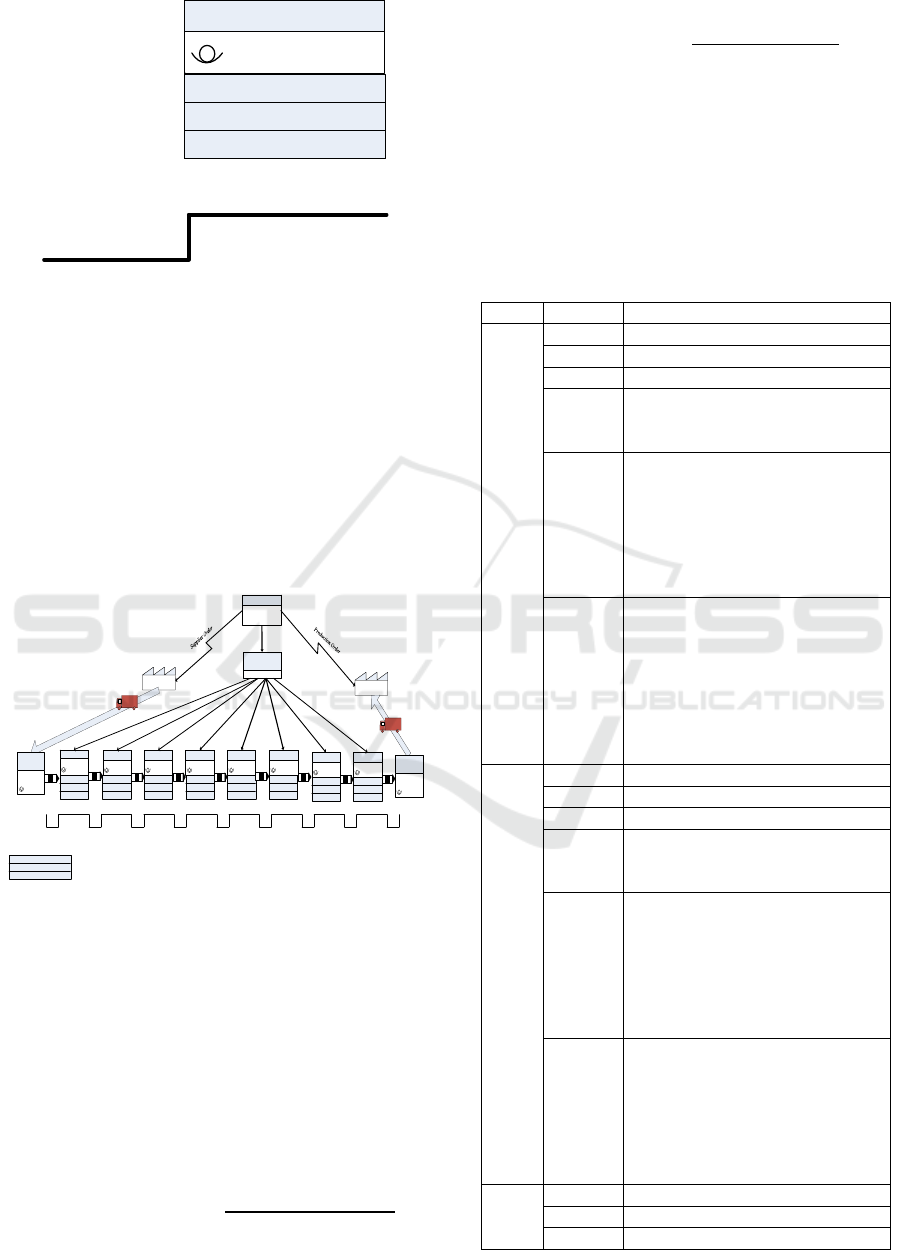
Table 1: Process Added Mapping
Symbol Amount
Time
(sec)
Percentage
(%)
Operation 11 5340 29.84
Transportation 12 6260 34.97
Inspection 2 1200 6.70
Delay 4 5100 28.49
3.1.5 Map Creation for Each Process
Category throughout the Value Stream
Mapmaking for each process category along the value
stream uses the standard time data for each process
plus other data such as processing time, and the
number of operators. a preliminary process category
map for the preparation of wooden chair production
as shown in Figure 3 (George, 2005)
Lean Manufacturing Concept: Minimizing Non-value Added Activities in Wood Manufacturing Process
209
883,37
Tapping
Op : 4
C/T : 883,37
1 shift = 8 hours
Figure 3: Map of Tapping Category
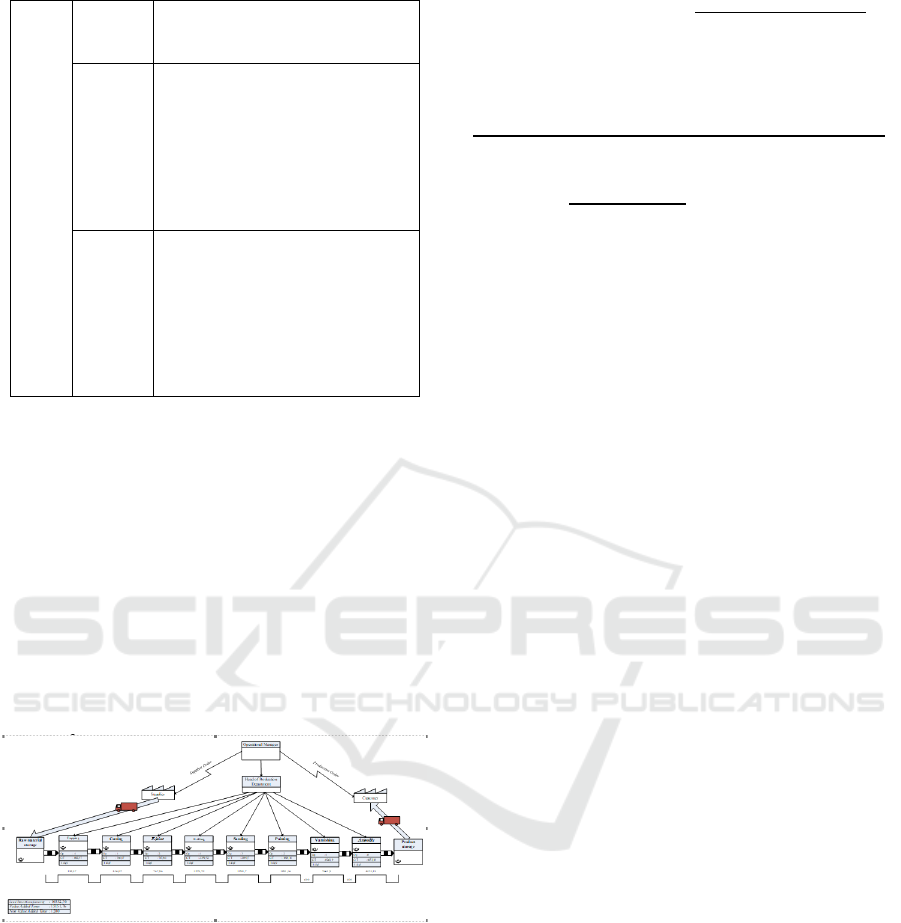
3.1.6 Forming the Overall Factory Flow
Chart
Each process along the value stream is combined with
material flow and information flow so that it becomes
a single flow in the factory. After all, information is
obtained, thus the current state map can be formed by
placing all material and information flows into the
folder.(Vanany, 2005). Current state map of wooden
chair products can be seen in Figure 4.
F-jointCutting Sanding
Op : 3
C/T : 2490,7
1 shift
Supplier
Customer
Operasional Manager
Head of Production
Department
Lead Time Manufacturing
: 21471,76
Value Added Time : 15171,76
Non Value Added Time
: 6300
Product
storage
Raw material
storage
Op : 4
C/T : 2359,52
1 shift
Op : 2
C/T : 767 ,86
1 shift
Op : 4
C/T : 346,07
1 shift
Op : 4
C/T : 882,3 7
1 shift
Tappi ng
Drilling
Painting
Assembly
Op : 8
C/T : 4 653, 18
1 shift
Op : 4
C/T : 8 261, 9
1 shift
Op : 2
C/T : 1691, 16
1 shift
Varnishing
182,37 346,07
700
767,86 1159,52 1290,7
1200 1200 600
1091,16 5661,9
2600
4653,18
Figure 3: Current State Map of Wooden Chair Product
3.1.7 Calculating Process Cycle Efficiency
The calculation of manufacturing lead time is done to
determine the condition of the original factory.
Calculation of Process Cycle Efficiency which
consists of manufacturing lead time calculation,
process cycle efficiency. The manufacturing lead
time is 21471.76 seconds. The calculation of process
cycle efficiency is as follows
Process Cycle Efficiency
(3)
= 15171.76 / 21471.76 = 0.7066 ≈ 70.66 %
Average Finishing Time
(4)
= 55200/312 = 176.92 ≈ 177 unit/day
3.1.8 Improving Activities using Lean
Manufacturing
The activities included as non-value added activity
and can be improved will be analyzed using the 5W
and 1H method which can be seen in Table 2.
Table 1: Activities Analyzing using 5W and 1H Method
Num. Analyze Information
1
What Stacking Results of the Tape
Who O
p
erato
r
Where Work center I
When
This activity is done before the
result of the tape are brought to the
cuttin
g
section
Why
This delay activity is considered
ineffective because it takes a long
time, this activity occurs because
the operator stacking the tapping
results first before being
transported due to the distance
b
etween the two remote stations
How
Activity can be minimized by
closer the tuning station and the
cutting station where the
operational manager gives
direction to the operator so that
the result of the tape can be
directly brought to the cutting
machine
2
What Stacking Drilling Results
Who Operato
r
Where Work center IV
When
This activity is done before the
drilling results are brought to the
refinement section
Why
This delay activity is considered
ineffective because it takes a long
time, this activity occurs because
the operator stacking the drilling
results first before being
transported due to the distance
b
etween the two remote stations
How
Activity can be minimized by
closer the drilling station and the
refinement station where the
operational manager gives
direction to the operator so that
the drilling results can be directly
b
rought to the refinement station
3
What Stackin
g
Refinement Results
Who O
p
erato
r
Where Work center V
ICOSTEERR 2018 - International Conference of Science, Technology, Engineering, Environmental and Ramification Researches
210
When
This activity is done before the
refinement results is brought to
the painting section
Why
This delay activity is considered
ineffective because it takes a long
time, this activity occurs because
the operator stacking the
refinement results first before
being transported due to the
distance between the two remote
stations
How
Activity can be minimized by
closer the refinement station and
painting station where the
operational manager gives
direction to the operator so that
the refinement results can be
directly brought to the painting
station
3.1.9 Future State Map Depiction
Future State Map based on the results of proposed
improvements that have been made previously.
Changes in time included are changes in time that can
be observed or estimated from the current conditions,
while for the reduced time that can be obtained such
as a reduction of transport time and wood buildup due
to the reduction of activities that can cause waste at
the time of production. Future State Map can be seen
in Figure 5 below
Figure 5: Proposed Future State Map
3.1.10 Calculating Improved Process Cycle
Efficiency
The calculation of manufacturing lead time is done to
determine the condition of the original factory.
Calculation of Process Cycle Efficiency which
consists of manufacturing lead time calculation,
process cycle efficiency. The proposed
manufacturing lead time is 16352,76 seconds. The
calculation of process cycle efficiency is as follows
Process Cycle Efficiency
= 15151.76 / 16352.76 = 0.9266 ≈ 92.66 %
Efficiency increased = 92.66 % - 70.66 % = 22 %
Production Improvement =
Actual Manufacturing Lead Time - Proposed Manufacturing Lead Time
Actual Manufacturing Lead Time
(5)
=
21471.76 - 16352.76
21471.76
= 0.2384 x 177 = 42 units
4 CONCLUSIONS
Based on the analysis result using Lean
Manufacturing approach, the delay or non-value
added the activity that occurs during the production
process of wood making affects the productivity of
the company. This can be seen where after the
improvement with lean manufacturing approach there
is a change in manufacturing lead time which initially
equal to 21471.76 seconds become 16352.76 seconds.
Improvements to the Lean Manufacturing method
with improved results for Process Cycle Efficiency
increased by 22 % and for an average daily
production increase of 42 units to 219 units per day.
REFERENCES
Gaspersz, V, 2007. "Lean Six Sigma for Manufacturing and
Service Industry, PT. Gramedia Pustaka Utama,
Jakarta.
Liker, Jefrey K., 2006, The Toyota Way, Erlangga:
Indonesia.
Sundar, R., Balaji, A., & Kumar, R. S. 2014. A Review on
Lean Manufacturing Implementation Techniques.
Procedia Engineering 97, 1875-1885
Ali, Syed N. 2015. Productivity Improvement of a
Manufacturing Facility Using Systematic Layout
Planning
Haghani. 2015. A Genetic Algorithm For solving A Multi-
Floor Layout Design Model Of A Cellular
Manufacturing System With Alternative Process
routings And Flexible Configuration, Springer.
Das, B., Venkatadri, U., & Pandey, P. ((2014)). Applying
Lean Manufacturing System to Improving Productivity
of Coil Manufacturing. Int J Adv Manuf Tech, 307-323.
Wijayanto, Bagas, dkk. 2015. “Rancangan Proses Produksi
Untuk Mengurangi Pemborosan Dengan Penggunaan
Konsep Lean Manufacturing Di PT. Mizan Grafika
Sarana”. Bandung :Institut Teknologi Nasional
(ITENAS)
Sutalaksana, Iftikar, dkk. 2005. Teknik Perancangan Sistem
Kerja. Bandung: ITB.
Lean Manufacturing Concept: Minimizing Non-value Added Activities in Wood Manufacturing Process
211

Vanany, Iwan. 2005. “Aplikasi Pemetaan Aliran Nilai Di
Industri Kemasan Semen”. Surabaya :Institut
Teknologi Sepuluh Nopember (ITS).
George L, Michael. 2005. Value Stream Management for
the Lean Office : Eight Steps for Planning, Mapping,
Sustaining Lean Improvements in Administrative
Areas. Productivity Press.
Rother M, and Shook J. 2003. Learning to See, Value
Stream Mapping to Create Value and Eliminate Muda.
USA: The Lean Enterprise Institute, Inc.
Soenaryo, Hadi, dkk. 2015. Usulan Meminimasi Waste
Pada Proses Produksi Dengan Konsep Lean
Manufacturing Di CV.X. Bandung : Institut Teknologi
Nasional (Itenas)
ICOSTEERR 2018 - International Conference of Science, Technology, Engineering, Environmental and Ramification Researches
212
