
The M2DC Approach towards Resource-efficient
Computing
Giovanni Agosta
4
, Alessandro Barenghi
4
, Tomasz Ciesielczyk
5
, Rahul Dutta
6
,
William Fornaciari
4
, Thierry Goubier
7
, Jens Hagemeyer
2
, Lars Kosmann
3
,
Nicholas Mainardi
4
, Ariel Oleksiak
5
, Gerardo Pelosi
4
, Wojciech Piatek
5
,
Christian Pieper
1
, Mario Porrmann
2
, Daniel Schlitt
1
, and Michele Zanella
4
1
OFFIS e. V., Oldenburg, Germany
{pieper,schlitt}@offis.de
2
CITEC, Bielefeld University, Germany
{jhagemeyer,mporrmann}@cit-ec.uni-bielefeld.de
3
CEWE Stifung & Co. KGaA, Oldenburg, Germany
lars.kosmann@cewe.de
4
DEIB, Politecnico di Milano, Italy
{name.surname}@polimi.it
5
Poznan Supercomputing and Networking Center, Poland
{tomaszc,ariel,piatek}@man.poznan.pl
6
Huawei Technologies GmbH, Munich, Germany
rahul.dutta@huawei.com
7
Institut List, CEA, Paris-Saclay University, Palaiseau, France
thierry.goubier@gmail.com
Abstract. The H2020 project Modular Microserver DataCentre (M2DC) inves-
tigates, develops and demonstrates a modular, highly-efficient, cost-optimized
server architecture composed of heterogeneous microserver computing resources.
The M2DC architecture can be tailored to meet requirements from various appli-
cation domains such as image processing, cloud computing or HPC. To achieve
this, M2DC is built on three pillars. (1) The RECS|Box, a flexible server archi-
tecture fully configurable with respect to application requirements supports the
full range of microserver technologies, including low power ARM processors or
FPGA accelerators as well as high performance x86 or GPU devices. (2) Ad-
vanced management strategies as well as system efficiency enhancements (SEE)
improve the behaviour of the system during runtime, thereby addressing applica-
tion acceleration, communications and monitoring & management. Moreover, an
intelligent management module complements the middleware by proactive work-
load, thermal and power management to increase the energy efficiency. (3) Well-
defined interfaces to the software ecosystem enable easy integration of the cus-
tomized RECS|Box system into the existing data centre landscape. By integrating
into OpenStack for bare metal orchestration of the microservers, the applicability
in today’s data centre is granted. Current project results include new microserver
designs based on ARM64 and Intel Stratix 10. The document presents TCO es-
timations and baseline benchmarks to show the high potential of accelerators
for the targeted applications including image processing, Internet-of-things (IoT)
data processing and others.
150
Agosta, G., Barenghi, A., Ciesielczyk, T., Dutta, R., Fornaciari, W., Goubier, T., Hagemeyer, J., Kosmann, L., Mainardi, N., Oleksiak, A., Pelosi, G., Piatek, W., Pieper, C., Porrmann, M.,
Schlitt, D. and Zanella, M.
The M2DC Approach towards Resource-efficient Computing.
DOI: 10.5220/0008862601500176
In OPPORTUNITIES AND CHALLENGES for European Projects (EPS Portugal 2017/2018 2017), pages 150-176
ISBN: 978-989-758-361-2
Copyright
c
2019 by SCITEPRESS – Science and Technology Publications, Lda. All rights reserved

1 Introduction
New technologies including advanced mobile devices, Internet of Things (IoT), 5G
and machine learning, pose steadily increasing demands on the performance and en-
ergy efficiency of server platforms and data centres. Heterogeneous hyper-scale data
centres target these challenges with a combination of highly scalable server platforms
and integrated hardware accelerators, e.g., based on GPUs and reconfigurable hardware.
Against this background, the H2020 project M2DC (Modular Microserver Data Centre)
develops a new class of low-power TCO-optimised appliances with built-in efficiency
and dependability enhancements. The basis for these appliances is the RECS|Box,
a modular, highly-efficient, cost-optimised server architecture, seamlessly integrating
heterogeneous microservers and hardware accelerators. Built-in efficiency and depend-
ability enhancements are combined with an intelligent power management for contin-
uous optimisation of power and performance. The appliances will be easy to integrate
with a broad ecosystem of management software and fully software-defined to enable
optimisation for a variety of future demanding applications in a cost-effective way.
During last decade we face ever-growing demands for computing power and data
center resources, and, on the other hand, costs of data center operations including energy
and maintenance. To cope with it, there have been many attempts to improve efficiency
of data centres, minimise overheads, and automate management. M2DC follows this
trend, delivering improvements in servers flexibility, scale, efficiency and management.
The M2DC hardware platform enables unprecedented scalability of heterogenous re-
sources by integration of up to 27 high performance or 144 low power nodes. The
platform enables mixing various nodes such as x86 CPUs, ARM64 CPUs, FPGAs, and
GPUs (including small form factor SoCs such as NVIDIA Tegra TX2).
An important part of the M2DC platform is about the so-called System Efficiency
Enhancements (SEEs), which are building blocks offering certain functionality and in-
tegrated seamlessly into the M2DC microserver platform. SEEs usually consists of
software and hardware part, used for accelerations and efficient execution. Examples
of SEEs include built-in support for efficient encryption/decryption, task scheduling,
pattern matching, communication or more application-specific image processing.
The important feature of the M2DC microserver platform is that it provides a com-
prehensive system with a full software stack. This facilitates and speeds up server
management and integration with existing data center systems. In particular, integra-
tion with OpenStack for bare metal server management allows integration with existing
OpenStack installations and up-streaming M2DC results. As the platform may contain
a large number heterogeneous resources it requires new management methods to fully
exploit its potential. Therefore, the middleware is enhanced by a set of tools for intelli-
gent platform management including workload management based on load prediction,
intelligent power capping, and proactive thermal management.
One of the main goals of the M2DC project is to enable optimisation of its mi-
croserver platform for various classes of applications. Such platform tailored for some
use case is called an appliance. The project develops the following appliances: Cloud
(Platform as a Service), High Performance Computing, Image processing and IoT Data
Analytics. The latter two are described in this chapter (in Section 5).
151
The M2DC Approach towards Resource-efficient Computing
151

Carrier (PCIe Expansion)Carrier (Low-Power)Carrier (High-Performance)
Microserver
(High-Performance)
#1
#2
#3
Microserver
(Low-Power)
#1
#2
#3
#16
HW Accelerator /
Storage
Compute Network (up to 40 GbE)
Management Network (KVM, Monitoring, …)
High-Speed Low-Latency Network (PCIe, High-Speed Serial)
Mgmnt
HSLL
Eth
External
Connectors
RECS|Box Server Architecture
(up to 15 Carriers)
Fig. 1. Overview of the M2DC hardware platform RECS|Box.
The remaining part of this chapter is organised in the following way. In Section 2,
the M2DC hardware platform is presented including information about the overall ar-
chitecture and communication. Section 3 contains a summary of the system efficiency
enhancements (SEE) concept with some examples. In Section 4, the M2DC middleware
layer along with intelligent management solutions is described. Section 5, contains two
examples of applications, for which M2DC platform was optimised, namely image pro-
cessing and IoT data analytics. Section 6 concludes the chapter.
2 The M2DC Hardware Platform
Customers and applications for HPC and cloud appliances demand a continuous in-
crease in performance and energy efficiency. In the M2DC project, we meet these re-
quirements by developing the heterogeneous hardware platform RECS|Box that can be
tailored to specific application requirements and thus enables a significant optimization
of system efficiency and performance. Important features of the RECS|Box server are
therefore a high resource efficiency combined with high scalability, high density, and
modularity, which enables an easy adaptation of the system to the workload require-
ments of different applications [19].
The RECS|Box is a heterogeneous cluster server that allows the user to choose
between several computer architectures, network systems, network topologies, and mi-
croserver sizes. In this context, a microserver refers to an independent computer-on-
module (CoM) that integrates all components (e.g. CPU, memory, IO, and power sub-
152
EPS Portugal 2017/2018 2017 - OPPORTUNITIES AND CHALLENGES for European Projects
152

system) in a small, compact form factor for integration into a server or embedded envi-
ronment. In contrast to existing homogeneous microserver platforms that support only
a single microserver architecture, RECS|Box seamlessly integrates the full range of
microserver technologies in a single chassis, including various CPUs as well as accel-
erators based on FPGAs and GPUs. Hence, it can be used to easily set up heteroge-
neous processing platforms optimized for specific application requirements. CoMs for
all major computing platforms are available in both low-power and high-performance
versions. Like the big-little approach known from mobile processors, this can be used to
further increase energy efficiency by dynamically switching, e.g. between 64-bit ARM
server processors and 64-bit ARM mobile SoCs or between different FPGA/GPU de-
vices.
Figure 1 gives a high-level overview of the modular approach used for the de-
sign of the RECS|Box system architecture. This modularity guarantees flexibility and
reusability and thus high maintainability. Microservers are grouped on carrier boards
that support hot-swapping and hot-plugging similar to a blade-style server. Three dif-
ferent carriers are available: one integrating 16 low-power microservers, one for three
high-performance microservers, and one integrating PCIe-based hardware accelerators.
All microservers are designed based on well-established CoM form factors, which fa-
cilitates the integration of third-party microserver modules into the RECS|Box. Chassis
of two sizes are available, a 2 RU version, combining three carrier boards and a 3 RU
version, integrating up to nine carriers. Hence, up to 144 low-power microservers, 27
high-performance microservers or combinations of both can be integrated in the 3 RU
chassis. Furthermore, another 3 RU version integrating 15 carriers, resulting in 240
low-power or 45 high-performance microservers is envisioned.
For extending the compute capabilities of the RECS|Box, two new high-perfor-
mance microservers have been developed within M2DC. The first one is based on
a 64-bit ARM server processor, incorporating 32 Cortex-A72 cores operating at up
to 2.4 GHz. It integrates up to 128 GByte quad-channel DDR4 memory, running at
1866 MHz. Two 10G GbE ports with support for RDMA over Converged Ethernet
(RoCE) are used for data communication, accompanied by an additional 1 GbE port for
management purposes. For connection to peripherals or for high-speed, low-latency
communication with other microservers, up to 24 high-speed serial lanes are avail-
able. Using these high-speed links, also multi-socket configurations of the ARMv8 mi-
croserver are supported in the RECS|Box. The second new microserver comprises an
Altera Stratix 10 SoC with an integrated 64 bit quad-core ARM Cortex-A53 processor.
It provides 56 GByte dedicated DDR4 memory for the embedded CPUs as well as for
the FPGA fabric. The high-speed transceivers integrated in the FPGAs are on the one
hand used for PCIe communication with other microservers. On the other hand, they
can be used for low-latency, high-bandwidth communication between FPGA-based mi-
croservers for scaling the reconfigurable resources. A wide variety of other microservers
is available, integrating server-based computing devices as well as energy efficient com-
ponents from the mobile domain.
An important feature of the RECS|Box are its rich communication facilities, com-
prising a low-level monitoring and control network, Ethernet-based data communica-
tion and a dedicated high-speed, low-latency (HSLL) communication infrastructure (cf.
153
The M2DC Approach towards Resource-efficient Computing
153

Figure 1). The monitoring and control network manages all core functions of the plat-
form, including control of power states, system startup and shutdown as well as man-
agement of the multilevel communication infrastructure based on the application re-
quirements. Furthermore, it enables fast and easy access to more than 10,000 sensor
values that are continuously monitored by the servers in a single rack (e.g. power, volt-
age, temperature on device level, microserver level, as well as server level).
The Ethernet-based network infrastructure provides one 1 Gbit/s and one or two
10 Gbit/s network links per microserver. It is internally switched by a hierarchical,
multilevel switching infrastructure, supporting all common data centre protocols like
VxLAN, RoCE or iWARP. All carriers are connected via 40 Gbit/s links to the Ethernet
switching backbone of the backplanes, which are in turn connected to the top of the
rack switch with up to 120 Gbit/s. The RECS|Box HSLL communication infrastruc-
ture connects to the CPU-/GPU-based microservers via PCIe and to the FPGA-based
microservers via their high-speed serial interfaces. Depending on the involved commu-
nication partners, it features either Host-2-Host PCIe-based packet switching or direct,
circuit-switched switching. Additionally, connection to storage and I/O-extensions is
supported, enabling easy integration of PCIe-based extension cards like GPGPUs or
storage subsystems, which can even be shared across multiple microservers via multi-
root I/O virtualization.
In contrast to setups using the traditional non-transparent endpoint feature, which
typically leads to limited burst-lengths as well as limited scalability, the RECS|Box
server uses PCIe switches that directly support scalable Multi-Host communication.
This results in a packet-based network style communication that can be used like Eth-
ernet or Infiniband. Two main communication modes are supported, either DMA-based
data transfer that can be used like RoCE, or low latency message passing, supporting
MPI style communication.
Apart from communication based on PCIe, the RECS|Box server communication
infrastructure also supports direct links between microservers, which are switched based
on asynchronous crosspoint switches, independent from the used protocol. This feature
is of particular interest for FPGAs, which support low-level point-to-point communica-
tion that avoids the overhead of more complex protocols like PCIe. Hence, accelerators
can be combined into large virtual units, flexibly attached to CPU-based microservers.
3 System Efficiency Enhancements
System Efficiency Enhancements, SEEs for short, are a key concept of the M2DC plat-
form. They enable integration of the various levels of acceleration offered by the flex-
ibility and heterogeneity of the M2DC platform, while being invisible to applications
and middleware, except when it comes to deployment. An SEE is usually a combination
of a hardware part (an accelerator per se) and a software part. It provides certain func-
tionality in a seamless way to either an application or the platform middleware, hiding
how this SEE is implemented and accelerated. A significant goal of the SEE concept
is that it provides accelerated functions or services, without taking resources that could
be allocated to applications. A secondary goal of the SEE concept is that, depending on
154
EPS Portugal 2017/2018 2017 - OPPORTUNITIES AND CHALLENGES for European Projects
154

the domain and the class of applications expected in an appliance, an appropriate set
of SEEs can be integrated into the appliance to customize and optimise its execution.
SEEs are grouped in three categories: applications, communications, and monitor-
ing and management. The first group implements application acceleration solutions, in
a transparent way, either hidden behind a standard API (such as OpenCV or OpenSSL)
or a REST API: the application only has to use that API to be able to benefit from
the SEE. Part of that group are an image processing SEE, an encryption SEE, and two
machine learning SEEs used for benchmarking (a self-organizing map SEE [15] and a
convolution neural network SEE).
The second group implements communication acceleration; again, SEEs are placed
behind standard APIs such as MPI: any application using that communication applica-
tion interface benefits from the SEE, without any change.
The third group implements various ways of transparently improving the platform
efficiency when running applications. The group includes a sensor data aggregation
SEE, which takes care of collecting readings from all platform sensors, aggregates them
and provides a REST API to make them available. There is also a pattern matching SEE
which detects patterns over streams of system events. Furthermore, a scheduling and
allocation SEE allocates compute tasks onto heterogeneous compute resources, based
on a runtime plugin API. And, for security aspects, there is an intrusion detection SEE
which monitors incoming traffic regarding suspicious activity.
The SEE implementation reflects the heterogeneous and flexible character of the
M2DC platform. Some SEEs rely on intellectual property (IP) that utilize reconfig-
urable hardware in their implementation, others are implemented into dedicated low-
power/high efficiency resources of the platform. The OpenStack platform management
is then tasked with the deployment of the various SEEs by tracking the needed resources
associated with each SEE (hardware, topology, firmware or bitstream) and allocating
them as appropriate as possible when preparing the deployment of an application. Given
the nature of SEEs, the platform management may also allocate a pure software, non
accelerated version of the SEE if one exists. As explained above, since SEEs should not
require application resources, reconfigurable IPs for some SEEs can be integrated into
the board support package of FPGA accelerators, so that there is no need to dedicate a
precious device in order to benefit from the SEE.
The current set of SEEs is a starting point for the platform, as the M2DC consortium
envisions a future of both, a vertical market of domain specific appliances with the right
combination of SEEs for maximum efficiency, and a stream of forward-looking SEEs
bringing new benefits in efficiency and non-functional properties, such as increased
precision and security for the platform. In fact, some generic accelerator blocks for
developed SEEs could already be reused for other SEEs, which lowers the development
costs.
3.1 SEE Framework
Hardware components of M2DC are divided between compute nodes, the high band-
width / low latency interconnect, accelerators and SEE resources. SEE resources are
the hardware supporting SEEs, and they can be GPUs, FPGA (board support pack-
age) BSPs, dedicated board microcontrollers, and complete accelerators, that is FPGAs,
155
The M2DC Approach towards Resource-efficient Computing
155

GPUs, CPU+FPGA SoCs (System on a chip FPGAs integrating CPU cores, like the Al-
tera Stratix 10) and CPU+GPU SoCs (Systems on a chip with a GPU and CPU cores,
like the Nvidia Tegra TX1/2). Compute nodes are CPUs, with either large cores (Intel
Core i7 or Xeon) or smaller cores (32 ARM 64bits cores CPUs).
The various SEE nodes/SEEs combinations developed cover almost all state of the
art design flows: SEEs in HDL (Verilog/VHDL), SEEs in OpenCL, SEEs on a SoC SEE
node, SEE on a microcontroller. A significant feature of the proposed architecture is the
ability to integrate more than one SEE on a single FPGA node, as well as having the
ability to deploy application SEEs on multiple FPGAs.
3.2 Cryptography SEE
One of the fundamental application domains for data centres is represented by bulk
data encryption and decryption, as it has to be performed on the data being stored as
well as on data being transmitted or received. For this purpose, fast disk encryption
software support has been explored using GPGPUs [2].
The Cryptography SEE proposed in M2DC [4] exploits the OpenCL programming
model to realize high-performance FPGA accelerators, thus providing a viable and more
versatile alternative to the use of ad-hoc cryptographic accelerators, which are currently
available in high-end server CPUs only. OpenCL provides functional portability across
a wide range of platforms, which have recently been extended to support FPGAs. How-
ever, it is well known that performance portability is much harder to achieve. A domain-
specific analysis for symmetric encryption highlighted that even within the architectural
class of GPGPUs there are major differences, requiring an almost entire rewriting of
the encryption code to achieve optimal performance [3]. We therefore analysed the
programming practices to exploit the available high-level synthesis (HLS) tool-chains
to deploy OpenCL programs onto FPGA-based accelerators, identifying the following
best-practices:
Loop Optimization: Contrary to GPU implementations, single-work-item or single-
workgroup implementations, with accurate tuning of loop unrolling, are necessary
Cache Management: Exploiting local memory (i.e., the FPGA BRAMs) as well as
private memory (i.e., flip flops embedded in logic blocks) is critical, and must be
manually optimized via variable/register renaming
Data Allocation: Beyond standard GPU strategies of coalescing-friendly layout, HLS
compilers support automated interleaving in global memory
I/O Latency Hiding: In addition to double buffering or multiple buffering strategies
common to GPUs, multiple tasks can be employed to hide latencies
Synchronization: Since barrier synchronization is highly inefficient in FPGAs, it is
preferable to move synchronization point to the host side, contrary to the best prac-
tices of GPGPU programming
By exploiting the best practices identified, we were able to achieve energy efficiency
improvements of 22.78× with respect to pure software implementations of the nine
ISO standard block ciphers, in terms of encrypted data per Joule spent. Furthermore,
we were able to achieve throughputs bound only by the I/O capabilities of the bus
connecting the accelerator to the host. A full analysis of the throughput and energy
efficiency that can be achieved with the Cryptography SEE can be found in [4].
156
EPS Portugal 2017/2018 2017 - OPPORTUNITIES AND CHALLENGES for European Projects
156
4 Middleware and Management
The target of M2DC is to bring alternative compute nodes such as ARM processors,
FPGAs and/or GPUs together with standard x86 CPUs as pre-configured and easy-to-
use appliances into typical data centres. While the hardware is designed to be modular
and flexibly connectible with each other, there is a gap to running the actual applications
on different compute nodes, which is closed by the middleware. The M2DC middleware
bases strongly on the OpenStack approach utilizing several of its modules to connect the
heterogeneous hardware with each other as well as with the management components,
resulting in a unified system. OpenStack is the perfect base for realizing the M2DC base
appliance as it delivers much of the needed groundwork while it is also well known
and popular, thereby showing great promise for the applicability of the M2DC (base)
appliance in data centres.
4.1 OpenStack Integration
The general structure of the M2DC middleware is depicted in Figure 2. All components
which were modified or extended by project partners are marked in blue and are shortly
described below.
Nova
Ironic
Ceilometer Horizon Keystone
Glance
Neutron
Bare
Metal
Cinder
Cyborg
Valence
provides auth
monitor
provides UI
Fig. 2. OpenStack structure in the context of M2DC.
Each of these marked modules is utilized to achieve a specific goal:
– Nova is customized to schedule applications based on energy efficiency, perfor-
mance and/or thermal parameters
– Ironic is used to deploy and run applications on bare metal nodes (x86, ARM64)
157
The M2DC Approach towards Resource-efficient Computing
157

– Cyborg is extended to support M2DC hardware on bare metal accelerators such as
FPGAs
– Valence is the basis to create composable nodes (e.g. logically attaching FPGAs to
x86 nodes), while composability on M2DC hardware side is realized via Redfish
– Ceilometer is adapted to M2DC hardware to gather monitoring data, while Gnocchi
is used as storage backend
– Horizon represents the GUI frontend to showcase workload management behaviour
These components are integrated in the OpenStack workflow providing the users
with means and methods to deploy applications on the specialized M2DC hardware as
well as monitor, manage and optimize its operation. It thereby serves as a base platform
(called cloud controller) connecting the diverse services and providing additional nec-
essary functions like storage (Cinder, Swift), network (Neutron) or identity (Keystone)
management. Regarding OpenStack extensions, at least Cyborg and Valence changes
will be upstreamed to the official repositories. Other OpenStack changes are mainly
requested by the intelligent management which will be available on open source basis.
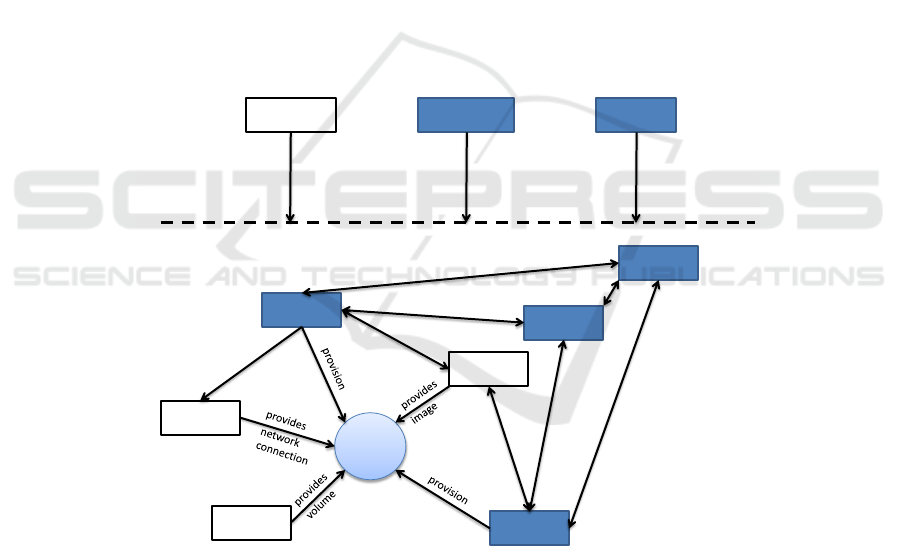
Microserver Deployment. Nova is the OpenStack component responsible for provi-
sioning applications and services – usually as virtual machines. Its interfaces (e.g. REST
API) are used to create deployment tasks for selected (application) images for which
Nova then selects an appropriate host node. As microservers have lower performance
than standard x86 servers, M2DC focusses on using bare metal provisioning, which
reduces computational overhead on host nodes while still providing flexibility in node
selection. This is where the OpenStack component Ironic comes in. While Nova still
selects the target host, Ironic is used to provision the microserver as bare metal host
node, cf. Figure 2. It will switch on the node and then boot the image using IPMI/PXE
and it will also clean up and switch off the node if it is not needed any more.
To support accelerators and SEEs (cf. Section 3), the OpenStack project Cyborg is
adapted to M2DC’s needs. Cyborg provides a general purpose management framework
for various types of acceleration resources. It has three components: (1) Cyborg agent
resides on different compute hosts and monitors them for accelerators. If an acceler-
ator is present but not set up in cyborg, agent will notify the conductor to manage it.
(2) If the accelerators are prepared for use, cyborg agent will begin monitoring their
status and reporting it to Cyborg conductor, which will use this information to assist
with scheduling and operation. (3) The Cyborg API supports the basic operations (add,
delete, update, etc.) concerning accelerators.
The Cyborg architecture is depicted in Figure 3. Cyborg agent resides on various
compute hosts and monitors them for accelerators within a periodic task. If an acceler-
ator is found it synchronizes the status with the database by either adding, deleting or
modifying the entry (done by Cyborg conductor):
For M2DC, the Cyborg component has been extended/modified as follows: (1) Im-
plementation of a driver for M2DC FPGA to retrieve accelerator data, (2) arrangement
of accelerator data using the driver to shape into existing cyborg data structure, and
(3) changes in Cyborg agent to recognize new driver invocation methods. M2DC intro-
duced a new driver for M2DC boards to recognize and extract data of those accelerators,
which are present in regions. The driver will perform command aocl diagnose to extract
158
EPS Portugal 2017/2018 2017 - OPPORTUNITIES AND CHALLENGES for European Projects
158
Cyborg Agent
Periodic
Task
Database
Deployable
records present in
database
Deployable
records present in
memory
Check in /sys/class/fpga
location and find files with
intel deployable names in
directory
Query to
the
database
Operations
Add: If deployable is present in
memory but not in database
Delete: If deployable is present
in database but not in memory
Modify: If deployable is present
in both memory and database,
then modify database record
with memory data, in case of
differences
Cyborg API
POST
DELETE
PUT
Curl command
Accelerator
records present in
memory
Accelerator
records present in
database
Operations
Add: If accelerator is present in
memory but not in database
Delete: If accelerator is present
in database but not in memory
Modify: If accelerator is present
in both memory and database,
then modify database record
with memory data, in case of
differences
Starts
Execute aocl diagnose
commands to get
informations regarding
FPGA regions
Fig. 3. Cyborg architecture and interactions.
data of all accelerators present and transfer it to Cyborg agent in a dictionary format.
This dictionary will include information regarding physical device name and board in-
formation (Alaric, Stratix 10, etc). The Cyborg agent will check in the database for the
same accelerator. If it is found, it will update the record if needed. For a new device, it
will insert a record. The same can be done by Cyborg API. Users can use it to insert
accelerator records into the database using POST. The API needs to be added in curl
command with all necessary parameters.
Composable Nodes. Rack Scale Design (RSD) means that compute, storage and net-
working hardware resources are run as disaggregated resources but they can be com-
posed on the fly to meet specific requirements in a data center or cloud. One might
compose a node with copious storage or another one that provides resources for high
performance computing.
In M2DC, RSD is achieved by using the OpenStack project Valence which is a
service for life cycle management of pooled bare metal hardware. Main concept of Va-
lence is to compose (logical) nodes by pooling hardware present in the server racks to
meet specific hardware requirements on the fly and register these to Nova. Hardware
resources can be categorized into the three main divisions: storage, compute and net-
working. Valence provides the ability to compose hardware nodes using these hardware
resources as well as to release resources as per requirements. The communication of
Valence is realized using a Redfish API. That is a handful of RESTful interfaces that
utilize JSON and OData to allow users to integrate and manage hardware resources.
159
The M2DC Approach towards Resource-efficient Computing
159

To have it working with M2DC hardware, there are some modifications of Valence
and the Redfish API necessary. (1) An algorithm which detects M2DC FPGAs and
incorporates them into RSD resources. (2) An interface to abstract the FPGA network IP
in the composed node. To make a composed node with an M2DC FPGA and computing
resources the user can get multiple network IDs for one logical node, i.e. an abstraction
is needed to make one single network ID for the logical node. (3) Extract mechanism to
identify the underlying architecture of a composed node and register the FPGA as well
as the compute node with Nova.
4.2 Intelligent Management
Next to providing orchestration functionality, M2DC middleware provides means and
methods to optimize the system behaviour concerning different aspects. Several SEEs
try to tackle specific subsystems like communication or monitoring in a preferably effi-
cient way (cf. Section 3). More general and therefore part of the M2DC base appliance
is the intelligent management (IM) module optimizing thermal and power states. Re-
source and thermal management (RTM) on the one hand considers temperatures and
power consumption for fan management and power capping activities. Workload man-
agement (WM) on the other hand looks at application-to-node allocation and tries to
adapt the resource provisioning to actual demands.
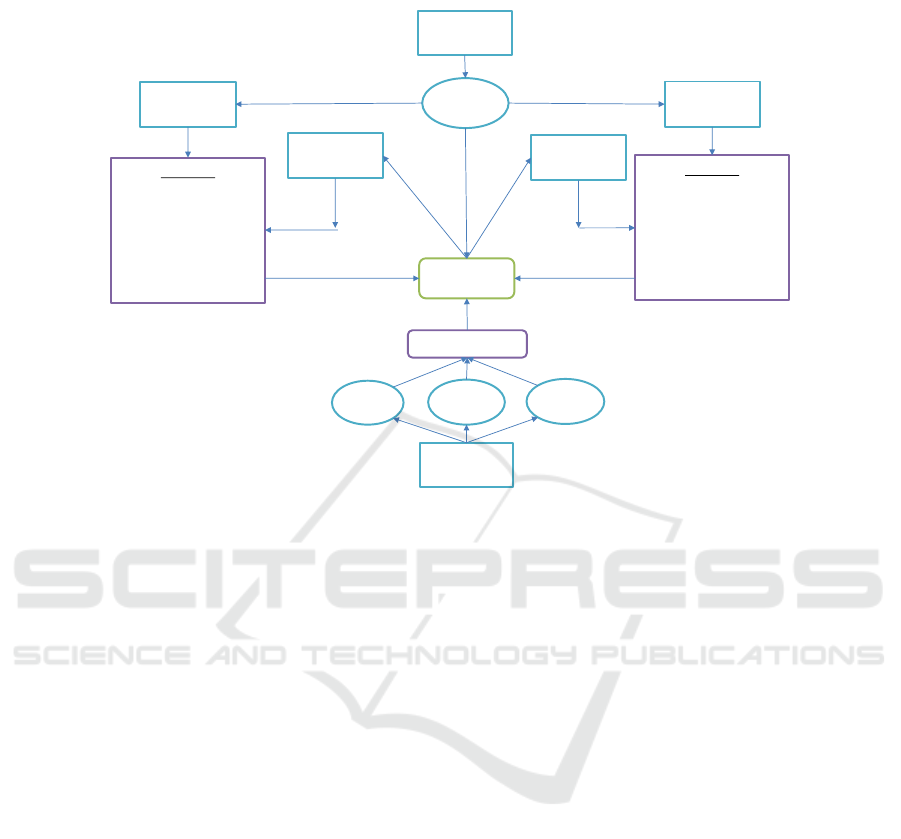
The structure of the intelligent management module with its sub-components and
the surrounding modules is depicted in Figure 4. The ’IM interface’ is the central com-
ponent which connects all sub-components with each other and provides means for
communicating with adjacent modules. The algorithms for the namesake intelligent
management of workloads/applications and thermal behaviour are located in the ’effi-
cient management’ package. The ’management support’ package contains components
for either getting relevant measurement data from live systems (Gnocchi API) or per-
forming power management tasks decided by workload or resource and thermal man-
agement. Other data is used for modelling and model training of server models as well
as workload forecasting models, which are located in the ’models’ package. Besides
the internal structure and organization, Figure 4 illustrates the communication interface
with OpenStack, specifically with the Compute API and the added M2DC filters and
weighers of Nova scheduler. Internal connections to components on OpenStack side
are realized as API requests through official Python clients, loaded as libraries. They
simplify the access with provided methods and return objects for further processing.
Workload Management. The core of the WM is the allocation algorithm which de-
cides on deploying or destroying application instances on the heterogeneous hardware
based on current and future workload behaviour. To perform the deployment actions,
the WM uses the OpenStack Nova Filter Scheduler extended by M2DC custom filters
and weighers. These again make use of server performance and energy efficiency mod-
els, which are stored within the IM module. The three subcomponents are subsequently
described.
Allocation Algorithm. The allocation approach is two-fold with (1) the reactive allo-
cation observing current utilization and spontaneously providing additional compute
160
EPS Portugal 2017/2018 2017 - OPPORTUNITIES AND CHALLENGES for European Projects
160

Efficient Management
OpenStack
Models
Management Support
Workload
Forecasting
Power
Management
Gnocchi API
Compute API
M2DC
Filter
Workload
Management
M2DC
Weigher
IM Interface
Server Model
Storage
Resource and
Thermal
Management
Intelligent Management
Fig. 4. Overview on intelligent management module.
resources if necessary and (2) the proactive allocation adapting the resource usage
to actual demands based on workload forecasts. Both allocation processes have their
own timers with utilization check for reactive allocation being done every second while
proactive optimization is only started every 1800 seconds (30 minutes is a trade-off be-
tween having the possibility to change allocation frequently while still respecting re-
quired time for deployment). Also, if one of these processes is active, the other has to
wait for the active one to finish before starting.
Reactive allocation is triggered, if the measured utilization is higher than the ex-
pected one (calculated via forecast models) including a tolerance of 20 %. As compute
nodes are run with 30 % buffer on resources, a tolerance of 20 % may avoid resource
shortcomings by reacting quickly. As shown in Figure 5 on top, at first the algorithm
will try to find a single additional node with a certain needed performance (r-1a). If the
scheduler fails to find such a node, a node without further requirements will be chosen
(r-1b). Either way, after deployment, utilization will be rechecked and the process is
repeated until each node utilization is within tolerance or an alert will be sent to sys-
tem administration, if there are not enough compute resources available. In the end,
workload models of differing nodes/applications will be remodelled/retrained to avoid
resource shortcomings in the near future.
The proactive allocation optimization process is presented on the bottom in Fig-
ure 5. The order of performing the checks and actions is top-down. After a utilization
forecast check (p-0) the process is divided into the two cases of providing additional
capacities (p-1) or optimizing the allocation (p-2) – with an implicit third case of not
changing anything. If there is a need for additional compute resources in the near future,
the algorithm first checks if a node with too high expected utilization can be replaced by
another node with higher performance (p-1a). This is done by starting the deployment
process with constraints for minimum needed performance (see below). If a suitable
node is found, the workload will be deployed and the previously used node will be
shut down (p-3) until it is needed again. If the overbooked node cannot be replaced
161
The M2DC Approach towards Resource-efficient Computing
161

Proactive approach [every 30 min]
Check utilization forecasts
Additional capacities needed
Alternative node (perf.)
Additional node (perf.)
Optimizations possible
Merge instances
Alternative node (EE)
Shut down original node
p-1:
p-1a:
p-1b:
p-2:
p-2a:
p-0:
p-2b:
p-3:
Additional node (no req.)
p-1c:
Reactive approach [cont.]
Check utilization deviations
Additional node (perf.)
Additional node (no req.)
r-0:
r-1a:
r-1b:
Fig. 5. Illustration of workload allocation algorithm.
by a single node, an additional node will be used, which is selected by the Nova filter
scheduler based on performance requirements (p-1b). If this search also fails, one or
more additional nodes without any requirements will be used (p-1c). In case of decreas-
ing utilization (p-2) there may be the possibility of energy optimization. The algorithm
iterates the node list starting with the least energy-efficient one. Then, the allocation
algorithm tries to merge several instances of the same application to reduce the number
of used compute nodes (p-2a). If this fails, the algorithm searches for a more energy-
efficient replacement node (p-2b). In either case, the deployment process is started with
case-specific parameters for minimal energy efficiency and performance, which were
computed before-hand (see below). Also, if a suitable target node for deployment is
found, the previously used node is switched off to save energy (p-3).
Filter Scheduler. The workload management evaluates the system environment, moni-
tors current workloads as well as forecasts and decides when to add or remove compute
resources. For the scheduling itself, in terms of changing server states and triggering ap-
plication deployments, it uses the Filter Scheduler
1
from OpenStack’s scheduler compo-
nent Nova. That means instead of developing own scheduling functions, the workload
management uses built-in functions, but improves the decision making by providing
additional information and new criteria. For that purpose, the Filter Scheduler was ex-
tended by following filters and weighers:
Energy Efficiency: Node energy efficiency is dependent on several aspects like HW
or processor architectures, node utilization, kind of workload, etc. and is calculated
by server models in IM, see below.
1
https://docs.openstack.org/nova/latest/user/filter-scheduler.html
162
EPS Portugal 2017/2018 2017 - OPPORTUNITIES AND CHALLENGES for European Projects
162

Performance: To adapt resource provisioning to actual demand the node performance
is an important factor. Generally, the deployment process will look for target nodes
with minimum required performance.
Power Management: Energy consumption of nodes can be adapted by power man-
agement features applied via resource and thermal management (cf. Section 4.2).
Temperature: Temperatures for each node are read out from system monitoring and
is considered to avoid hot spots in the chassis.
When a new application instance should be deployed the Filter Scheduler follows
a two-folded approach: For a given application, the first step is to check all available
resources and sort out every node which does not meet hard requirements, usually HDD
size, RAM capacity etc. This is done by filters where each filter is responsible for a
single attribute. Only nodes which pass every filter are valid targets for further deploy-
ment. This is where the M2DC WM also checks for energy efficiency, performance and
power management level of nodes.
Outcome of the filter process is an unordered list of valid hosts. Hence, the second
step of the Filter Scheduler is to find the most suitable node for workload deployment.
For that purpose, it assigns a weight to each valid host and scales it with the respective
multiplier thereby producing a sorted list from which the one with highest weight is
chosen. The weighing is done by a number of weighers each responsible for one
aspect like assessing available RAM or current amount of IO operations. Analogously,
the M2DC WM uses weighers for energy efficiency, performance, power management
level and temperatures. First, the weights w
x
(with x indicating the type of weigher)
are normalized (norm) to a range of 0 to 1. After that, given multipliers w
multiplier
x
are applied to calculate the final weight weight
y
for node y utilizing Equation 1. This
results in a sorted list of weights for n applied weighers.
weight
y
= w
multiplier
1
∗ norm(w
1
) + ... + w
multiplier
n
∗ norm(w
n
) (1)
Models. The M2DC WM and the custom Nova filters and weighers use server mod-
els located in the IM module as data source for allocation and optimization decisions.
These models comprise performance, power and energy efficiency. However, as the
main unique selling proposition of the M2DC WM is its proactivity, the workload fore-
casting model is the most influential one. As the data is time dependent the model has to
work with time series data. Also, the modelling process and training has to be executed
automatically on unknown time series data without external information, such that only
the historical time series itself can be considered (univariate modelling). For achieving
this, the M2DC WM uses a number of univariate, statistical procedures, namely Sea-
sonal and Trend decomposition using Loess (STL) [8], Holt-Winters (HW) [13][21]
filtering and Seasonal AutoRegressive Integrated Moving Average (SARIMA) [7].
The workload forecasting model process is integrated into the IM module by exe-
cuting corresponding R
2
scripts using rpy2 library
3
. There are three functions which use
R for processing: (1) selection of most appropriate forecast model, (2) model training
2
https://www.r-project.org/
3
https://rpy2.bitbucket.io/
163
The M2DC Approach towards Resource-efficient Computing
163

and (3) getting the forecast values. (1) For model selection historical data is split into
training and test data and forecasts with each method are compared (root mean squared
error) with each other. As such time series may contain a multiplicative component the
modelling is also done on Box-Cox [6] transformed data. (2) After that, the best model
is trained with full historic data. (3) The trained model can then be accessed by WM
to get workload forecasts for a requested period. A retraining is triggered if measured
values differ too much from the forecasts, see above.
Next to workload forecasts the WM needs information about the server properties
performance, power and energy efficiency (which is basically the relation between the
former two). As power of modern server HW is usually dependent from the applied
workload, the general power model process used in M2DC bases on linear (regression)
models like in Equation 2.
Y
i
= β
0
+ β
1
φ
1
(X
i1
) + · · · + β
p
φ
p
(X
ip
) + ε
i
i = 1, . . . , n (2)
The models are trained on historical utilization/workload data as independent vari-
ables X
ij
combined with power data as observation Y
i
for same time windows with
size n, thereby modeling the dependency between each other. This dependency is then
expressed by the number p of independent variables (e.g. utilization of different re-
sources), kind of inner (nonlinear) functions φ
j
and corresponding regression parame-
ters β
j
. The structure of the mathematical equation with its inner functions (e.g. quadra-
tic, cubic, exponential) is usually chosen manually. On the contrary, the parameter char-
acteristics are determined by minimizing the summed squared errors (least squares).
Regarding performance and energy efficiency modelling the diverse HW architec-
tures (like CPU, GPU, FPGA, ...) make it impossible to have an objective model such as
for power demand. Therefore, each application running on the M2DC HW will be mon-
itored regarding its own specific performance metrics like image operations per second
in the image processing use case, cf. Subsection 5.1. This means, at first applications
will be deployed only based on data of other applications due to missing data. But af-
ter running a certain time there will be application-specific performance data for each
applicable microserver node and the WM will find more efficient workload allocations.
Resource and Thermal Management (RTM). Working in parallel to the WM, the
RTM manages computing and cooling resources of the RECS|Box in order to ensure
proper power and thermal balance. It is also a part of intelligent management module,
but however able to perform its actions independently from other IM sub-components.
Thus, it can be almost seamlessly deployed and adjusted to all M2DC appliances. The
RTM consists of three functional components responsible for corresponding power
management activities:
Power Capping Manager (PCM): The main objective of this component is to pre-
serve server components power usage from exceeding the defined power limit and
maintain the workload stability during power pikes. The PCM module provides the
user with the functionality of priorities – the user can supervise the order in which
the power distribution process would be carried out on particular servers. Thus, the
appropriate priority usage may preserve critical services from unexpected power
164
EPS Portugal 2017/2018 2017 - OPPORTUNITIES AND CHALLENGES for European Projects
164

changes [18]. The general idea of the power capping methodology is presented in
Figure 6.
Energy Saver Manager (ESM): The ESM component focuses on optimizing current
power usage. Unlike the PCM, the ESM does not interrupt any tasks, it may have
only impact on nodes’ performance. Similarly to the PCM, the ESM provides the
user the priorities functionality.
Fan Manager (FM): It is responsible for adjusting a fan speed in a way that the overall
power usage of the RECS|Box is minimized, while keeping the temperature of par-
ticular microservers below the desired level. It utilizes power and thermal models
to find a trade-off between cooling power and power leakage of microservers.
Fig. 6. PCM procedure schema.
Power management settings and decisions are based on current power usage of
server infrastructure, utilization, workload type, user-defined priorities and predefined
power model of each node.
In general, nodes are classified as unused if there is no load assigned to these nodes
(for instance no tasks in the Slurm system) and their utilization is less than 1 %. Non-
interruptive settings (e.g. dynamic frequency scaling) are settings which do not have any
direct impact on tasks. Unlike non-interruptive settings, the interruptive settings (for
instance suspend and power off) may lead to higher task delays, unsaved computation
result losses or service unavailability. Both components utilize power budget defined as
in Equation 3:
power budget = power limit − current power usage (3)
The architecture and interactions between the RTM components and related APIs
are presented in Figure 7.
As stated, the core of the RTM module are three management components re-
sponsible for power saving actions. The RTM exposes the REST API, which provides
functionality of dynamically setting power and thermal constraints, adjusting priorities,
165
The M2DC Approach towards Resource-efficient Computing
165

REST API
Power
Capping
Fan
Monitoring
API
RECS MASTER
Microserver
Workload Manager,
Scheduler
Management
API
-Power & Thermal
constraints (power,
temperature limit)
-Power policy
-Nodes/ac on priori es
-Applica ons, Workload
Node’s OS API (SSH +
dedicated OS scripts)/
IPMI
Power & Thermal
models, Node types
Input
Fig. 7. RTM module architecture.
changing current nodes’ performance settings, setting power management policies or
triggering the power management process. Corresponding power and thermal models,
information about the available power actions and configuration files are kept in the
local storage. In order to control and collect necessary data from servers, all RTM’s
components utilize dedicated Management API and Monitoring API respectively. The
Management API is used to control servers and fans through RECS Master API, IPMI
or scripts located on remote machines which are accessible via SSH. It can also interact
with installed workload schedulers (e.g. Slurm), acquiring additional knowledge about
running tasks that can be later on used in the management process. The monitoring API
is responsible for providing data from servers through RECS Master API or directly
from servers via scripts accessed through SSH.
M2DC appliances can benefit from three main activities performed by the RTM,
namely power capping, energy optimization and fan management. The FM is use case-
agnostic as it needs to provide proper cooling power for the system working under
different configurations and load conditions. On the other hand, the PCM and the ESM
can be also applied in all use cases, however, their functionality stack may differ with
respect to the appliance. For instance, the PCM will limit the power usage indepen-
dently from the current use case, however, having the access to the Slurm system (like
in the HPC Appliance) will be able to do it with lower performance degradation. More-
over, the RTM can extend basic Slurm power on/off capabilities with specific operations
dependent on the particular hardware (like frequency scaling) and taking into account
166
EPS Portugal 2017/2018 2017 - OPPORTUNITIES AND CHALLENGES for European Projects
166

power/performance trade-off. Similarly, the ESM can harness performance counters to
tailor the behaviour of running applications (services) to current system utilization.
5 Applications
The following section describes two out of six use cases considered in M2DC. It sum-
marizes an SEE for image processing as well as an SEE for IoT applications in the
automotive area and provides a TCO estimation.
5.1 Image Processing Application Use Case
CEWE provides photo finishing and printing services for millions of customers. An
important service is the Online Photo Service which enables customers to prepare and
order products online by using their web browser.
As central image processing server the so-called IMI server provides a wide range
of image processing tasks that are used by most of CEWE’s products. These services
range from file checks via image enhancements to resize, crop and other transformation
tasks. Not all products and services use all of these tasks. The overall distribution of
task types is shown in Figure 8 As can be seen with about 55 % the transformation tasks
are the most common tasks for the servers. Not all of these tasks benefit form conver-
sion to alternative hardware architectures. However, image resize (scaling) is known
to benefit from hardware-specific code optimizations like massive parallel processing,
e.g. by usage of SIMD techniques. As it is the most performed task, it was identified as
proper candidate for heterogeneous hardware acceleration.
Fig. 8. Task type distribution of all CEWE image applications (left) and CEWE MyPhotos (right).
The transform tasks are split in specific operations incuding crop or rotation by 90, 180 or 270
degree. Other tasks include file checks and file conversions as well as providing average color
information among others.
CEWE MyPhotos was chosen as application use case. First of all, it is implemented
as cloud-service to end-users, offering a complete user experience without requiring
167
The M2DC Approach towards Resource-efficient Computing
167

print services, but leaves this option open to the users. Therefore, this application forms
a complete demo show case of a cloud based, heterogeneous hosted application with
hardware-accelerated tasks. The task type distribution of CEWE MyPhotos is also
shown in Figure 8. As can be seen, about 57 % of all services demanded by the ap-
plication are transformation tasks, including scaling and rotating. And the proportion
of scale tasks – our candidate for acceleration – is even higher with 50% compared to
40 % in overall distribution.
Architectural Decisions. The base reference hardware was defined during project pro-
posal stage as status quo of 2013 at CEWE, which is Fujitsu Primergy RX300 S8 server
hardware. The production IMI server as well as applications that use this server are
based on the Java Virtual Machine (JVM). This allows utilisation of every hardware
supporting JVM, including many larger ARM cores. Beside ARM architecture, field
programmable gate arrays (FPGAs) and graphics processing units (GPUs) are major
targets of the project.
Image processing and especially image resizing is known to benefit by massive par-
allel processing. Modern implementations use row and column wise processing with
pipelined window functions and single instruction multiple data (SIMD) hardware to
speed image resize. Before and during the starting phase of the project, FPGA was seen
as major target for this use case. FPGAs allow fast and massive parallelism. However,
in this use case, image sizes and scaling factors are set by the end-user with low re-
strictions. Due to the resulting high variety of resource requirements for transformation
tasks, an GPU implementation turned out to be much more attractive, as FPGA im-
plentations would mainly benefit from static use cases. The use of (embedded) GPU
architecture allows high parallelism at a much lower cost for optimization and with re-
quired flexibility. The SEE development also added support for the low power ARM
architecture, which is supposed to run the basic software, while it calls the hardware
accelerators for demanding tasks.
Efficiency Analysis. Efficiency improvements and quality of development effort is
analysed by measurement of performance parameter and compared to initially done ref-
erence measurements. As stimuli data for this benchmark an image set of 1377 pictures
from different cameras was collected among project members with their permission, as
privacy reasons prohibit the usage of customer images. But to create a realistic bench-
mark, transform task parameters were logged and a set of 35658 transform tasks were
created. This means that every image is used several times within the benchmark set,
pre-transformed to input sizes required by the task.
As mentioned before, the reference system for efficiency comparisons is a Fujitsu
Primergy RX300 S8 server. In order to have comparisons with newer and probably
more power efficient hardware, the benchmark was also done on a Xeon E3-1505MV6
CPU. Additionally, measurements on a TX2 as GPU accelerated embedded hardware
were done using a specialised implementation of the IMI server. The results are shown
in Table 1.
As can be seen, the Xeon E3 has a much lower throughput of about 40 % of the
reference architecture, resulting in a much longer total execution time for this image
168
EPS Portugal 2017/2018 2017 - OPPORTUNITIES AND CHALLENGES for European Projects
168
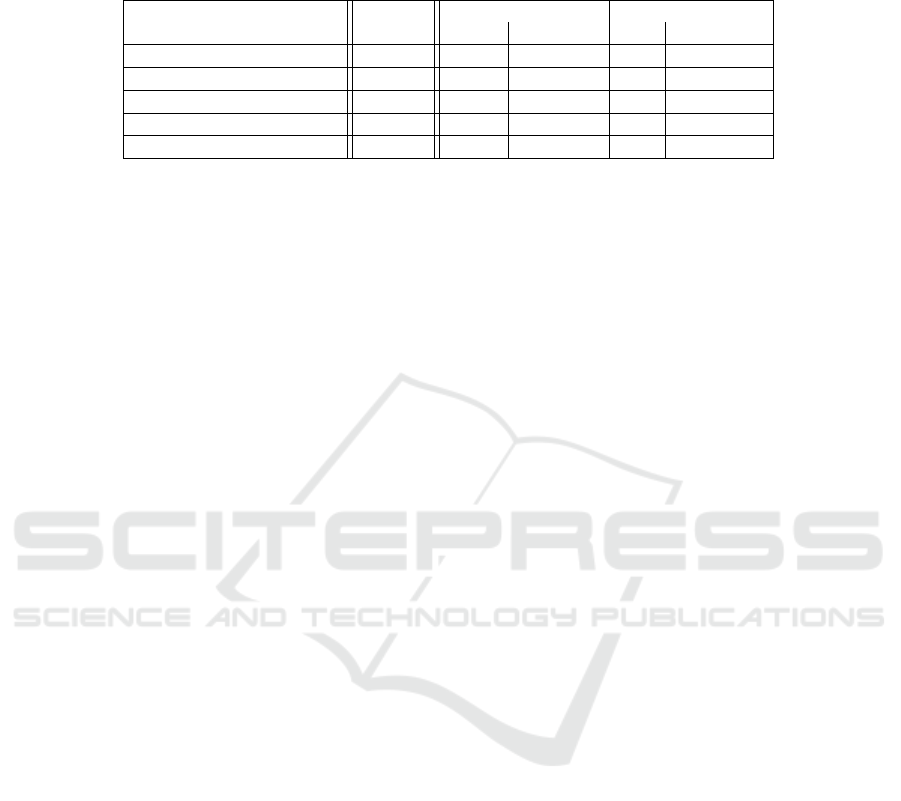
Table 1. Benchmark results of reference system measurements and M2DC HW (4 threads).
Reference Xeon E3-1505MV6 NVIDIA TX2
Property Meas. Meas. Comparison Meas. Comparison
Total time (sec) 1,226.97 2,951.08 +140.52 % 1,537 +25.27 %
Energy Demand (Wh) 69.90 34.59 −50.51 % 4.01 −94.26 %
Throughput (Tasks/sec) 29.06 12.08 −58.42 % 23.19 −20.17 %
Mean execution time (ms) 514.53 283.58 −44.89 % 185.92 −63.87 %
Energy efficiency (task/sec/w) 0.14 0.29 +102.06 % 2.47 +1, 664.29 %
set. However, it requires about 50 % of total energy compared to the reference system
and as a result achieves a doubled energy efficiency. The TX2 reaches 80 % of the
throughput which outperforms the Xeon processor. This relates to an increased total
execution time by 25% compared to the reference system. While the TX2 is behind
the reference hardware of 2013 regarding bare processing power, the energy demand of
4.01 Wh for the total set is much lower. So, processing power comes at a much lower
energy consumption which improves energy efficiency (task/sec/W) by factor 17.
Total Cost of Ownership This section presents the total cost of ownership (TCO) for
a scenario where CEWE replaces all of its hardware at once with M2DC hardware in
terms of RECS|Box systems. With respect to redundancy a minimum of two servers
with several microserver nodes is used to allow spatial separation.
The TCO comparison of the reference systems compared to M2DC server equipped
with Intel Xeon E3-1505M or Nvidia Jetson TX2 is presented in Table 2. The number of
necessary nodes is based on the benchmark results above – aiming to achieve the same
performance as the reference system. That implies there is no scaling to a grown up to
date maximum demand, to keep comparability. Additional to initial costs, the yearly en-
ergy consumption was estimated using measurements as support parameters. However,
development costs, which are required to adapt the applications to new hardware, are
not considered in this comparison.
As can be seen, the investment cost as well as the TCO over three and five years
for the M2DC solution based on Nvidia Jetson TX2 is considerably lower than the
reference systems and also than the x86 microservers. This also means that there is
quite some buffer to use for adaptation of applications to the microservers while still
saving money over time due to reduced operational expanses.
5.2 IoT Application
In the latest years, the interest of researchers and companies in monitoring driving op-
erations has experienced a considerable boost, mainly due to the increased availability
of embedded devices that are equipped with different types of sensors and the continu-
ous advancements in automotive electronics. The retrieved information are further used
for different purposes: firstly, more complex and adaptive Driver Assistance Systems
(DAS) can be developed in order to control and assist the driver operations; secondly,
gathered data can be used to infer knowledge about drivers to create profiles or detect
possible frauds in different scenarios (e.g., insurance companies) [1]. Regarding the
169
The M2DC Approach towards Resource-efficient Computing
169

Table 2. Total cost of ownership for the reference system compared to Xeon E3-1505M and
Nvidia TX2. Other cost include profit margins, setup and test.
Reference Intel Xeon E3-1505M Nvidia TX2
Units
Cost/
unit [e]
Overall [e] Units
Cost/
unit [e]
Overall [e] Units
Cost/
unit [e]
Overall [e]
Nodes 48 550 26,400 25 340 8,500
Servers 20 10,912 218,420 2 9,895 19,790 2 3,370 6,740
Other
cost
16,166 5,334
Energy
cost (p.a.)
10,162 5,182 635
Space
cost (p.a.)
4,200 4,200 4,200
Overall
(invest)
218,240 62,356 20,574
Overall
(3 years)
261,325 90,504 35,079
Overall
(5 years)
290,048 109,269 44,750
second case, an analysis of the literature shows that there are two similar problems:
Driving Style Classification and Driver Identification. Although both of them leverage
raw data coming from sensors to infer knowledge about the driver, their goals are quite
different. In the first case, the goal is to classify a driver according to predefined driving
style (e.g., calm/aggressive, good/bad) [17]. In the second case, the goal is to identify
the driver for a given trip, which can be used for anti-thief methods [14] and insurance
purposes. At this regard, one of the main open problems is to identify the number of
people driving the same vehicle, which is the focus of the IoT application.
To address this problem, we devise a data analytics workflow, which overcomes two
limitations found in current solutions in the state-of-the-art. First, our approach does not
use supervised algorithms [16, 20, 9] (e.g, SVM, Neural Network. . . ), which require to
obtain labelled training data, a hard task for real world application scenarios. Secondly,
the proposed workflow does not employ data gathered with invasive techniques (i.e.,
reading from the vehicle Electronic Computer Board or the CAN bus [16, 9, 11]).
Description of the Application. In this paragraph, we describe the workflow designed
to address the aforementioned problem leveraging all the collected data for a vehicle.
These data are raw measurements sampled at 1 Hz; the data being collected in these
samples are motion data (speed of the vehicle, accelerations in the three main direc-
tions), geolocalization data (position, altitude) and additional information such as the
speed limit and the type (highway, urban, etc.) of the road run across by the vehicle.
These data are partitioned in trips, grouping together measurements sampled from en-
gine switch-on to the subsequent engine switch-off, since all these measurements are
presumably sampled with the same driver.
The first step of our proposed workflow is a usual preprocessing of the data: in this
phase, we discard all geolocalization data, since they have no relation with the driving
170
EPS Portugal 2017/2018 2017 - OPPORTUNITIES AND CHALLENGES for European Projects
170

style. After this step, feature extraction is performed: starting from single measurements
of the same trip, some aggregate values (features) are computed. In particular, some fea-
tures are different statistical measures (mean, variance, skewness, kurtosis) of motion
data, while other features have been specifically designed with the aim of characterizing
the driving style, such as the number of speed infringements or the number of peaks in
the acceleration in the three directions (usually denoting a less smooth driving style).
At the end of feature extraction, a trip is represented by a tuple containing the ac-
tual values for each of these features. With this data representation, we deem our driver
identification problem as an instance of a clustering problem: if we consider each trip
as a point in an m dimensional space, with m being the number of features, then trips
of the same driver should belong to a cluster, while trips of the other drivers presumably
belong to different clusters. However, clustering algorithms are not directly applicable
to the set of trips outputted by the feature extraction process: since the number of fea-
tures m is high (about 40), clustering is affected by a common issue in data analytics,
generally referred as to curse of dimensionality. In order to reduce the dimension of the
dataset without discarding meaningful information provided by each of the features,
we employ Principal Component Analysis (PCA). With PCA, we get new features, ob-
tained as a linear combination of the original features, which are more representative
of the dataset. Thanks to this latter property, generally few features (5-7 in our case)
among the ones computed by the PCA are sufficient to represent a large portion (75%
in our case) of the dataset, actually shrinking the dimension of the dataset.
In conclusion, after PCA we get a low dimensional dataset, on which we can ap-
ply a clustering algorithm. Among the variety of these algorithms, we choose a density
based approach, in particular the DBSCAN [10] algorithm, since we do not need to fix
a priori the number of clusters to be found (which must be an output of the algorithm
in our case). DBSCAN algorithm requires to specify two parameters which have a sig-
nificant impact on the accuracy of clustering; to estimate these parameters, we employ
the heuristic presented by the authors of the algorithm [10, Section 4].
Experimental Results. In this paragraph, we provide an experimental evaluation of the
proposed workflow, considering both the accuracy and the computational complexity.
To this extent, the workflow has been implemented in a single core application using
the R programming language, which is specifically designed to target applications with
statistical computation or data analytics. The main issue to assess the effectiveness of
our approach is the lack of a dataset where each trip is labeled with its driver or where
the number of drivers per vehicle is stated. Therefore, we had to look for an estimation
of the average number of drivers per vehicle. Since this data depends on cultural and
social conditions, we tried to find this estimation for UK, which is the country where
the available data were collected by Vodafone. In particular, we found public available
government data [12] reporting the average number of adult people per vehicle and
the number of drivers per adult people, which allow us to compute an average value
of drivers per vehicle of 1.095. According to this estimation, if our application was
accurate, we would expect to find more than one driver in approximately 10 % of the
vehicles: indeed, the percentage of vehicles where our approach identifies more than
one driver is 11 %.
171
The M2DC Approach towards Resource-efficient Computing
171

●
●
●
●
●
●
●
●
●
●
●
●
●
●
●
●
●
●
●
●
●
●
●
●
●
●
●
●
●
●
●
●
●
●
●
●
●
●
●
●
●
●
●
●
●
●
●
●
●
●
●
●
●
●
●
●
●
●
●
●
●
●
●
●
●
●
●
●
●
●
●
●
●
●
●
●
●
●
●
●
0e+00 1e+05 2e+05 3e+05 4e+05 5e+05
0 50 100 150
Number of trips
Execution Time(s)
Fig. 9. Execution time of PCA and clustering w.r.t. the number of trips. The red line shows the
linear regression model, with equation T ime = 3.490 · 10
−4
· Size − 2.329.
Regarding the evaluation of the computational complexity, we separately test the
two halves of our workflow. For preprocessing and feature extraction, we evaluate the
computational complexity with respect to the number of samples in a single trip. We
observe an expected linear computational complexity, with the magnitude of execution
times being 10
−1
s for the biggest trips (70k samples).
Then, we evaluate the scalability of the core part of our application, namely PCA
and clustering steps, with respect to the number of trips of the same vehicle. In this case,
the size of input data varies from 1k to 500k trips, which is the expected amount of trips
to be processed in Vodafone’s scenario. Figure 9 reports the results of this evaluation, as
well as the model obtained by applying linear regression to these data. Again, the good
fit between the data and the linear model shows that the core part of our application
scales linearly with the number of trips being processed. Concerning the magnitude of
execution times, the application is able to perform PCA and clustering on 500k trips in
slightly more than 3 minutes (189 s).
Given that driver identification is not a time-critical task, since this application is
expected to be used daily or weekly to analyze the new trips being collected, this exe-
cution time might seem appropriate. Nevertheless, this analysis has to be performed for
each vehicle, hence identifying the number of drivers for many vehicles may require
a significant amount of time (e.g. about a whole day of computation for 1k vehicles).
Therefore, in this scenario, accelerating the application might have a significant impact
on the computational effort required by the application, providing a suitable use case for
M2DC hardware. The acceleration process has recently started: profiling the application
shows that the computational portion (PCA and Clustering) accounts for about 60% of
the execution time of the application, while the remaining 40% is spent for I/O opera-
tions. Therefore, it is worth to accelerate both the computational and the I/O portions of
the application. For the computation, we are going to leverage the R-toolchain provided
172
EPS Portugal 2017/2018 2017 - OPPORTUNITIES AND CHALLENGES for European Projects
172

by Alliance Services Plus
4
(a partner in the project), which is specifically designed to
accelerate R based applications. For the I/O operations, there might be different viable
strategies, currently under evaluation, like possibly compressing the input data, lever-
aging high performance non-volatile memories or storage solutions able to parallelize
I/O operations (e.g. RAID architectures or parallel file systems). Further improving the
I/O performance may be achieved by leveraging the scheduling SEE, developed in the
M2DC project, which provides fast communication primitives (e.g Remote DMA).
Data Confidentiality
The IoT automotive application has to deal with sensitive customer data including GPS
locations and timestamps of their trips, which are stored on a server. Encryption is a
powerful tool to ensure the confidentiality of these data in case of a security breach.
However, this solution implies that the data need to be decrypted prior to its processing,
increasing the computational effort of the application. Nevertheless, such computation
can be accelerated by leveraging the cryptographic SEE built in the M2DC project (see
Section 3.2). In particular, among the ISO standardized block ciphers provided by the
SEE, CLEFIA [5] is the one achieving the highest throughput (1.202 GB/s): leveraging
the SEE for this block cipher would allow a speed-up of 334× over a software im-
plementation, increasing the energy efficiency by 483.55×, in terms of encrypted data
per Joule spent [4]. Therefore, thanks to the SEE, we expect to be able to ensure data
confidentiality in the application without introducing a significant overhead.
Total Cost of Ownership
Beside the reduction of the total cost of ownership when hosting the application, mainly
due to a better energy efficiency and the improvement of the thermal management, as
discussed in the previous sections and applicable to any workload, a significant value
added of exploiting M2DC technologies for Vodafone resides also in the quality of
the result. In particular, it is becoming affordable customizing the models with a rate
of days or weeks, a dramatic improvement with respect to existing solutions usually
computed/updated at a pace of several months. Such possibility represents a strategic
advantage from the standpoint of adapting the algorithms to different markets and op-
erating conditions, as well as to make possible considering the enrichment of the driver
classification with new features, to be further proposed to the car insurance companies.
6 Conclusion
The M2DC project develops a new class of low-power TCO-optimised appliances with
built-in efficiency and dependability enhancements to specifically address future data
centres. As discussed in this chapter, the new heterogeneous RECS|Box combines re-
source efficient microserver modules with a multi-layer communication infrastructure
in a highly flexible manner, enabling seamless integration of state-of-the-art x86 pro-
cessors, x64 ARM mobile/embedded SoCs, x64 ARM server processors, FPGAs and
4
www.eolen.com
173
The M2DC Approach towards Resource-efficient Computing
173

GPUs. New microservers are developed within the project integrating, e.g., a 32-core
ARMv8 server processor and an Intel Stratix 10 SoC, which combines ARMv8 cores
with a tightly coupled FPGA fabric.
SSEs as a key concept of the M2DC platform were developed as (optional) modules
with the objective to increase performance and/or efficiency of particular subsystems.
They group into the categories application acceleration, communication and manage-
ment/monitoring. They are generally interfaced by an API to ensure an easy integration
as well as exchangeability. Moreover, SEEs support the heterogeneity and flexibility of
the M2DC platform. With the cryptography SEE, the potential of this promising con-
cept has been presented.
The middleware is based on OpenStack using the bare metal deployment provided
with Nova and Ironic, thereby reducing overhead on M2DC microservers. New M2DC
accelerators are integrated with OpenStack by extending Cyborg to support correspond-
ing drivers. Furthermore, Valence is adapted to combine HW components to logical
nodes to meet special requirements of applications. As bare metal deployment loses
some flexibility compared to virtualization, the middleware is supplemented by an
intelligent management module to increase energy efficiency and therefore reducing
costs. On the one hand, the workload management directly connects to Nova and au-
tonomously optimizes the allocation of applications to microservers based on predicted
resource demand, temporarily switching off not needed microservers. On the other
hand, the resource and thermal management optimizes power and cooling demands
on the infrastructure by addressing three different aspects: power management, power
capping and fan management.
With image processing and IoT data processing two exemplary M2DC use cases
with promising results were presented. By utilizing the GPU of an Nvidia Jetson TX2
image scaling could be performed 17 times more energy efficient compared to the ref-
erence machine and also the TCO is only a tenth at a rough estimate.
References
1. Agosta, G., Barenghi, A., Brandolese, C., Fornaciari, W., Pelosi, G., Delucchi, S., Massa, M.,
Mongelli, M., Ferrari, E., Napoletani, L., Bozzi, L., Tieri, C., Cassioli, D., Pomante, L.: V2i
cooperation for traffic management with safecop. In: 2016 Euromicro Conference on Digital
System Design (DSD). pp. 621–627 (Aug 2016). https://doi.org/10.1109/DSD.2016.18
2. Agosta, G., Barenghi, A., De Santis, F., Di Biagio, A., Pelosi, G.: Fast Disk En-
cryption through GPGPU Acceleration. In: 2009 International Conference on Parallel
and Distributed Computing, Applications and Technologies. pp. 102–109 (Dec 2009).
https://doi.org/10.1109/PDCAT.2009.72
3. Agosta, G., Barenghi, A., Di Federico, A., Pelosi, G.: OpenCL performance portability
for general-purpose computation on graphics processor units: an exploration on crypto-
graphic primitives. Concurrency and Computation: Practice and Experience 27(14), 3633–
3660 (2014). https://doi.org/10.1002/cpe.3358, https://onlinelibrary.wiley.com/doi/abs/10.
1002/cpe.3358
4. Barenghi, A., Madaschi, M., Mainardi, N., Pelosi, G.: OpenCL HLS Based Design of FPGA
Accelerators for Cryptographic Primitives. In: Proceedings of the International Conference
on High Performance Computing & Simulation (HPCS 2018)) - 13th International Workshop
174
EPS Portugal 2017/2018 2017 - OPPORTUNITIES AND CHALLENGES for European Projects
174

on Security and High Performance Computing Systems (SHPCS 2018). pp. 3:1–3:8. IEEE
Computer Society (July 2018)
5. Biryukov, A. (ed.): The 128-Bit Blockcipher CLEFIA (Extended Abstract), Lecture Notes in
Computer Science, vol. 4593. Springer (2007). https://doi.org/10.1007/978-3-540-74619-5,
https://doi.org/10.1007/978-3-540-74619-5
6. Box, G.E., Cox, D.R.: An analysis of transformations. Journal of the Royal Statistical Soci-
ety. Series B (Methodological) pp. 211–252 (1964)
7. Box, G.E., Jenkins, G.M., Reinsel, G.C., Ljung, G.M.: Time series analysis: forecasting and
control. John Wiley & Sons (2015)
8. Cleveland, R.B., Cleveland, W.S., Terpenning, I.: Stl: A seasonal-trend decomposition pro-
cedure based on loess. Journal of Official Statistics 6(1), 3 (1990)
9. Enev, M., Takakuwa, A., Koscher, K., Kohno, T.: Automobile driver fingerprint-
ing. Proceedings on Privacy Enhancing Technologies 2016(1), 34–50 (2016).
https://doi.org/10.1515/popets-2015-0029
10. Ester, M., Kriegel, H., Sander, J., Xu, X.: A density-based algorithm for discovering clusters
in large spatial databases with noise. In: Proceedings of the 2
nd
International Conference
on Knowledge Discovery and Data Mining (KDD-96), Portland, Oregon, USA. pp. 226–231
(1996), http://www.aaai.org/Library/KDD/1996/kdd96-037.php
11. Fugiglando, U., Massaro, E., Santi, P., Milardo, S., Abida, K., Stahlmann, R., Netter, F.,
Ratti, C.: Driving behavior analysis through CAN bus data in an uncontrolled environment.
CoRR abs/1710.04133 (2017), http://arxiv.org/abs/1710.04133
12. Government, U.: Driving licence holding and vehicle availability (nts02) (2016), national
Travel Survey
13. Holt, C.C.: Forecasting seasonals and trends by exponentially weighted moving averages.
International journal of forecasting 20(1), 5–10 (2004)
14. Kwak, B.I., Woo, J., Kim, H.K.: Know your master: Driver profiling-based anti-theft method.
CoRR abs/1704.05223 (2017), http://arxiv.org/abs/1704.05223
15. Lachmair, J., Mer
´
enyi, E., Porrmann, M., R
¨
uckert, U.: A reconfigurable neuropro-
cessor for self-organizing feature maps. Neurocomputing 112, 189 – 199 (2013).
https://doi.org/https://doi.org/10.1016/j.neucom.2012.11.045, http://www.sciencedirect.
com/science/article/pii/S0925231213002385, advances in artificial neural networks,
machine learning, and computational intelligence
16. Ly, M.V., Martin, S., Trivedi, M.M.: Driver classification and driving style recognition using
inertial sensors. In: 2013 IEEE Intelligent Vehicles Symposium (IV). pp. 1040–1045 (June
2013). https://doi.org/10.1109/IVS.2013.6629603
17. Martinez, C.M., Heucke, M., Wang, F.Y., Gao, B., Cao, D.: Driving style recogni-
tion for intelligent vehicle control and advanced driver assistance: A survey. IEEE
Transactions on Intelligent Transportation Systems 19(3), 666–676 (March 2018).
https://doi.org/10.1109/TITS.2017.2706978
18. Oleksiak, A., T.Ciesielczyk, Kierzynka, M., Piatek, W.: Minimising energy costs of data
centers using high dense heterogeneous systems and intelligent resource management. In:
e-Energy ’18 Proceedings of the Ninth International Conference on Future Energy Systems.
pp. 499–505 (2018)
19. Oleksiak, A., Kierzynka, M., Piatek, W., Agosta, G., Barenghi, A., Brandolese, C., For-
naciari, W., Pelosi, G., Cecowski, M., Plestenjak, R.,
ˇ
Cinkelj, J., Porrmann, M., Hage-
meyer, J., Griessl, R., Lachmair, J., Peykanu, M., Tigges, L., vor dem Berge, M., Christ-
mann, W., Krupop, S., Carbon, A., Cudennec, L., Goubier, T., Philippe, J.M., Rosinger, S.,
Schlitt, D., Pieper, C., Adeniyi-Jones, C., Setoain, J., Ceva, L., Janssen, U.: M2DC – Modu-
lar Microserver DataCentre with heterogeneous hardware. Microprocessors and Microsys-
tems 52, 117 – 130 (2017). https://doi.org/https://doi.org/10.1016/j.micpro.2017.05.019,
http://www.sciencedirect.com/science/article/pii/S0141933116304574
175
The M2DC Approach towards Resource-efficient Computing
175

20. Vaitkus, V., Lengvenis, P.,
ˇ
Zylius, G.: Driving style classification using long-
term accelerometer information. In: 2014 19th International Conference on Meth-
ods and Models in Automation and Robotics (MMAR). pp. 641–644 (Sept 2014).
https://doi.org/10.1109/MMAR.2014.6957429
21. Winters, P.R.: Forecasting sales by exponentially weighted moving averages. Management
science 6(3), 324–342 (1960)
176
EPS Portugal 2017/2018 2017 - OPPORTUNITIES AND CHALLENGES for European Projects
176
