
Father as a Caregiver: The Thipology of Father Parenting Style
While Mother doesn’t Exist and the Effect to Child Autonomy
Corry Caromawati
1
, and Agung Kurnia
2
1
Institut Teknologi Nasional, Bandung, Indonesia
2
Universitas Pendidikan Indonesia, Bandung, Indonesia
{Corrycaromawati, agungkurnia.aku}@gmail.com
Keywords: English as a lingua franca, intelligibility, vowel contrast.
Abstract: This study investigated the characteristics (place and duration) of the vowel contrasts produced by Indonesian
students of English and whether they contrasted the lax and tense vowels. Ten female students participated in
this study. The data were collected through a listening and speaking task focusing on the vowel contrasts and
analyzed using acoustic analysis. The findings showed that the participating students produced the /u/ and
/ʊ/ at the relatively expected locations and contrasted them, but not the other vowel contrasts (/ɛ/ and /æ/ and
/i/ and /ɪ/). In terms of duration, the vowels produced by the participants were inconsistent, and they were not
contrasted. These findings are interpreted as a support to the previous study, and advocate for more
pronunciation instruction through listening exercise to expose the difference of the lax and tense vowels.
1 INTRODUCTION
The main aim of learning a language is to be able to
communicate with people who speak that particular
language. In order to achieve the aim, Jenkins (2000)
suggests that language learners should be able to be
intelligible when speaking to the native speakers or
other speakers of that language. Therefore, it is
important for language learners to avoid errors in
producing segmental (individual sounds) and
suprasegmental features such as pitch and rhythm that
will cause communication breakdowns. Even though
both segmental and suprasegmental units are
important, Jenkins’ (2000) study showed that errors
in segmental units tend to be more problematic than
suprasegmental, especially when the errors occur
frequently due to the speakers’ inability to produce
the proper ones. Nonetheless, not all errors in
segmental units will cause communication
breakdowns. There are some segmental units that are
more problematic than others. These units are
considered to have higher functional load because
when a speaker does not produce them correctly, a
communication misunderstanding or breakdown will
be inevitable. Therefore, it is necessary for language
speakers to be aware of this risk and learn how to be
able to produce them correctly.
Even though Jenkins (2000) claimed that vowel
quality does not affect intelligibility, a study
conducted by Deterding and Mohamad (2016)
provides evidence that vowel quality was involved in
a substantial number of communication breakdown
occurrences found in the Asian Corpus of English
(ACE), one occurrence became a strong support of
how vowel quality became the main factor of a
communication breakdown.
It is believed that language learners will find the
segmental unit production challenging if the features
either do not exist or are different to those of their
mother tongue. For Indonesian speakers of English,
vowel production can be problematic since the vowel
system in Indonesian language is not similar to that of
English because English has lax and tense vowel
pairs. These vowel pairs indeed have high functional
loads (Brown, 1991), especially when the vowels are
in taboo words. For example, the minimal pairs beach
[bitʃ] and bitch [bɪtʃ]
Koffi (2016) also believed that if the vowel pairs
are not contrasted by at least 61 Hertz, the listeners
will not be able to perceive them well. Unfortunately,
Indonesian speakers of English who lived in the USA
only contrasted the dimension of the /u/ and /ʊ/
(Caromawati & Muhammad, 2015). As to our
knowledge no studies have been done on vowel
contrasts of Indonesian learners of English learning
58
Caromawati, C. and Kurnia, A.
Father as a Caregiver: The Thipology of Father Parenting Style While Mother doesn’t Exist and the Effect to Child Autonomy.
DOI: 10.5220/0007162000580062
In Proceedings of the Tenth Conference on Applied Linguistics and the Second English Language Teaching and Technology Conference in collaboration with the First International Conference
on Language, Literature, Culture, and Education (CONAPLIN and ICOLLITE 2017) - Literacy, Culture, and Technology in Language Pedagogy and Use, pages 58-62
ISBN: 978-989-758-332-2
Copyright © 2018 by SCITEPRESS – Science and Technology Publications, Lda. All rights reserved

the language in higher education, we were interested
in investigating their production.
Based on the aforementioned motivation, this
study sought answers to these following research
questions:
1. What are the characteristics of vowel contrasts
/ɛ//æ/, /u//ʊ/, and /i//ɪ/ of Indonesian learners of
English regarding their place of articulation and
duration?
2. Do Indonesian learners of English contrast the
lax and tense vowels?
2 METHODS
2.1 Data Collection
There were ten female learners of English from a
private university in Indonesia participated in this
study. There were no particular reasons for choosing
female students. However, it is strongly believed that
two genders have different pronunciation
characteristics. Peterson and Barney (1952)
mentioned that due to the difference in size of men
and women, women have higher resonance
frequencies than men. This fact became our
consideration to include one gender only. These
participants had very low score on a paper-based
TOEFL-like, under 425 and had never been to an
English speaking country. However, when the study
was conducted, they were studying English in a
private university in Bandung, and we assumed that
they were exposed to English language outside the
classroom, such as through movies, songs, etc.
These participants were asked to listen to audio
files of an American English speaker saying a
carrying phrase “Now I say …” followed by a token
containing the target vowels /ɛ//æ/, /u//ʊ/, and /i//ɪ/
with one consonant before and after them, which is
referred to what we call a frame. In this study, we
used four CVC frames, F_L, H_D, P_L, and P_T.
These frames were acknowledged by the participants
who were asked to focus only on the vowels. Before
they recorded their voice, the learners were allowed
to listen to the audio as many times as they needed
until they were confident with what they heard from
the recording, and then repeated it. In total, each
participants produced 24 tokens. Therefore, there
were 240 tokens recorded using Audacity and
analyzed to answer the two research questions in this
study.
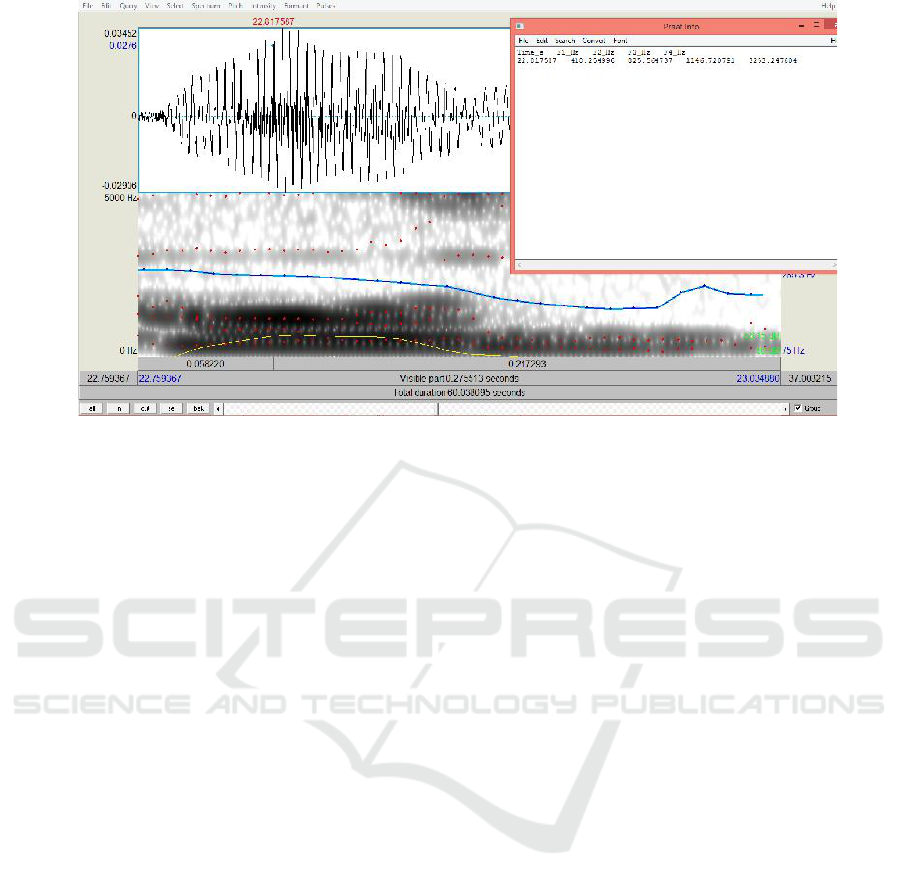
2.2 Data Analysis
The 240 tokens gathered from the learners’ recorded
data were analyzed through acoustic analysis. This
analysis used PRAAT as a tool that can measure the
vowels formants and durations. Only formant 1 (F1)
and 2 (F2) were measured for the purpose of this
study since these two formants are associated with the
height and frontness of the vowels (Ladefoged &
Maddieson, 1996) cited in Baart (2010: 66). These
formants were taken at the midpoint of the vowel
soundwave to ensure the pureness of the vowels (see
Figure 1). The durations, on the other hand, were
measured by considering the intensity and the
periodic shape of the soundwave as the characteristic
of vowels (Baart, 2010). The measured formants and
duration data were later logged in a spreadsheet file.
The data from the two of us were combined and the
mean from both data sources were used as the main
information. This information were imported into
PRAAT to create the vowel chart to answer the first
research question. Additionally, the numbers of the
formants and durations were calculated to get the
standard deviation to see the consistency of them. To
answer the second research question, the numerical
data of the formants and durations of each vowel
contrast were compared and t-tests were run to
investigate whether the learners of English contrast
the vowels.
Father as a Caregiver: The Thipology of Father Parenting Style While Mother doesn’t Exist and the Effect to Child Autonomy
59
3 RESULTS AND DISCUSSION
The results from the acoustic analysis performed by
the two of us provided answers to the two research
questions. In this study, the formant frequencies were
set in Hertz and the durations were in milliseconds.
3.1 The characteristics of vowel contrast
production of Indonesian learners of
English
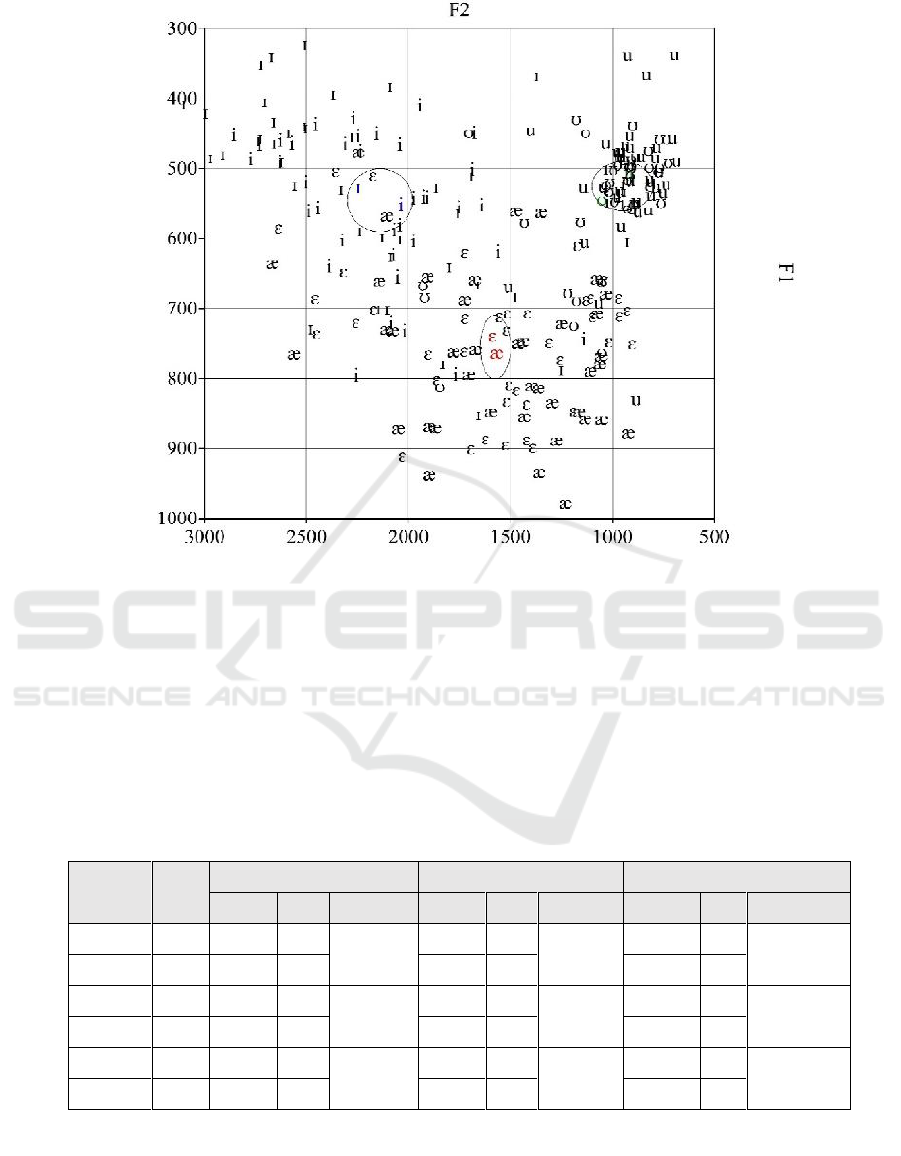
Figure 2 illustrates the dimension of the vowels
produced by the learners. The height is indicated by
F1 as the X axis, and the frontness is indicated by F2
as the Y axis. The average F1 and F2 are illustrated
by colors in the chart (red, blue and green) and are
placed in the circular shapes. The figure shows that
the learners tend to produce /i/ & /ɪ/ at the slightly
central part of the mouth. Supported by Table 1 which
provides statistical data indicating F1 (552 and 527)
and F2 (2038 and 2246) for the /i/ & /ɪ/ sounds. This
dimension is slightly different to those of the female
North American English (NAE) speakers. As found
by Peterson and Barney’s (1952) study that the
common dimension for female NAE speakers are 310
& 430 (F1); 2790 & 2480 (F2). Additionally, it is
interesting to find that the learners tend to have the
tense vowel /ɪ/ at a higher position that the lax vowel
/i/.
The /ɛ/ & /æ/ were produced at the lower center of
the mouth with the dimension of 739 & 763 (F1);
1587 & 1566 (F2). Compared to those of the female
NAE speakers, these sounds were more backward
because the female NAE speakers have F1 of 610 &
860 and F2 of 2330 & 2050. The /u/ & /ʊ/, on the
other hand, were produced at the lower back of the
mouth with the dimension of 506 & 544 (F1) and 918
& 1051 (F2). These dimensions are relatively similar
to those of the NAE speakers, except for the /ʊ/ sound
which was slightly lower. According to Peterson and
Barney (1952), the dimensions of /u/ & /ʊ/ for
females NAE speakers are 470 & 370 (F1) and 950 &
1160 (F2). Regardless the similarities found in the
dimensions of the average formant frequencies, the
standard deviation (shown in Table 1) indicates the
inconsistency of the formants. It can be seen in the
vowel chart (Figure 2) where the vowels are scattered
all over the place.
Regarding the duration of the vowels, the average
durations for /ɛ/,/æ/,/u/,/ʊ/,/i/ and /ɪ/ are 178 ms, 194
ms, 173 ms, 175 ms, 177 ms, and 185 ms
successively. It means the vowels produced by the
participants were relatively similar in terms of
duration. Additionally, similar to the dimension of the
vowels, the learners were also inconsistent with their
vowel duration indicated by the relatively high
standard deviations (see Table 1). It may indicate that
they did not have the sounds in their long-term
memory. However, this assumption needs further
investigation.
Figure 1: One of the who’d tokens analyzed in PRAAT to get the formants at the mid-point.
CONAPLIN and ICOLLITE 2017 - Tenth Conference on Applied Linguistics and the Second English Language Teaching and Technology
Conference in collaboration with the First International Conference on Language, Literature, Culture, and Education
60
3.2 The contrast of the lax and tense
vowels
To find out whether the learners contrasted the lax
and tense vowels, we interpreted the results from the
t-test. We set the statistical significance (α) at 1%. As
seen in Table 1, the results showed that the learners
did contrast the dimension of /u/ & /ʊ/ with the p-
value of 0.04 (F1) and 0.02 (F2), but they did not
contrast the durations (p-value=0.93). The /i/ and /ɪ/
were contrasted only by their frontness (p-value=
0.07), but not their height or F1 (p-value=0.34) nor
their durations (p-value=0.55). On the contrary, the
/ɛ/ and /æ/ were not contrasted at all. This support
what Figure 2 illustrates: the vowels are close to each
other and even overlapped.
It is interesting to find that these students
contrasted the place of articulation of /u/ and /ʊ/, but
not the other two vowel contrasts. It might be caused
by the fact that /i/, /ɪ/, /ɛ/, and /æ/ are neighboring
Figure 2: The vowel chart drawn in PRAAT to illustrate the height (F1) and frontness (F2) of the vowels.
Table 1: The statistical data of the formants and duration of the vowels.
Vowels
N
F1
F2
Duration
Mean
SD
p-value
Mean
SD
p-value
Mean
SD
p-value
ɛ
40
739
100
0.32
1587
479
0.84
178
60
0.22
æ
40
763
114
1566
445
194
54
u
40
506
70
0.04*
918
168
0.02*
173
63
0.93
ʊ
40
544
93
1051
310
175
69
i
40
552
100
0.34
2038
469
0.07*
177
61
0.55
ɪ
40
527
134
2246
548
185
64
α = 0.01
* significant
Father as a Caregiver: The Thipology of Father Parenting Style While Mother doesn’t Exist and the Effect to Child Autonomy
61

vowels. To prove this assumption, more studies
and/or more data are needed.
4 CONCLUSION
The results of the study show that Indonesian learners
do not really contrast the lax and tense vowels, except
for the dimension of one of the vowel contrasts. The
learners were inconsistent through most of the vowels
production in terms of articulation and duration.
There are many possible factors which may cause it,
such as the interference of their first language and/or
the lack of exposure to pronunciation. These
speculations, however, need further investigation.
Based on the findings of this study which appears to
be a support for the study conducted by Caromawati
& Muhammad (2016), it is important and necessary
for Indonesian learners of English to be exposed more
to pronunciation instruction, as suggested by Celce-
Murcia, Brinton, Goodwin, & Griner (2010). For
further direction, we think it is important to
investigate the roles of pronunciation instruction to
learners’ ability in differentiating the vowel contrast
such as a study conducted by Wang & Munro (2005).
In addition to that, it is also necessary to look at
Indonesian learners’ perception skills in
discriminating these vowel contrasts.
REFERENCES
Baart, J. L. 2010. A field manual of acoustic phonetics.
Dallas, TX: SIL International.
Brown, A. 1991. Functional load and the teaching of
pronunciation. In A.Brown (Ed.), Teaching English
Pronunciation: A book of readings. New York:
Routledge.
Caromawati, C., Muhammad, A. 2016. The monophtongal
English vowel production of Indonesian learners of
English with different proficiency levels. Iowa State
University, Ames, IA, USA.
Celce-Murcia, M., Brinton, D. M., Goodwin, J. M., &
Griner, B. 2010. Teaching pronunciation: A course
book and reference guide. New York: Cambridge
University Press.
Deterding, D., Mohamad, N.R. 2016. The role of vowel
quality in ELF misunderstandings. Journal of English
as a Lingua Franca, 5(2). DOI: 10.1515/jelf-2016-
0021
Jenkins, J. 2000. The phonology of English as an
international language. UK: Oxford University Press.
Koffi, E. 2016. Relevant Acoustic Phonetics of L2 English:
Focus on intelligibility. Course Manuscript: St. Cloud
State University.
Maddieson, I., Ladefoged, P. 1996. The sounds of the
world’s languages. Oxford: Oxford University Press.
Peterson, G. E., Barney, H. L. 1952. Control methods used
in a study of the vowels. The Journal of the acoustical
society of America, 24(2), pp. 175-184.
Wang, X., Munro, M. J. 2004. Computer-based training for
learning English vowel contrasts. System, 32(4), pp.
539-552.
CONAPLIN and ICOLLITE 2017 - Tenth Conference on Applied Linguistics and the Second English Language Teaching and Technology
Conference in collaboration with the First International Conference on Language, Literature, Culture, and Education
62
