
Correlation of Energy Intake, Sex and Physical Activity with Fat
Mass in Stunting Teenagers
Ginna Megawati, Dewi Marhaeni Diah Herawati and Siti Nur Fatimah
Medical Nutrition Division, Department of Public Health, Faculty of Medicine, Universitas Padjadjaran
ginna@unpad.ac.id
Keywords: Physical Activity, Energy Intake, Fat Mass, Stunting, Teenagers.
Abstract: Stunting remains a global health problem. Indonesia is one of the country with the highest stunting prevalence.
Stunting can cause an increase fat mass which is a risk factor for the diseases related to metabolic disorders.
Fat mass is influenced by epigenetic, environmental and genetic factors. This study analyzed the relationship
of energy intake, sex, physical activity with fat mass in stunting teens. Quantitative cross-sectional study
design, conducted from April to July 2015 in 8 schools (elementary, junior high schools) in Jatinangor sub-
district at students aged 10-14 years old (112 people). ). Energy intake and physical activity was interviewed
using a 24 hour recall questionnaire. Measurement of fat mass using Bioimpedance Analyzer TANITA SC-
240MA, height with Seca-213 stadiometer. The results showed subjects had less energy intake (53.52%), light
physical activity (79.34%) but fat mass was not high. There was a significant correlation between energy
intake and fat mass (p=0.02), significant correlation between sex and fat mass (p = 0.00) but no significant
association between physical activity and fat mass in stunting teens (p> 0.05). In conclusion any changes in
energy intake in stunting teenagers will affect the fat mass, as well as sex, but physical activity does not affect
the fat mass.
1 INTRODUCTION
Teenager stated stunting if his height is lower than
other adolescents of the same age and sex (<-2
standard deviation (SD) based on the WHO (World
Health Organization) growth chart, 2006. Stunting is
still a health problem in the world, especially in
developing countries and low income. Indonesia is
the country with the high prevalence stunting (37.2%)
and West Java is the province with stunting
prevalence almost equal to the national rate (33.8%).
(Riskesdas, 2014). Stunting is an important indicator
for public health because it describes chronic energy
malnutrition in children. The impact of these poor
nutrients can last a lifetime, resulting in poor quality
of life, school performance declining due to brain
development disorders, reduced productivity and
impended of intellectual and social development.
Onis's research shows stunting can also lead to
an increase in fat mass. The high fat mass is a risk
factor for chronic diseases such as diabetes mellitus,
obesity and coronary heart disease in an adult age.
Stunting adolescents allegedly experiencing changes
in metabolism that causes increased body fat mass as
a result of chronic nutritional conditions. (Onis, M,
2011). Research on stunting teens in South America
proves that stunting children will grow into
adolescents and short adults with high fat mass, low
muscle mass and metabolic changes that are
permanent. The mechanisms that explain the causes
of high fat mass in children and adolescents stunting
until now still being studied. (Onis, 2011; Hoffman;
2000, Martins, 2004).
In normal teenagers the formation of fat mass is
influenced by epigenetic, environmental and genetic
factors. Environmental factors consist of gender, food
intake and physical activity. (Cromer, 2011; Guyton,
1991) but data on fat mass and the factors that affect
it in adolescent stunting in Indonesia are not known.
It is important to predict the presence of metabolic
disease related to risk factors to provide opportunities
for intervention such as preventive and promotive.
2 METHODS
This research was part of Jatinangor cohort Study.
Quantitative research design with cross sectional
strategy of early adolescent age 10-14 years old,
stunting, residing and attending elementary school or
junior high school in Jatinangor sub-district. School
selection was done by stratified random sampling.
Research subjects were randomly selected in each
school with the provision of healthy subjects and did
188
Megawati, G., Herawati, D. and Fatimah, S.
Correlation of Energy Intake, Sex and Physical Activity with Fat Mass in Stunting Teenagers.
In Proceedings of the 2nd International Conference on Sports Science, Health and Physical Education (ICSSHPE 2017) - Volume 1, pages 188-192
ISBN: 978-989-758-317-9
Copyright © 2018 by SCITEPRESS – Science and Technology Publications, Lda. All rights reserved
not have chronic diseases and have permission from
parents. Subjects who have abnormal body posture so
it was not possible to check the height and have an
edema excluded from the study. The subject of this
was 112 stunting teens. Data collection was
conducted in April - July 2015.
Stunting was determined by category in WHO
Growth Chart 2006 which is height curve based on
gender and age. Adolescence stated stunting if he has
a measurement of <-2 SD. Measurements of height
were performed using SECa 215 stadiometer then
converted on Height on aged with WHO Anthro Plus
software. (WHO, 2006)
Fat mass examination using data of height, date of
birth and gender. The requirements of examination
are: not exercising in the last 24, not consuming
alcohol for the last 24-48 hours, and not using
diuretics for the last 7 days. The examination was
performed after the subjects urinate maximum 30
minutes before examination, requested to remove all
the metal material attached to the body, such as belts,
rings, necklaces, coins, glasses and other metals,
weighed without the use of footwear and socks and
wear minimal clothing. Fat mass measurements were
performed using Tanita SC-240MA Bioimpedance
Analyzer (Gibson, 2005).
Furthermore, interviews were conducted on food
intake using the 24 hours recall method. Interviews
were conducted in three different occasions, two days
on school day and one on holiday. The amount of
nutrient intake was calculated by converting a large
food intake in household size form to gram first, then
calculating the amount of nutrient intake (in grams).
Physical activity was known from the
questionnaires filled by the subject. Its provide data
about the type, frequency and duration of activities
usually done in one week. The activity was
differentiated between school days and holidays.
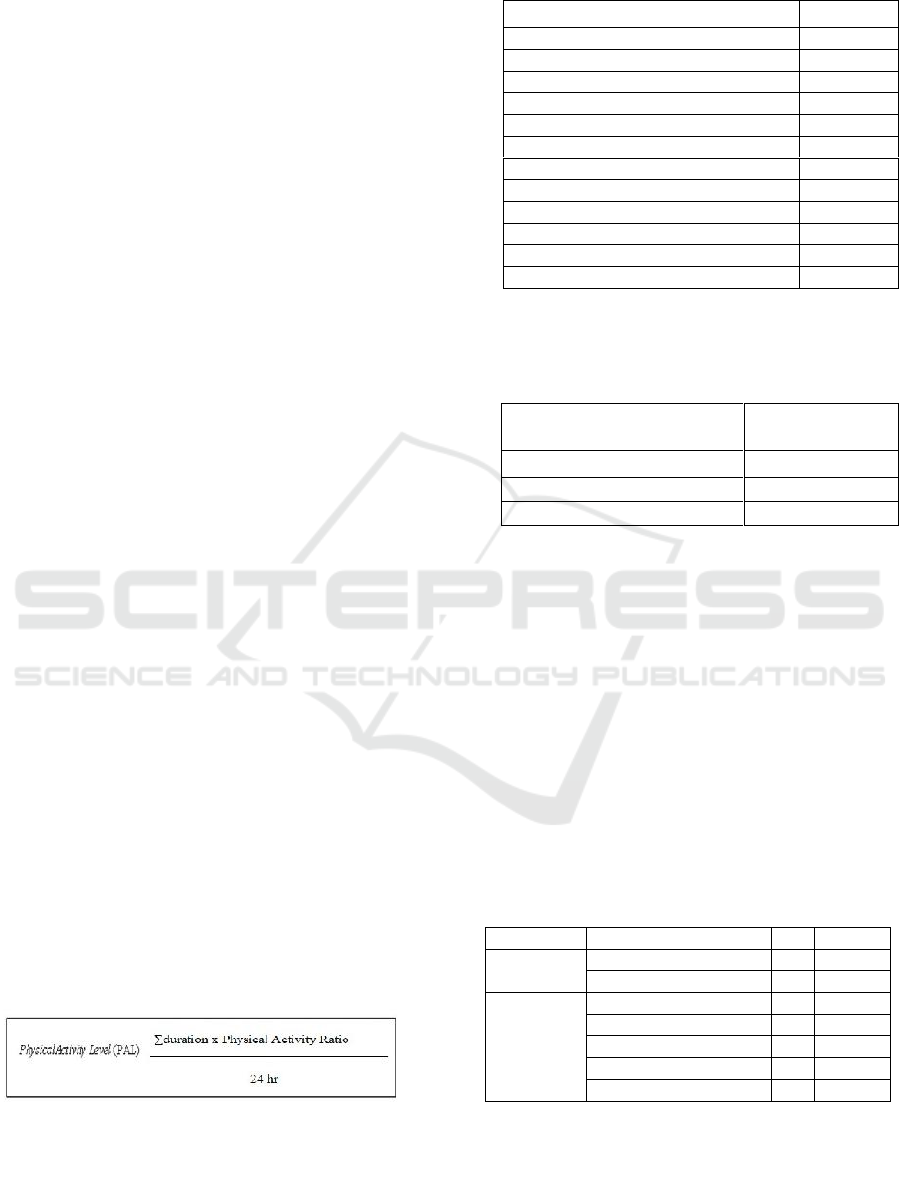
Physical Activity Level (PAL) calculation based on
PAL calculation according to FAO / WHO / UNU
(WHO Technical Report Series on Human energy
requirements 2001). The total calory spent in physical
activity is determined based on the Physical Activity
Ratio (PAR) value table and included in the Physical
Activity Level (PAL) formula according to the
following formula:
(1)
PAL = Physical Activity Level
PAR= Physical Activity Ratio (energy spent for the
type of activity per unit of time)
Source: WHO, 2001
Table 1: PAR
The calculation results are categorized according to
the physical activity category table
Table 2: Category of physical activity
Category of Physical
Activity
PAL Score
Light
1.40 – 1.69
Medium
1.70 - 1.99
Heavy
2.00 – 2.40
Source: WHO, 2001
This study received ethical approval from the
Medical Research Ethics Committee of Faculty of
Medicine Universitas Padjadjaran. Test of normality
data by using Kolmogorov-Smirnov, the data was not
normally distributed (p = 0.127).
3 RESULTS
Characteristics of subjects in the form of sex and age
data listed in table 3. Female gender slightly more
than men (55.3%) while the age spread almost evenly
at the age of 10-14 years.
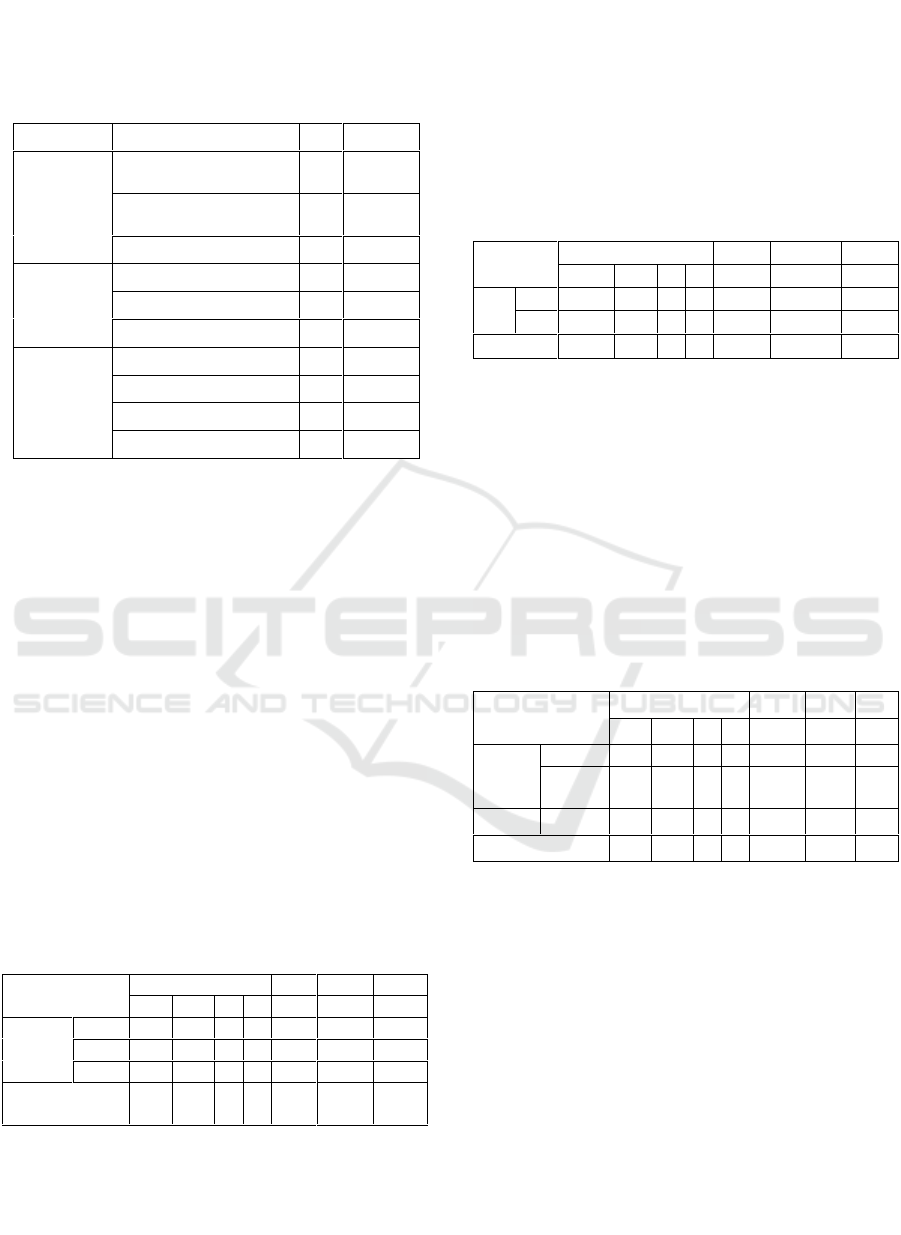
Table 3: Characteristics of study subjects.
Variabel
Category
∑
%
Sex
Female
62
55,36
Male
50
44,64
Age(years)
10
9
8,02
11
17
15,2
12
30
26,78
13
32
28,57
14
24
21,43
Energy intake, physical activity and fat mass of
study subjects is shown in Table 4. Most subjects
(54.58%) had deficiency energy intake (<80% of
Activity
PAR /time
Sleep
1.0
Driving in bus/mobil
1.2
Leisure Activity (watch TV and talk)
1.4
Eat
1.5
Sit down
1.5
Cooking
2.1
Standing , caring
2.2
Bath, clothing
2.3
Washing without machine
2.3
Walking
3.2
Gardening
4.1
Workout
4.2
Correlation of Energy Intake, Sex and Physical Activity with Fat Mass in Stunting Teenagers
189
NutritionalNumbers), had mild physical activity
(79.47%) and underdat (53,57%).
Table 4: Description of research subjects based on energy
intake, physical activity and fat mass.
Variabel
Kategori
∑
%
a
Energy
Intake
Deficiency (<80%
AKG)
61
54,58
Normal (80-110%
AKG)
41
36,71
Over (>110% AKG)
9
8,71
b
Physical
Aktivity
Level
Light
89
79,47
Medium
20
17,85
Heavy
3
2,68
c
Fat Mass
Underfat
60
53,57
Normal
47
41,97
Overfat
3
2,68
Obesity
2
1,78
Information:
a
AKG = Nutritional Nutrition Rate based on Nutritional
Nutrition Value of National Widya Karya Food and
Nutrition 2013
b
Based on Physical Activity Level
c
Classification fat mass for children and adolescents based
on age and gender
3.1 Correlation of Energy Intake with
Fat Mass
Data from the measurement of energy intake and fat
mass were tested by Spearman correlation to know
the correlation between energy intake with fat mass
in short teenager in Jatinangor. Table 5 shows the
correlation test that shows significant correlation
between energy intake and fat mass (p = 0.02), very
weak correlation strength (r<0,2) and positive
correlation direction.
Table 5: Correlation of Energy Intake with Fat Mass.
Fat Mass
n
R
P
a
b
c
d
Energy
Intake
Def
42
19
-
-
61
0,18
0,02
Nml
15
26
1
0
41
ovr
3
2
2
2
9
Total
60
47
3
2
11
2
Information:
p = Spearman's correlation test significance, significant test
at p <0.05
Fat mass: a: underfat, b: normal, c: overfat, d: obesity
3.2 Correlation of Sex with Fat Mass
Spearman correlation test was performed to
determine the correlation between sex and fat mass
Table 6 shows the correlation test showing significant
correlation between sex with fat mass (p = 0,00),
strong correlation strength (r <0,73) and negative
correlation direction.
Table 6: Correlation of Sex and Fat Mass.
Fat Mass
n
r
P
a
b
c
d
ex
♀
17
40
3
2
62
-0,73
0,00
♂
43
7
-
-
50
Total
60
47
3
2
112
Information:
p = Spearman's correlation test significance, significant test
at p <0.05
Fat Mass: a: underfat, b: normal, c: overfat,d: obesity
3.3 Correlation of Physical Activity with
Fat Mass
Table 7 shows no correlation between physical
activity and fat mass in stunting teenagers in
Jatinangor (p> 0.05).
Table 7: Correlation Physical Activity with Fat mass.
Fat Mass
n
r
P
a
b
c
d
Physica
l
activity
Light
47
37
3
2
89
0.13
0.16
Mediu
m
11
9
0
0
20
Heavy
2
1
0
0
3
Total
60
47
3
2
112
Information:
p = Spearman's correlation test significance, significant test
at p <0.05
Fat Mass: a: underfat, b: normal, c: overfat,d: obesity
4 DICUSSIONS
Fat mass will accumulate if high energy intake or low
energy expenditure or a combination of both. But
Research Hoffman et al., In Brazil shows the opposite
phenomenon in adolescent stunting. The results
showed that energy intake per kilogram of body
weight was significantly higher and the ratio of
energy intake and resting energy expenditure was also
significantly higher. The results of this study indicate
ICSSHPE 2017 - 2nd International Conference on Sports Science, Health and Physical Education
190

a metabolic change in children of stunting with
normal weight (Wilson, 2012, Hoffman, 2000).
Longitudinal studies and cohorts that observed
metabolic changes in stunting generally observed the
changing conditions on stunting subjects who were
previously undernourished but later recovered and
had good nutritional status.
In the Jatinangor study, there was strong
suspicion that stunting teenagers in Jatinangor also
have metabolic changes such as data presented in
Brazil, but in this study there is no history of growth
and nutritional status of the study subjects at first
growth acceleration (age 0-2 years) although
suspected nutritional status of respondents when
under 2 years of age does not vary much with the
current condition considering stunting was a picture
of chronic malnutrition (Martorell, 2010). It appears
that stunting of teenagers in Jatinangor at this time of
study has not undergone a nutritional improvement,
so there has not been a catch-up fat phenomenon as
occurs in short teenagers in other countries. This may
explain why the fat mass of stunting teens in this
study was mostly underfat (53.57%) (table 4).
Sawaya et al, who conducted research in Brazil
from 1990 to 2004, found that children with less
nutrition (skinny and short) grew into adolescents and
obese adults. In Indonesia, it seems that atunting
teenagers have not experienced increased fat mass
because of the absence of nutritional improvements,
although this condition needs to watch out, assuming
that when short teenagers grow up and experience
improved nutritional status or energy intake so
excessive then at that time an increase in body fat
mass causing an increased risk of metabolic-related
illness (Hoffman, 2000; Martin, 2004; Wilson HJ,
2012).
In this study known as 89 people (79.47%) have
mild activity level. World Health Organization
(WHO) in 2010 stated that around 81% of adolescents
aged 11-17 years have less physical activity when
compared with WHO recommendations in that age
group. This data is consistent with data from Basic
Health Research (RISKESDAS) in 2013 which
shows the prevalence of physical inactivity in
children and adolescents aged 10-14 years is 66.9%
(WHO, 2015).
According to WHO, the prevalence of lack of
physical activity is higher in countries with increased
automation of work and the use of vehicles as a means
of transportation. Some environmental factors
associated with urbanization may cause the
population to become less active (Kenneth, 2000,
WHO, 1995). Behavior sedentari or sit-down
behavior, lying in the daily at home, (front computer,
reading, watching TV, playing video games) and
travel / transportation by motor vehicle looks much
done by teenagers in Jatinagor.
There is an interesting data in this study,, although
the average research subject has a low level of
physical activity but not high fat mass. This is
supported by data that teen energy intake of stunting
in Jatinangor is generally low. If this teenager's
energy intake is improved according to his needs,
then physical activity also needs to be adjusted with
the WHO recommendation that there is no increase in
excess fat mass and growth of adolescents short
stature can be optimal.
The Fin Twin Study analyzing 5 consecutive
cohort studies in 4343 subjects aged 22 to 27 stated
that physical activity would significantly increase
muscle mass compared to subjects with sedentary
lifestyles and would decrease the genetic effect on the
risk of obesity and abdominal obesity (Clemente,
2011; Wilson, 2012)
Physical activity will increase the body's energy
requirements, so increased physical activity will
cause a decrease in body mass index. Physical activity
may inhibit the risk of obesity, especially in
individuals with genetic susceptibility. Physical
activity performed regularly and measurably over a
relatively long time will increase fat-free (bone and
muscle) mass, decrease fat mass and increase Growth
Hormone. This increase in the hormone stimulates the
bone growth center of the epiphyseal plate. From the
results of the study found sedentari lifestyle or
lifestyle with very minimal activity will cause linear
growth is not optimal, muscle mass is smaller and
increased fat mass (Cromer, 2011; Guyton, 1991).
5 CONCLUSION
Any change in energy intake in a stunting adolescent
will affect the fat mass, as well as sex, but physical
activity does not affect the fat mass.
REFERENCES
Clemente AP, Santos CL, Martins VJB, Benedito-Silva A,
Albuquerque MP, Sawaya AL. 2011, Mild Stunting is
Associated With Higher Body Fat: Study of a Low-
Income Population. Pediatr (Rio J).;87(2):138-44.
Cromer B. 2011, Adolescent development In: Nelson's
Textbook of Pediatrics. 18 ed. Philadelphia: Saunders
Elsevier, p. 649-659.
FAO/WHO/UNU. 2001. Human energy requirements.
WHO Technical Report Series, no. 724. Geneva: World
Health Organization.
Gibson. R, 2005. Principles of Nutritional Assessment.
NewYork. Oxford University Press.
Guyton, Arthur C, 1991. Textbook of Medical Physiology
(8th ed.). Philadelphia: W.B. Saunders..p. 978-985.
Correlation of Energy Intake, Sex and Physical Activity with Fat Mass in Stunting Teenagers
191

Hoffman D, Sawaya A, Verreschi I, Tucker K, Roberts S.
2000. Why Are Nutritionally Stunted Children at
Increased Risk of Obesity? Studies of Metabolic Rate
and Fat Oxidation in Shantytown Children from Sao
Paulo, Brazil. Am J Clin Nutr.;72:702-7.
Hoffman DJ, Sawaya AL, Coward A, Wright A, Martins
P.A, 2000. Energy expenditure of stunted and
nonstunted boys and girls living in the shantytowns of
São Paulo, Brazil. A J Clin Nutrition., 72:1025-1031
Kenneth JE, 2000. Human Body Composition: In vivo
Methods. Physiol Rev.;80(649-680).
Kesehatan Kementerian, 2013. Laporan Nasional: Riset
Kesehatan Dasar (Riskesdas). Jakarta 2014.
Martins PA, Hoffman DJ, Fernandes MTB, Nascimento
CR, Roberts SB, Sesso R, et al. 2004. Stunted children
gain less lean body mass and more fat mass than their
non-stunted counterparts: a prospective study. British
Journal of Nutrition.;92:819–25.
Martorell R, Horta BL, Adair LS, Stein AD, Richter L, Fall
CH, et al., 2010.Weight gain in the first two years of life
is an important predictor of schooling outcomes in
pooled analyses from five birth cohorts from low- and
middle-income countries. J Nutr.;140(2):348-54.
Onis M, Blossner M, Borghi E, 2011. Prevalence and
Trends of Stunting Among Pre school Children 1999-
2020. Geneva, WHO.
WHO, 1995. Physical Status: The Use and Interpretation
of Anthropometry. Geneva: WHO.
WHO, 2006. Multicentre Growth Reference Study Group.
WHO Child Growth Standards: length/height-for-age,
weight-for-age, weightfor-length, weight-for-height
and body mass index-for-age:methods and
development. Geneva: World Health Organization..
www.who.int/childgrowth.
WHO. 2015 [updated January 2015; cited 2015], Physical
Activity, http://www.who.int/mediacentre/factsheets.
Wilson HJ, Dickinson J, Hoffman DJ, Griffiths PL, Bogin
B, Varela-Silva M, 2012. Fat Free Mass Explains The
Relationship Between Stunting and Energy Expenditure
in Urban Mexican Maya Children. Annals of Human
Biology.
ICSSHPE 2017 - 2nd International Conference on Sports Science, Health and Physical Education
192
