
Indonesian Economic Growth Rate:
Inflation and Unemployment Rate Analysis
Sumartini Sumartini
1
and A Riswanto
2
1
Universitas Pendidikan Indonesia, Setiabudhi 229 street Bandung, Indonesia
2
STKIP PGRI Sukabumi, West Java, Indonesian
Keywords: Economic Growth, Inflation, Unemployment.
Abstract: The economic growth of the country is influenced by several factors, besides the import export factor, the
factors that often become the spotlight are the inflation rate and the unemployment rate. This study aims to
determine the extent of the relationship between economic growth in Indonesia with inflation and un-
employment rates. The method used is a statistical analysis with linear regression and simple correlation
approach, using a 32 year sample, originating from Central Bureau of Statistics (BPS). This study resulted in
more influential level of inflation affecting Indonesia's economic growth rate for 32 years (4 decades),
meaning that the increasing of inflation and unemployment resulted in the decreasing of Indonesian economic
growth rate.
1 INTRODUCTION
The Indonesian economy since the economic crisis in
mid-1997 made the condition of Indonesia's economy
as well as employment slump. Since then, Indonesia's
economic growth has also never reached 8 percent. In
fact, the problem of inflation and unemployment is
closely related to economic growth (Mohseni &
Jouzaryan, 2016). If economic growth exists,
automatic absorption of labor also exists and also the
level of insulation will get better. Each one percent
economic growth, absorbed workforce can reach 400
thousand people. If Indonesia's economic growth is
only 3-4 percent, it will only absorb 1.6 million
workers, while job seekers reach an average of 2.5
million per year. So, every year there must be some
job seekers who do not get a job and cause the number
of unemployed in Indonesia to increase.
Imagine, in 1997, the number of open
unemployed reached 4.18 million. Further, in 1999
(6.03 million), 2000 (5.81 million), 2001 (8,005
million), 2002 (9.13 million) and 2003 (11.35
million). Meanwhile, employment and
unemployment data showed, in 2001: working age
(144.033 million), labor force (98.812 million),
working population (90.807 mil-lion), open
unemployed (8,005 million), half unemployed (6.010
million), half Voluntary unemployed (24,422
million) (Bps.go.id, 2017).
One aspect to look at the performance of the
economy is how effective the use of existing
resources so that employment is the concern of
policymakers. So that the disorder and the decrease of
employment and long-term economic growth,
resulting in a negative relationship between long-term
economic growth and unemployment rate (Chen,
Hsu, & Lai, 2016).
Economic growth is usually followed by the
creation of new jobs. As the economy grows, there is
a growth in the production of goods and services.
When this happens then the need for labor to produce
goods and services will grow. Economic growth and
unemployment have a strong relationship because the
working population contributes to produce goods and
services while unemployment does not contribute. In
addition, misplacing the role of inflation will cause
the growth of a country's economy and even endanger
the country's economic growth (Baharumshah,
Slesman, & Wohar, 2016). A study conducted by
Bittencourt indicates that inflation is detrimental to
Latin American countries experiencing
hyperinflationary episodes In the 1980s (Argentina,
Bolivia and Brazil) and the early 1990s (Brazil and
Peru (Bittencourt, 2012).
This research is conducted to see more deeply
about whether there is a relationship between the
level of insulation and the level of appreciation with
the level of economic growth of Indonesia during the
last 32 years or 4 decades.
714
Sumartini, S. and Riswanto, A.
Indonesian Economic Growth Rate: Inflation and Unemployment Rate Analysis.
In Proceedings of the 2nd International Conference on Economic Education and Entrepreneurship (ICEEE 2017), pages 714-717
ISBN: 978-989-758-308-7
Copyright © 2017 by SCITEPRESS – Science and Technology Publications, Lda. All rights reserved

2 METHODS
The population used in this study is all data related to
Unemployment and economic growth recorded in
BPS (Central Bureau of Statistics). The sample is
defined as part or whole population by a particular
method as part or whole population by a particular
method as a representative part of the population. The
sampling technique used is purposive sampling with
the aim to get the appropriate sample with the purpose
of research (Sugiyono, 2012).
The purposive sampling method is a sampling
method based on certain considerations or criteria.
The data criteria in this study are as follows: data that
has been recorded in the Central Hall of Statistic, data
that has criteria for complete report data for a certain
period. Based on sample criteria, the data used from
BPS is for 32 years (4 decades). In this study data
analysis used by the authors is the Simple Linear
Regression Test and Product Moment Pearson
Correlation (Santoso, 2009).
3 RESULTS AND DISCUSSION
Below is a table showing the data Unemployment,
Invasion and Economic Growth at Central Hall
Statistic period 1985-2016 (4 decades) are:
Table 1: Average data on economic growth, inflation and
unemployment 4 decade year 1985 to 2016.
Decades
Economic
Growth
Inflation
Unemployment
1
5,91
6,91
2,63
2
3,41
16,79
4,86
3
5,19
9,43
9,46
4
5,19
9,43
9,46
Source: BPS and BI (processed)
Form the hypothesis to test the coefficients b0 and b1
(Santoso, 2009).
H0: β0 = 0, H0: β0 0 DanH1: β1 = 0, H0: β1 0
Where β0 and β1 are parameters of the regression
model yi = β0 + β1 χi + εi (Sunarto, 2007).
Table 2: Model summary
b
Model
R
R
Square
Adjusted R
Square
Std. Error of
the Estimate
d
i
m
e
n
s
i
o
n
0
1
,861
a
,742
,724
1,92548
a. Predictors: (Constant), Unemployment Rate, Inflation
Rate
b. Dependent Variable: Indonesian Economic Growth
Rate
• The R2 (R square) value indicates that 74.2% of the
"Inflation Rate" variance and the "Unemployment
Rate" variance can be explained by changes in the
"Indonesian Economic Growth".
• ANOVA table above indicates that the regression is
statistically very significant with the value of F =
41,723 for the degrees of freedom k = 1 and nk-1 = 4
- 1 - 1 = 2 and P-value = 0,000 which is much smaller
than α = 0.05 .
Table 3: ANOVA
Model
Sum of
Squares
df
Mean
Square
F
Sig.
1
Regression
309,375
2
154,688
41,723
,000
a
Residual
107,517
29
3,707
Total
416,892
31
a. Predictors: (Constant), Unemployment Rate, Inflation
Rate
b. Dependent Variable: Indonesian Economic Growth Rate
• Test F simultaneously test the hypothesis H0: β1 =
β2 = β3 = ... βk = 0 to H1: not all βi, ί = 1, 2, ..., k are
equal to zero. But since at the simple regression there
is only one β1, then we just test H0: β0 = 0 to H1: β1
0. From the ANOVA table it is clear that H0 is
rejected because P-value = 0.000 is smaller than α =
0.05
Indonesian Economic Growth Rate: Inflation and Unemployment Rate Analysis
715
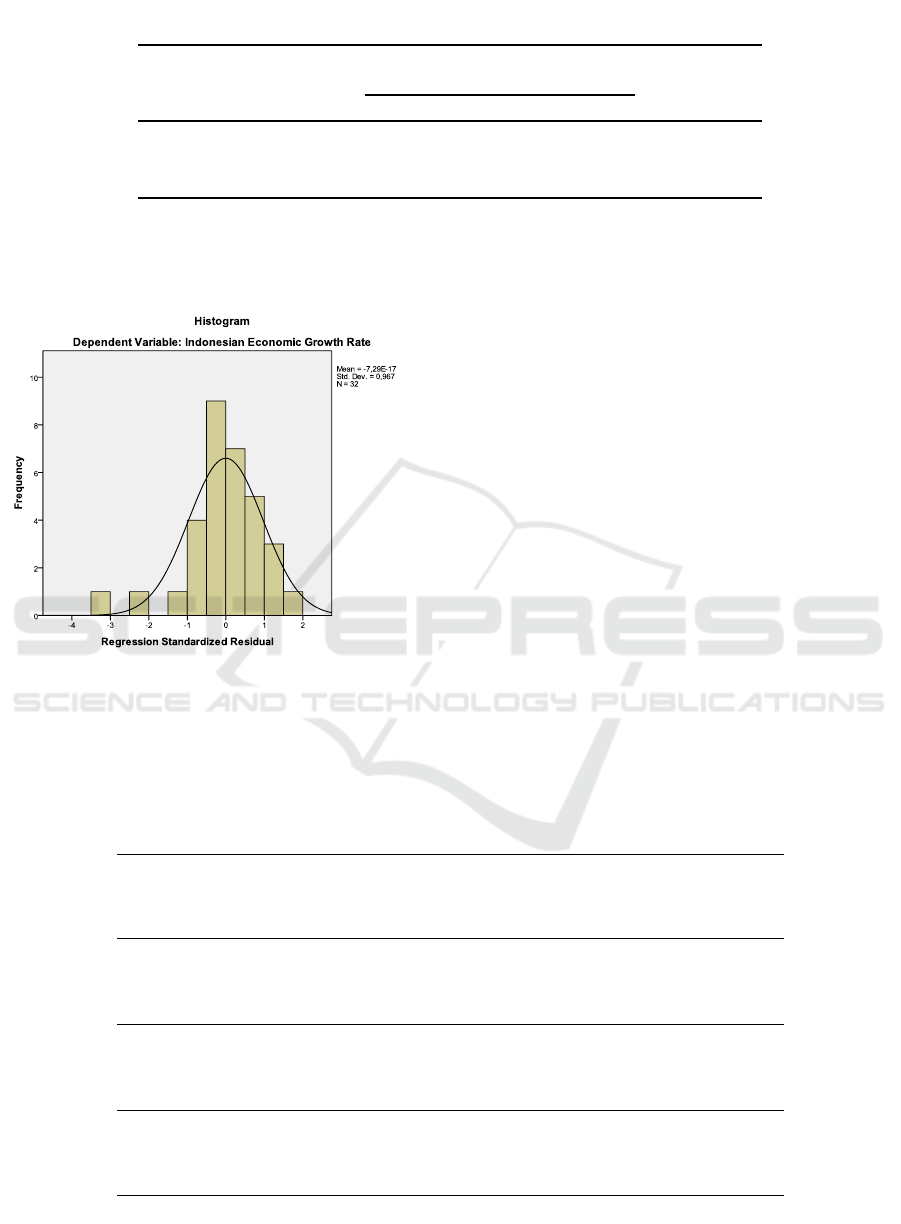
Table 4: Coefficient
Model
Unstandardized
Coefficients
Standardized
Coefficients
t
Sig.
B
Std. Error
Beta
1
(Constant)
7,936
,872
9,097
,000
Inflation Rate
-,245
,027
-,858
-9,102
,000
Unemployment Rate
-,089
,130
-,065
-,684
,499
a. Dependent Variable: Indonesian Economic Growth Rate
Figure 1: Histogram analisys regression.
• The equation of the regression line using the least
squares method (least square method) obtained is:
Ŷ = 7,936 - 0,245 x - 0,089 z
Where ŷ = Indonesia Economic Growth Rate, x =
Inflation Rate and z = Unemployment Rate
• To test the significance of each regression
coefficient used statistical test t. To test β1: H0: β1 =
0 to H1: β1 0. In the value can t = 9.097 with degrees
of freedom n - 2 = 4 - 2 = 2 and P-value = 0.000. This
is strong evidence of rejection H0: β1 = 0, since P-
value = 0.000 is smaller than α = 0.05
Product moment correlation is used to know the
degree of relationship and contribution of
independent variable or independent with dependent
variable or dependent. The technical analysis of the
product moment correlation includes the parametric
technique which uses the data and the ratio with the
ratio requirement. The product moment correlation is
denoted by small r with the provision that the value
of r is not more than the price (-1 ≤ r ≤ 1). If the value
of r = -1 means negative perfect correlation; R = 0 no
correlation; And r = 1 means very strong correlation
(Sunarto, 2007).
Table 5: Results of statistics calculations
Indonesian
Economic
Growth Rate
Inflation
Rate
Unemployment Rate
Indonesian Economic
Growth Rate
Pearson
Correlation
1
-,859
**
-,073
Sig. (2-tailed)
,000
,693
N
32
32
32
Inflation Rate
Pearson
Correlation
-,859
**
1
,009
Sig. (2-tailed)
,000
,959
N
32
32
32
Unemployment Rate
Pearson
Correlation
-,073
,009
1
Sig. (2-tailed)
,693
,959
N
32
32
32
**. Correlation is significant at the 0.01 level (2-tailed).
ICEEE 2017 - 2nd International Conference on Economic Education and Entrepreneurship
716

The results above data shows the value of r = -
0.859 means the relationship between the rate of
inflation with the level of economic growth Indonesia
shows a very strong relationship and Negative and
negative pattern. This means that the higher the rate
of inflation will result in lower economic growth, as
well as the unemployment rate, but not as much as the
effect caused by the inflation rate is the same as the
result of research conducted by Vinaya who
conducted research in 32 Asian Countries
(Vinayagathasan, 2013). Furthermore, the role of
government in making regulations and legislation is
very helpful in order to succeed the economic growth
of a country (Huang & Ho, 2016). Likewise the
business community that always has the innovation
and creativity can maximize its potential to support
the development and economic growth in the State of
Indonesia (Riswanto, 2016).
4 CONCLUSIONS
This research concludes some things that is that both
factors are examined both the level of inflation and
unemployment has a solvent to the economic growth
rate Indonesia country. The second, it can be
concluded that the level of insulation has a significant
influence on the level of economic growth. Third, the
need for cooperation of various parties, both
communities, governments and other countries to
increase economic growth in Indonesia.
REFERENCES
Baharumshah, A. Z., Slesman, L., & Wohar, M. E. (2016).
Inflation, inflation uncertainty, and economic growth
in emerging and developing countries: Panel data
evidence. Economic Systems.
shttp://doi.org/10.1016/j.ecosys.2016.02.009
Bittencourt, M. (2012). In fl ation and economic growth in
Latin America : Some panel time-series evidence ☆
. Economic Modelling, 29(2), 333–340.
http://doi.org/10.1016/j.econmod.2011.10.018
Bps.go.id. (2017). Pengangguran Terbuka Menurut
Pendidikan Tertinggi yang Ditamatkan 1986 - 2017.
Retrieved from
https://bps.go.id/Subjek/view/id/6#subjekViewTab3
|accordion-daftar-subjek1
Chen, B., Hsu, M., & Lai, C. (2016). Relation between
growth and unemployment in a model with labor-
force participation and adverse labor institutions R.
Journal of Macroeconomics, 50, 273–292.
http://doi.org/10.1016/j.jmacro.2016.10.004
Huang, C., & Ho, Y. (2016). North American Journal of
Economics and Finance Governance and economic
growth in Asia q. North American Journal of
Economics and Finance, (100).
http://doi.org/10.1016/j.najef.2016.10.010
Mohseni, M., & Jouzaryan, F. (2016). Examining the
Effects of Inflation and Unemployment on Economic
Growth in Iran ( 1996-2012 ). Procedia Economics
and Finance, 36(16), 381–389.
http://doi.org/10.1016/S2212-5671(16)30050-8
Riswanto, A. (2016). The Role of the Entrepreneur in
Innovation and in Economic Development. In
Advances in Economics, Business and Management
Research, volume 15 - 1st Global Conference on
Business, Management and Entreupreuneurship
(GCBME-16 ). Bandung: Atlantis Press.
http://doi.org/10.2991/gcbme-16.2016.137
Santoso, S. (2009). Panduan Lengkap Menguasai Statistik
dengan SPSS 18 PASW. Jakarta: PT Elex Media
Komputindo.
Sugiyono. (2012). Metodologi Penelitian Bisnis (XII).
Bandung: Alfabeta.
Sunarto, & R. (2007). Pengantar Statistika Untuk
Penelitian : Pendidikan, Sosial, Komunikasi,
Ekonomi, dan Bisnis. Bandung.: Alfabeta.
Vinayagathasan, T. (2013). Journal of Asian Economics
Inflation and economic growth : A dynamic panel
threshold analysis for Asian economies. Journal of
Asian Economics, 26, 31–41.
http://doi.org/10.1016/j.asieco.2013.04.001
Indonesian Economic Growth Rate: Inflation and Unemployment Rate Analysis
717
